10-Year Treasury Yield: Evolution and Outlook
We cover the forces that influenced the 10-year Treasury yield starting in 2020 and wrap up with our perspectives on upcoming factors that might impact this market.

This analysis reflects market conditions and information available at the time of publication (September 2023). It is provided for educational and historical context.
In this article, we'll cover the complexities and forces that have influenced the 10-year Treasury yield starting in 2020. We'll wrap up with our perspectives on upcoming factors that might impact this market.
1. January 2020–July 2020: The Steep Decline of Treasury Yields in the Pandemic
In early 2020, the bond market landscape experienced significant turbulence, largely due to the unforeseen impacts of the COVID-19 pandemic. A range of factors were instrumental in driving the changes observed in the 10-year Treasury yield during this timeframe:
- Repercussions of the Pandemic: The rapid spread of the virus led to extensive global lockdowns and significant economic setbacks. With growing uncertainty, investors gravitated towards U.S. Treasury securities, including 10-year Treasury bonds, pushing up their prices and subsequently driving yields lower.
- Expansive Monetary Policy by Central Banks: In response to the pandemic, the Federal Reserve slashed interest rates to almost zero in March 2020, causing Treasury yields to drop substantially.
- Unstable Economic Horizon: As the data unveiled the vast economic damage—from skyrocketing unemployment to steep drops in a wide range of other economic indicators—these unfavorable macroeconomic conditions negatively affected the 10-year Treasury yield.
- Risk Aversion: Much like other safe-haven assets, the 10-year Treasury yield is influenced by the dominant risk mood in the market. During times marked by intensified doubt or pessimism, investors often gravitate towards these assets, leading to a decrease in yields.
- Economic Stimulus Packages: The announcement and implementation of substantial fiscal stimulus packages during the pandemic played a role in the rebound of the 10-year Treasury yield by the end of 2020.
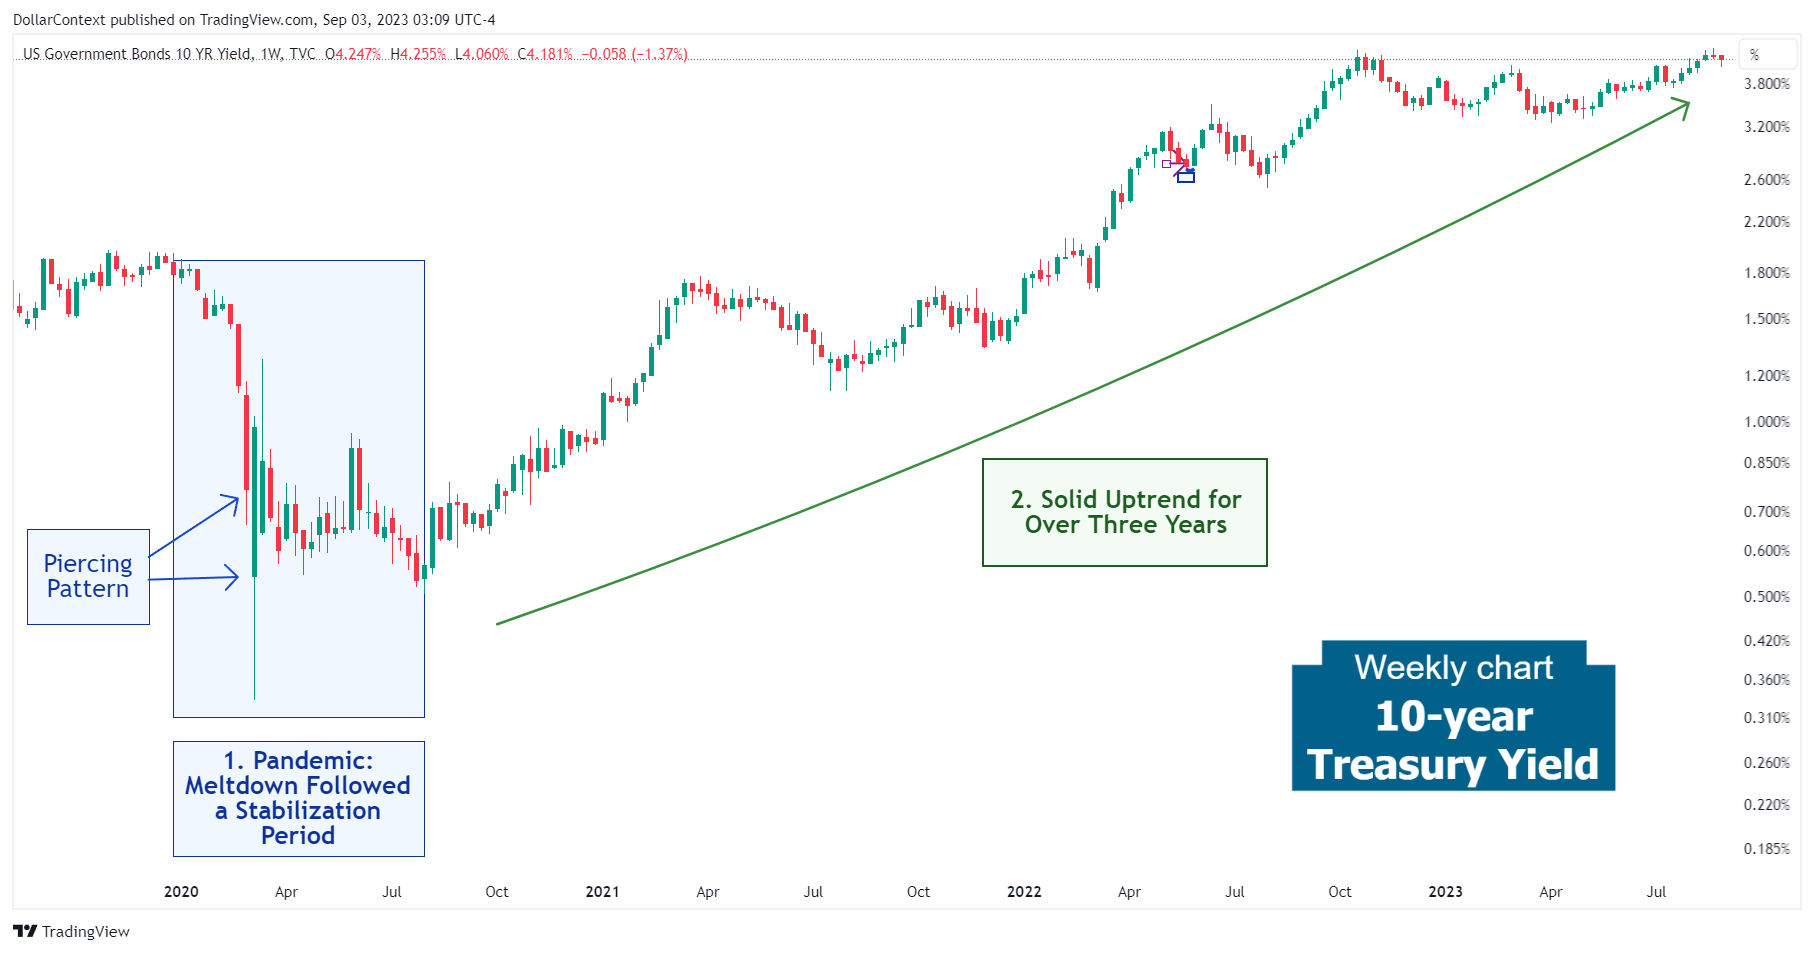
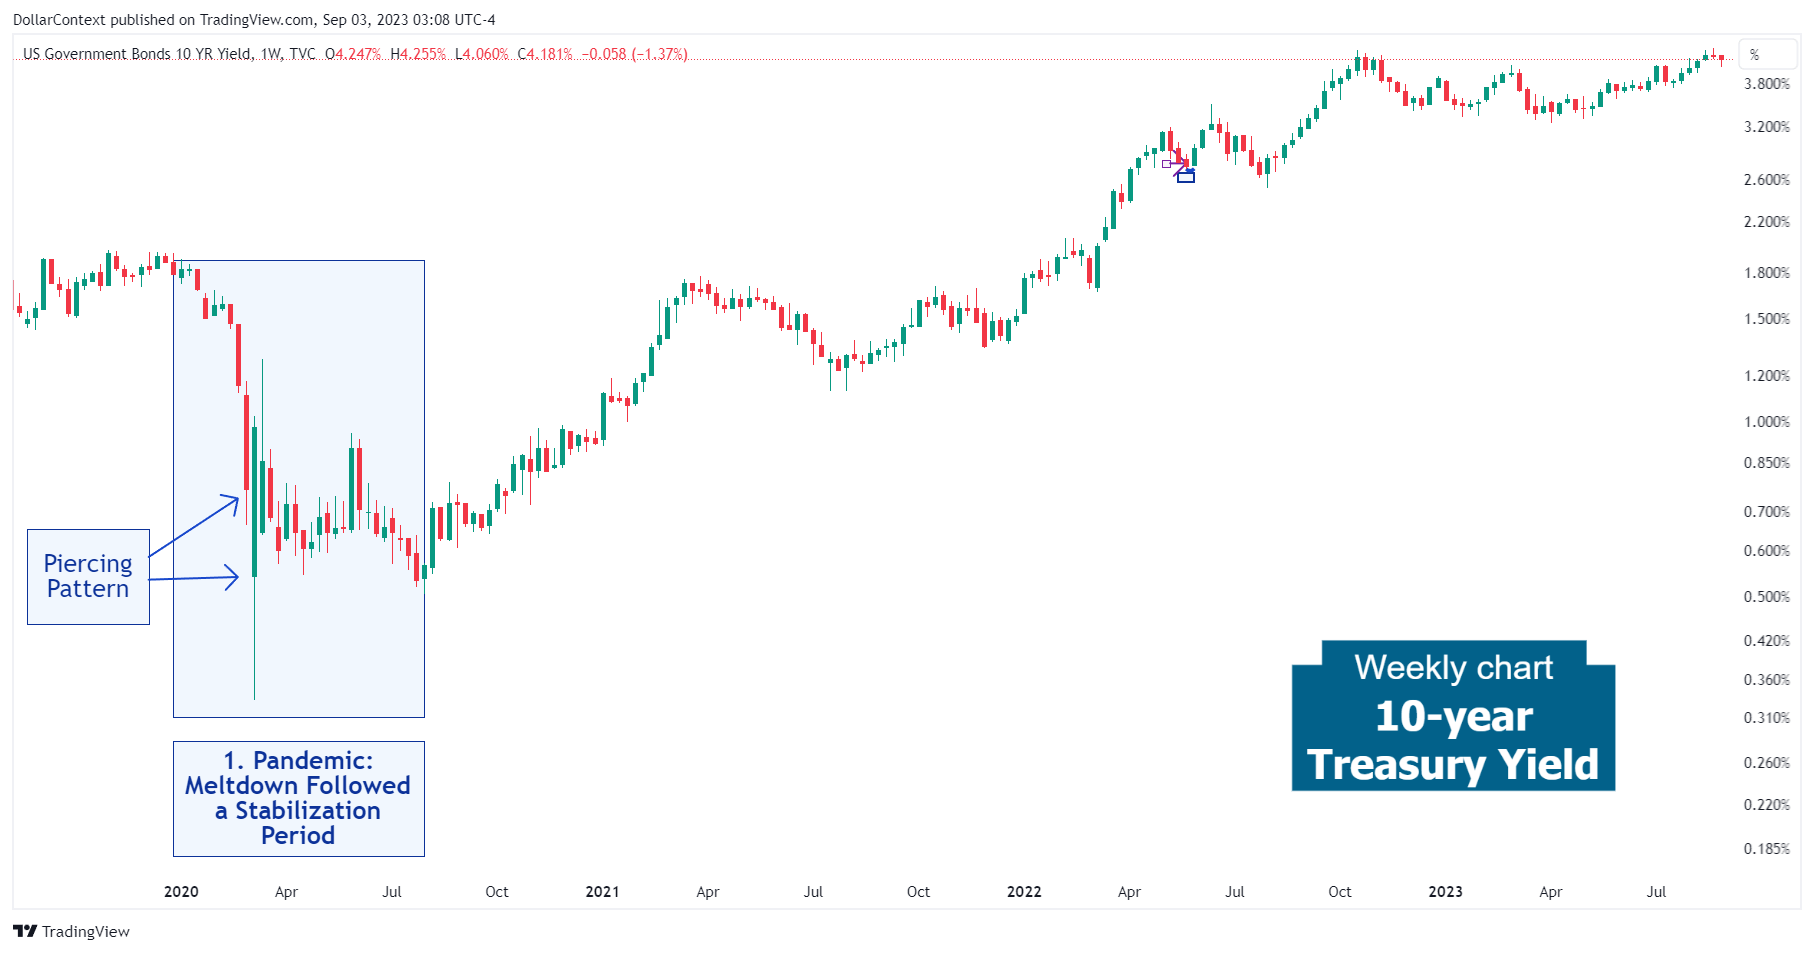
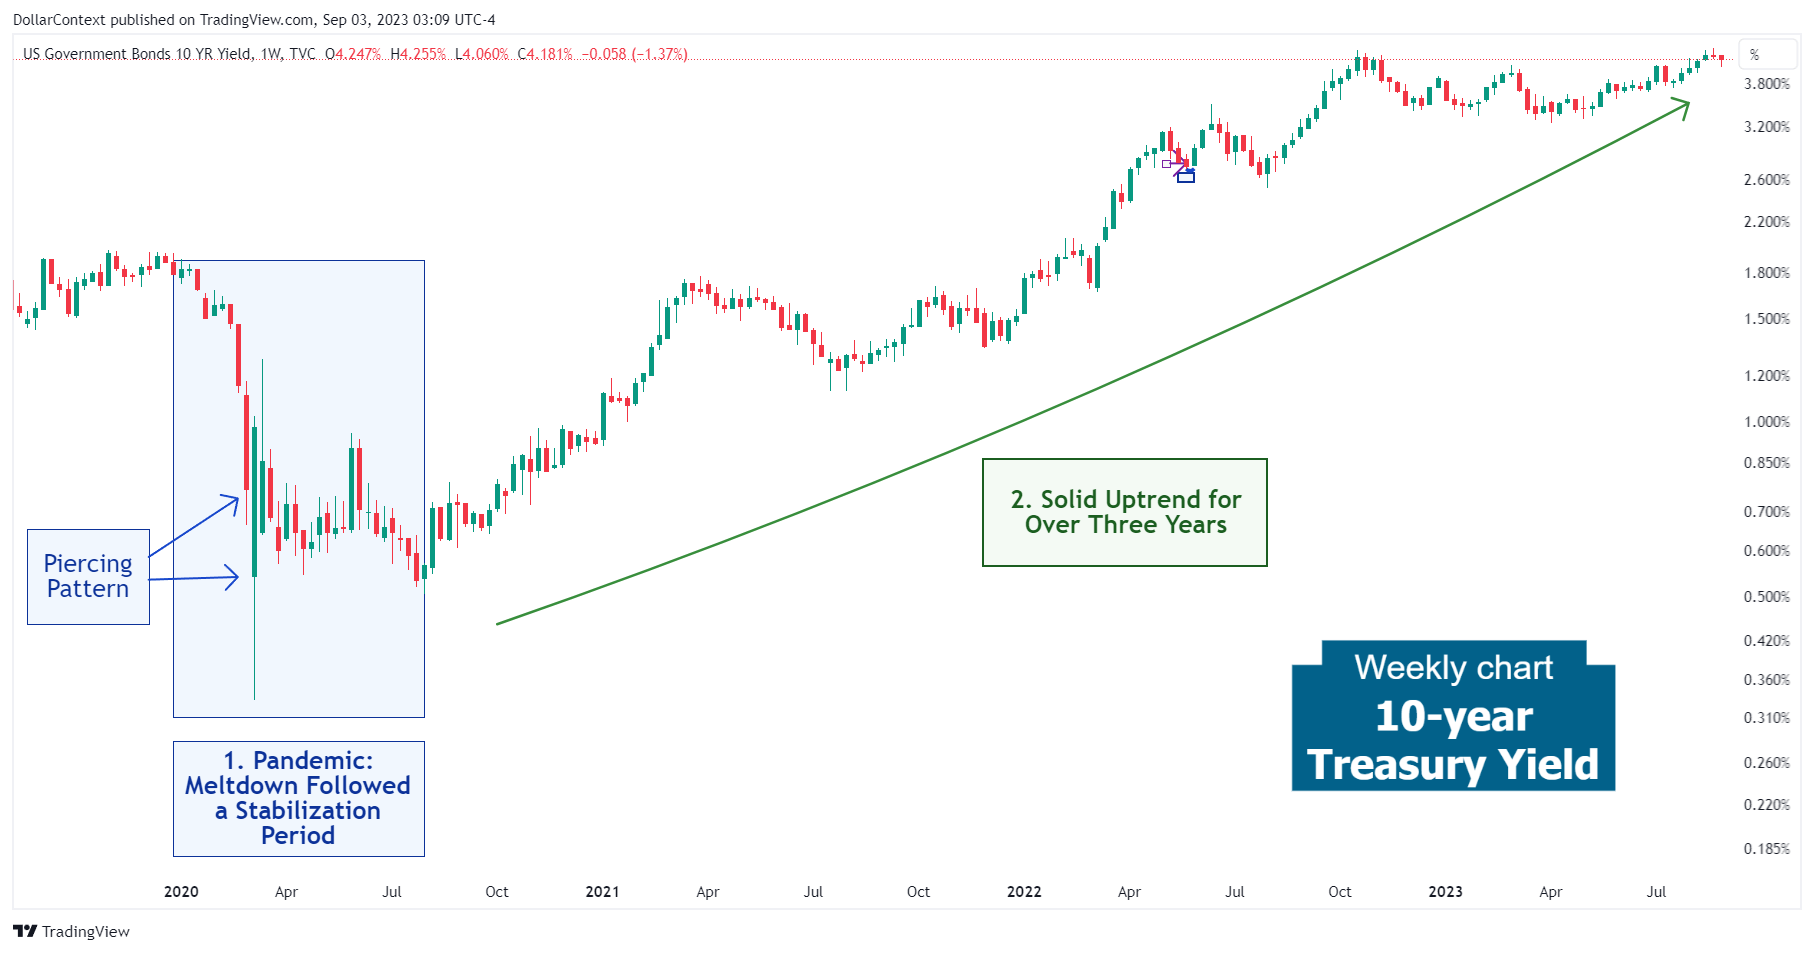
From a candlestick analysis perspective, the meltdown in March 2000 concluded with a piercing pattern. Then the 10-year Treasury market initiated a period of stabilization before the subsequent uptrend.

2. August 2020–August 2023: The Prolonged and Robust Uptrend
For over three years, the 10-year Treasury yield has been on a consistent upward climb. Several elements have fueled this sustained rise:
- Projections of Surging Inflation and Their Later Validation: The significant injections of fiscal and monetary stimulus raised concerns among some investors about potential future inflation, subsequently affecting Treasury yields. Over time, those inflation expectations became increasingly evident, hitting levels not seen since the 1980s.
- Steep Interest Rate Increases by the Federal Reserve and Other Major Central Banks: From March 2022 to June 2023, the Federal Reserve began an aggressive tightening cycle to combat inflation. After hiking rates from close to 0% to above 5%, the 10-year Treasury market faced significant pressure.
- Economic Rebound Following the Pandemic: As the global economy started to rebound from the profound impacts of the pandemic, several indicators showed signs of improvement, including retail sales and consumer confidence.
The chart below illustrates this significant uptrend in the 10-year yield during this period:

3. Outlook for the Second Half of 2023 and 2024
The following perspective reflects expectations based on information and policy signals available at the time of writing.
In the intermediate term, these emerging factors are expected to influence the direction of government bonds, including the 10-year Treasury:
- Threats of Economic Contraction: The Federal Reserve's assertive rate hikes, combined with concerning indicators like the inverted yield curve, point towards a potential economic slump in 2024. In recessionary times, central banks typically cut interest rates. Also, market players tend to shift from riskier assets to bond purchases, leading to a drop in yields.
- How Markets Respond to an Inverted Yield Curve: Historical data shows that the appetite for high-risk assets remains strong either at the beginning or during a yield curve inversion. As a result, the shift towards safer assets and the subsequent decrease in bond yields usually manifest at a later stage.
- The Role of AI in Enhancing Productivity: The advent of the artificial intelligence (AI) age, with its promise to boost efficiency and productivity, currently appears to be a major force fueling this increasing tilt towards risk.


