
2-Year Treasury Yield: Evolution and Outlook
We explore the dynamics and patterns that have influenced the 2-year Treasury yield and wrap up by forecasting potential trends in this market.

In this article, we'll explore the dynamics and patterns that have influenced the 2-year Treasury yield since 2020. We'll wrap up by forecasting potential trends in this market.
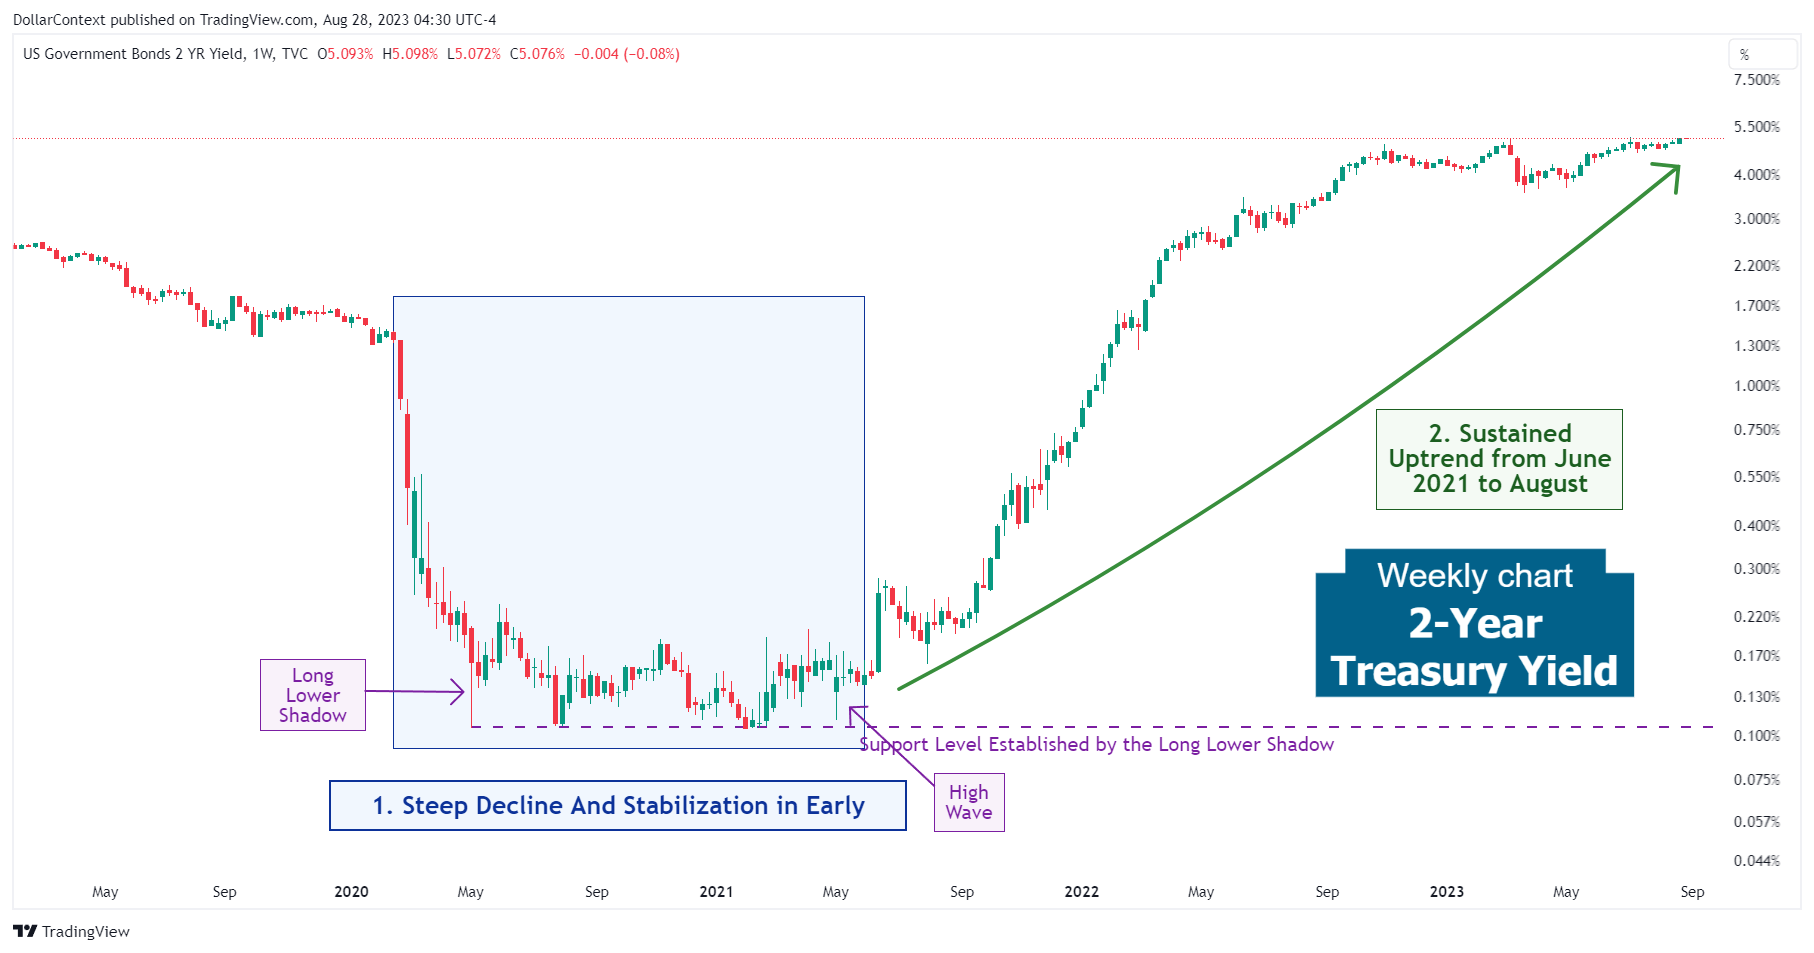
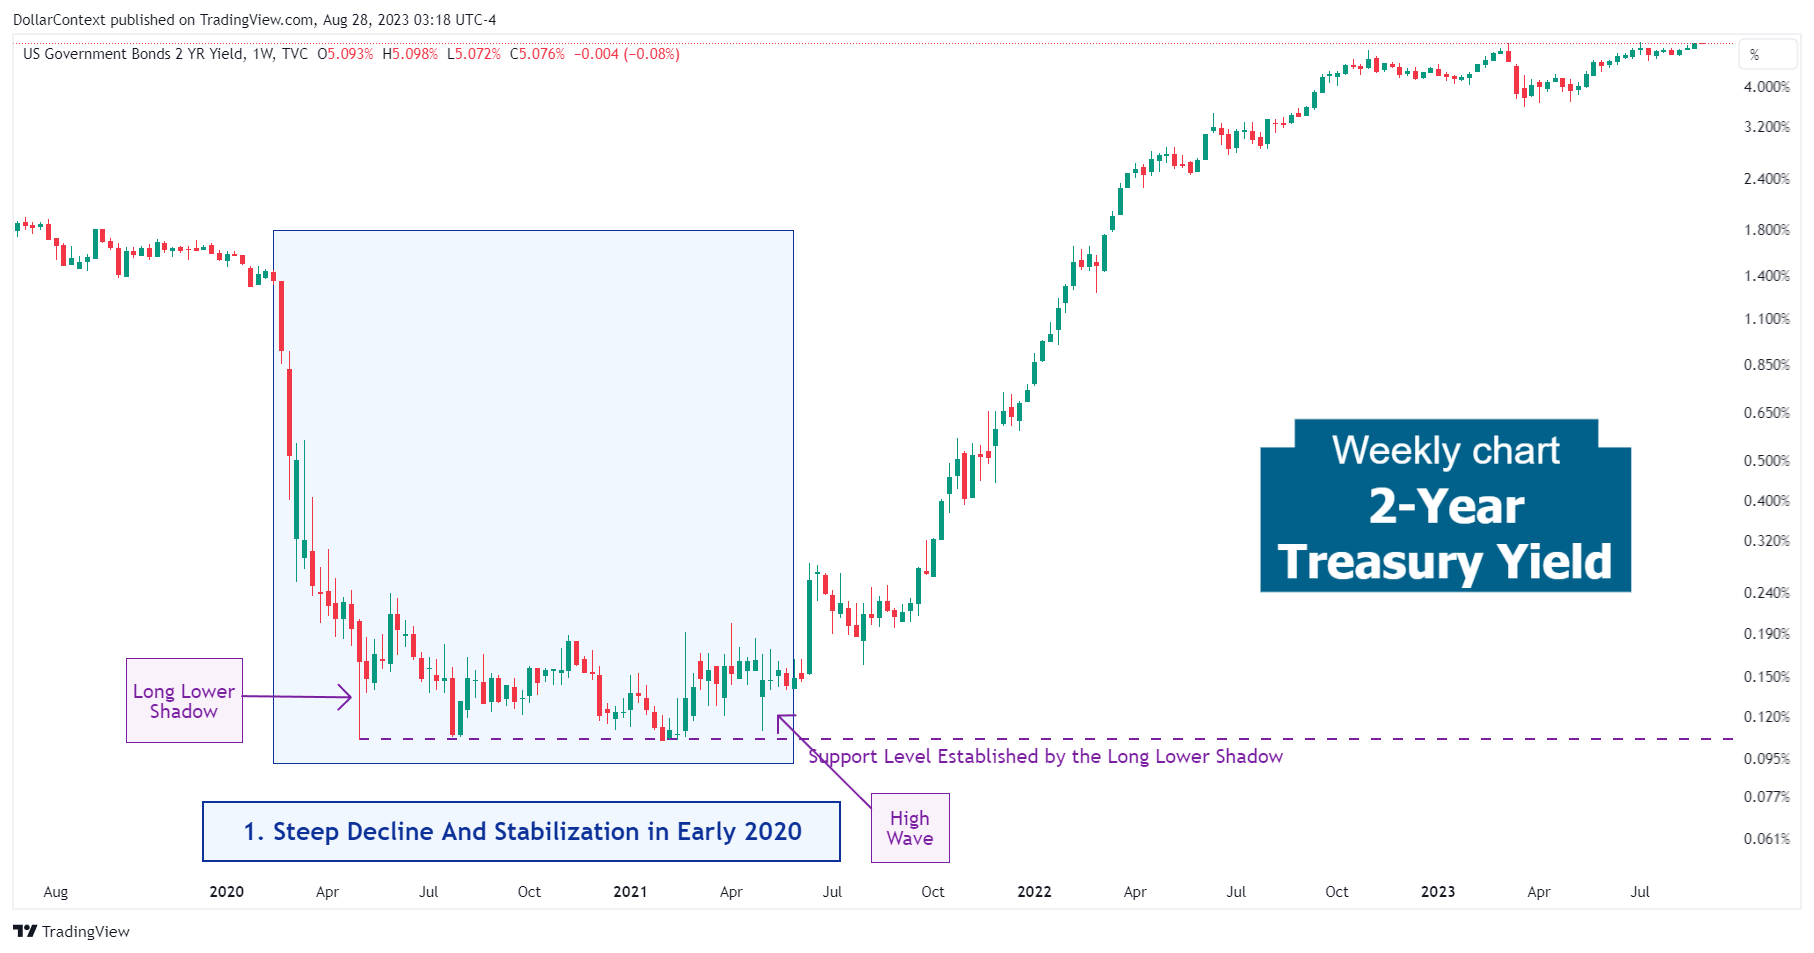
1. January 2020–May 2021: The Steep Decline Followed by Stabilization
During the first half of 2020, the global financial landscape, especially in the U.S., experienced significant turmoil, largely due to the unforeseen impacts of the COVID-19 pandemic.
The 2-year Treasury yield is particularly sensitive to short-term economic expectations and monetary policy, as indicated by the Fed Funds rate. Several factors drove its fluctuations during this period:
- COVID-19 Pandemic Impact: The rapid spread of the virus led to lockdowns and severe economic contractions globally. As uncertainty mounted, investors flocked to the safety of U.S. Treasuries, driving up prices and inversely pushing down yields.
- Federal Reserve's Monetary Policy: In response to the pandemic, the Federal Reserve cut interest rates to near zero in March 2020, influencing short-term Treasury yields to fall.
- Economic Uncertainties: As data came in showing the extent of economic damage—from skyrocketing unemployment rates to plummeting retail sales—Treasury yields, including the 2-year, were conditioned by these negative macroeconomic indicators.
- Overall Risk Sentiment: The 2-year Treasury, like other safe-haven assets, is largely determined by the overall risk sentiment in the market. During times of high uncertainty or pessimism, investors tend to buy more of these assets, driving yields down.
- Government Stimulus Packages: The announcement and implementation of substantial fiscal stimulus packages intended to support businesses and individuals during the pandemic played a role in the stabilization phase of the 2-year Treasury market as well.
From the viewpoint of candlestick analysis, the rapid drop culminated in a long lower shadow line, followed by a year-long consolidation phase. Notice how the horizontal stretch effectively ended with a high wave. Even though it appears within a trading range, the price scope of this candlestick nearly spans the entire price range set by the sideways trend.
2. June 2021–August 2023: The Solid Uptrend
For two years, the 2-year Treasury yield has witnessed a significant rise. Several factors played a role in driving this consistent upward trend:
- Inflation Expectations: The significant amount of fiscal and monetary stimulus raised concerns among some investors about potential future inflation, influencing shorter-term yields.
- Elevated Inflation Readings: As time passed, inflation expectations notably materialized, reaching heights unseen since the 1980s.
- Vigorous Rate Increase by the Fed: The 2-year yield is particularly sensitive to short-term interest rate changes made by the Federal Reserve. The aggressive hiking cycle from major central banks to combat inflation, increasing rates from near 0% to over 5% in less than 15 months—from March 2022 until June 2023— has had a significant impact on this market.
- Economic Recovery Post-Pandemic: As the global economy began recovering from the profound shocks of the pandemic, several dynamics set the stage for rising Treasury yields, including the return of consumer confidence and risk appetite.
We'll add here that some fund managers, such as Jeffrey Gundlach, argue that the Federal Reserve is influenced by the 2-year Treasury market rather than vice versa.
Note how the 2-year Treasury yield has displayed a slowdown phase within the overall upward trend since October 2022.

3. Outlook for the second half of 2023 and 2024
Probably, the bond market's future trajectory, especially the 2-year Treasury market, will be influenced in the medium term by these emerging forces:
- Economic Contraction Risks: The robust rate hikes by the Federal Reserve, combined with the weakening of critical indicators like the inverted yield curve and PMI, hint at a potential economic downturn, possibly in 2024. In recessionary times, central banks often reduce interest rates, and market players tend to lean towards bond purchases, leading to a drop in yields.
- Market Behavior During Yield Curve Inversions: Historical data suggests that the demand for high-risk assets typically remains strong either in the initial stage or throughout the duration of a yield curve inversion. This means that the shift towards safer assets and the subsequent drop in yields usually come later.
- Artificial Intelligence and Productivity: The dawn of the artificial intelligence (AI) era, with its promise to boost efficiency and productivity, currently appears to be a major catalyst fueling this appetite for risk.


