
US Treasury Yields: Evolution and Outlook
We discuss the forces that have shaped the trajectory of Treasury yields since 2020 and provide our view on the prospective factors impacting this market.

In this post, we will discuss the complexities and forces that have influenced the trajectory of Treasury yields since 2020. In conclusion, we will provide our view on the prospective factors impacting this market.
1. January 2020–June 2021: The Initial Collapse in Yields
In early 2020, U.S. Treasuries and government bond markets from around the world witnessed significant upheaval, primarily due to the unforeseen impacts of the COVID-19 pandemic. During this period, multiple factors played a pivotal role in this market:
- Pandemic Fallout: The swift propagation of the virus prompted widespread global lockdowns and substantial economic downturns. Amid escalating uncertainty, investors sought refuge in U.S. Treasury securities, causing their prices to surge and consequently pushing yields downward.
- Aggressive Central Bank Monetary Policies: In reaction to the pandemic, the Federal Reserve drastically reduced interest rates to nearly zero in March 2020, leading to significant declines in short-term Treasury yields.
- Economic Uncertainty: As data revealed extensive economic turmoil, including soaring unemployment rates and sharp declines in various key economic indicators, those adverse macroeconomic conditions exerted a downward pressure on Treasury yields.
- Investor Caution: Similar to other safe-haven assets, the Treasury market is swayed by the prevailing risk sentiment. In periods characterized by heightened uncertainty or pessimism, investors frequently flock to these assets, resulting in a decline in yields.
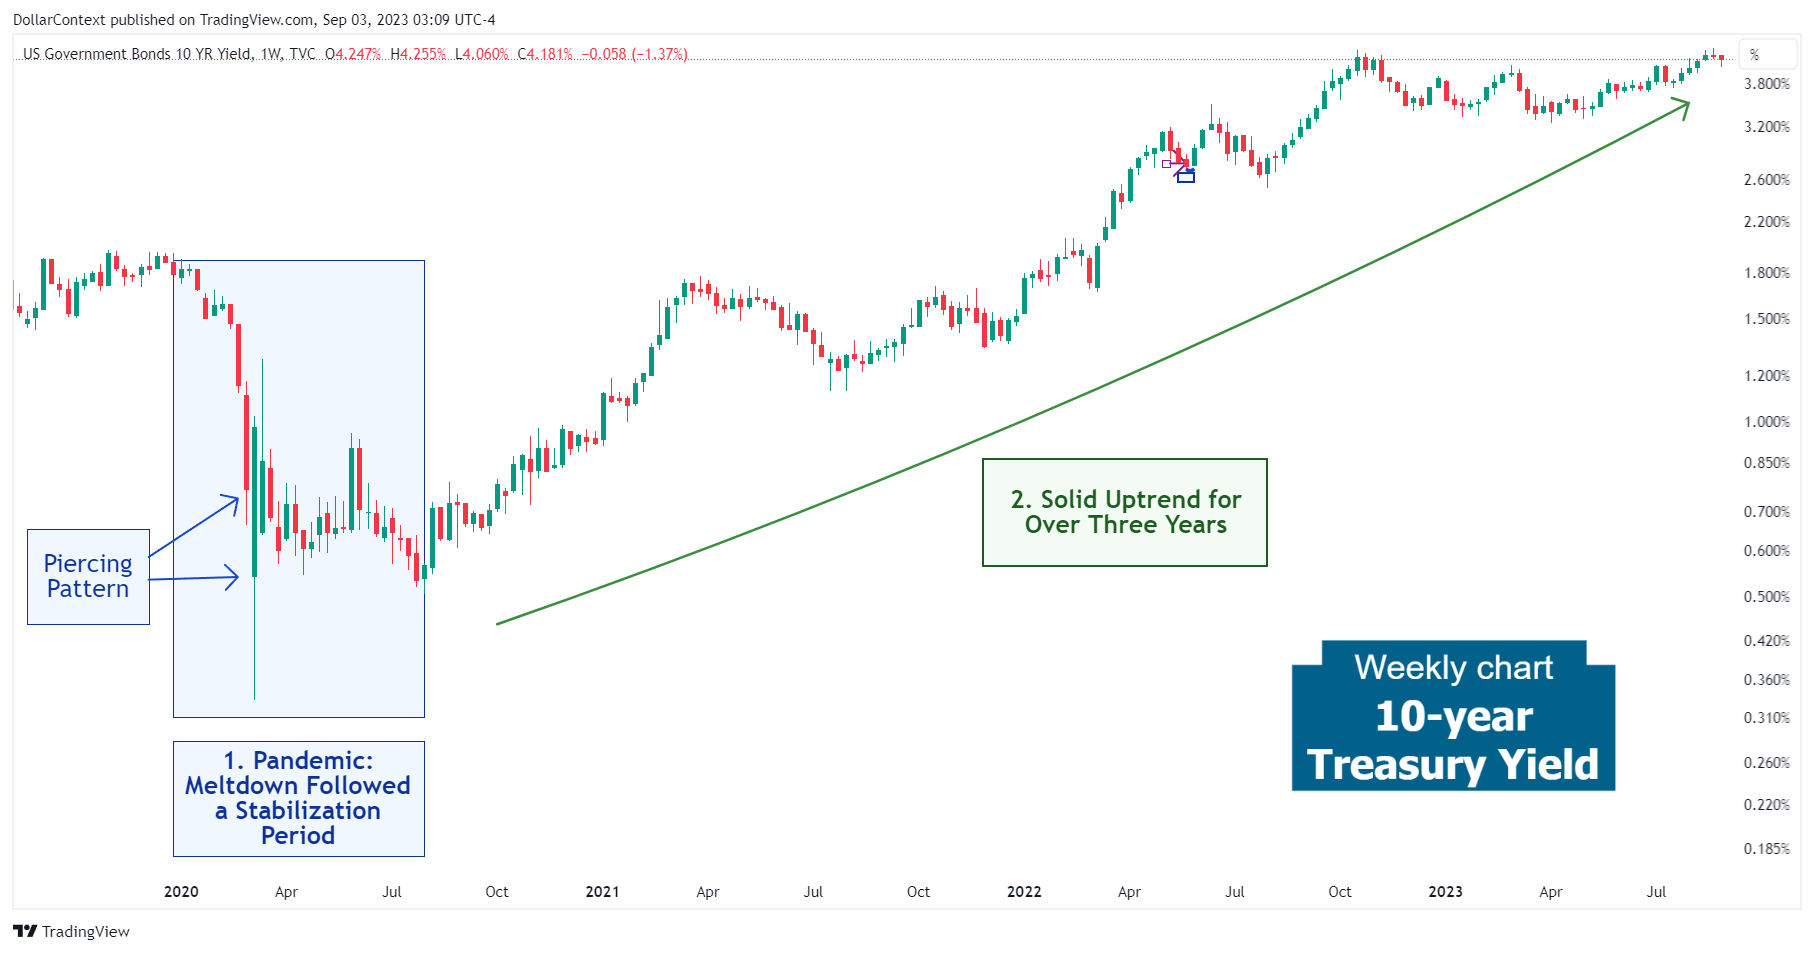
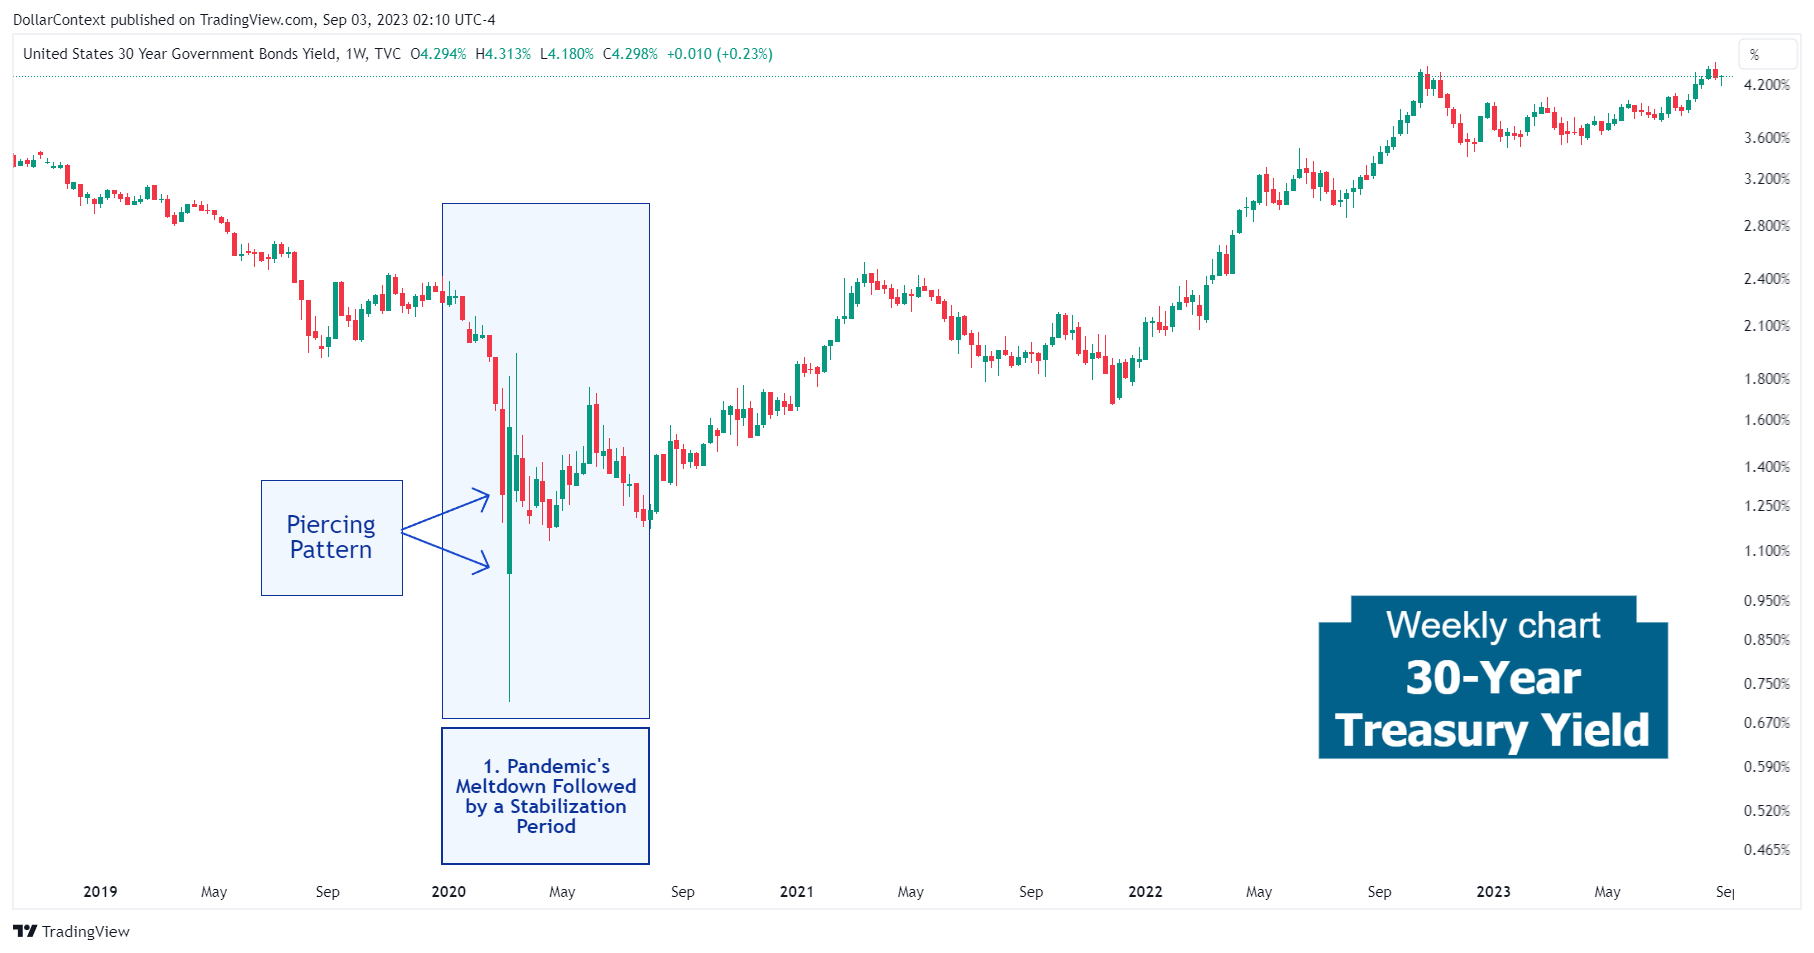
While the 2-year Treasury (and, to a lesser extent, the 5-year Treasury) lingered at low levels for nearly 18 months, the longer-term Treasuries, such as the 10-year and 30-year yields, underwent a swift recovery after the initial decline.
By the end of 2020 and throughout 2021, the announcement and implementation of substantial fiscal stimulus packages played a role in driving up yields for these long-term bonds.
2. July 2021–August 2023: The Strong Uptrend and The Inversion of the Yield Curve
Over a span of approximately two years, the government bond market has consistently experienced a sell-off, resulting in rising yields. Several elements have fueled this persistent trend:
- Anticipated Inflation Surge and Subsequent Validation: The substantial injections of fiscal and monetary stimulus gave rise to apprehensions among certain investors regarding potential future inflation, consequently influencing Treasury yields. Over time, those inflation expectations became more apparent, reaching levels not seen since the 1980s.
- Aggressive Interest Rate Hikes by the Federal Reserve: Starting from March 2022 and continuing through June 2023, the Federal Reserve initiated a robust tightening cycle to counter inflation. With rates rising from nearly 0% to surpassing 5%, the Treasury market encountered substantial pressure.
- Post-Pandemic Economic Recovery: As the global economy began to recover from the profound effects of the pandemic, various indicators began to display signs of improvement, such as retail sales and consumer confidence.
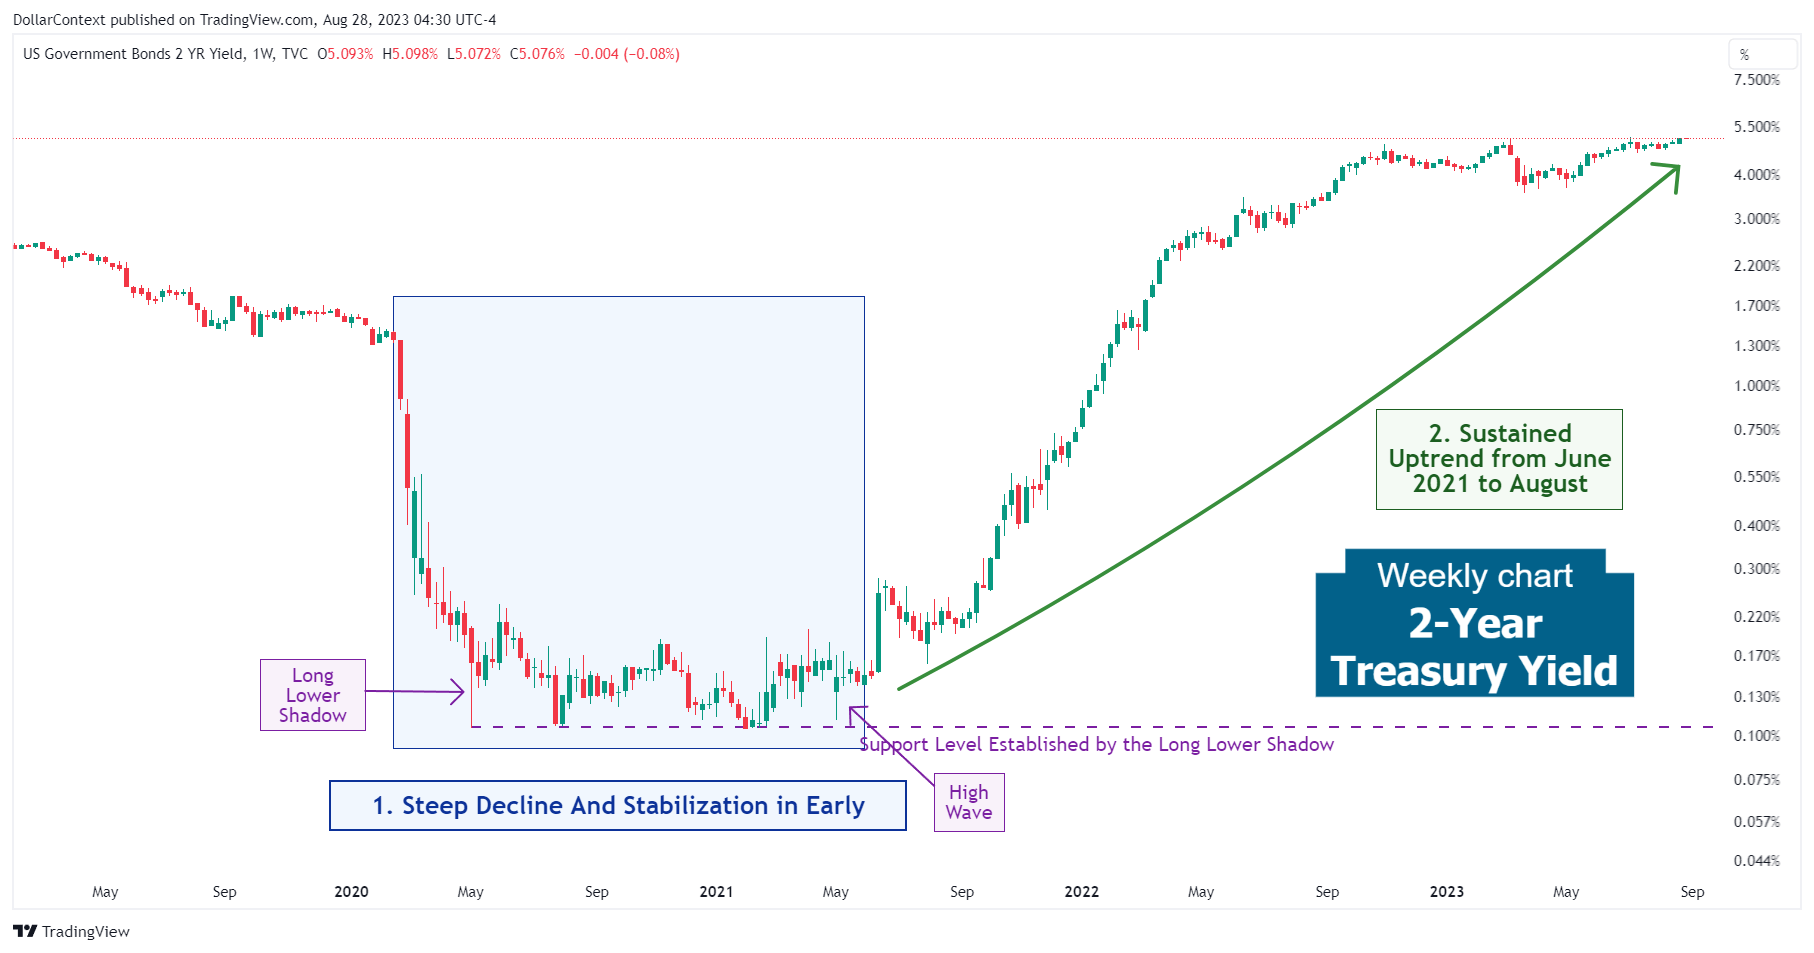
For example, reflecting the aggressive hiking cycle implemented by the Federal Reserve, the 2-year Treasury yield chart displayed the strong uptrend during this period:
As a result, in July 2022, the 10-2 year Treasury yield spread exhibited a yield curve inversion that currently remains in effect.
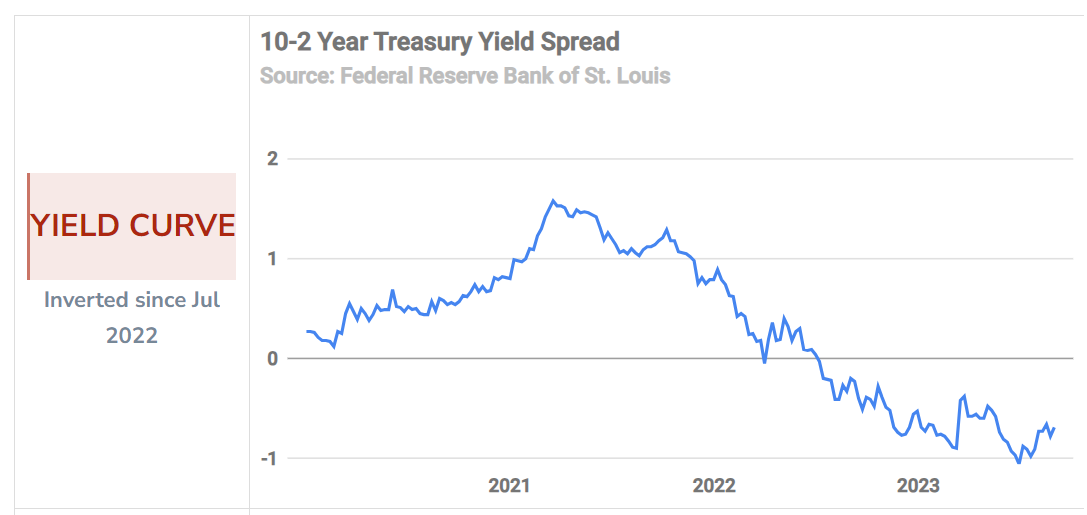
Source: Federal Reserve Bank of St. Louis
3. Projections for Late 2023 and 2024
We believe several factors could exert substantial influence on the trajectory of Treasury bond yields in the medium term:
- Economic Contraction Risks: The Federal Reserve's proactive approach to raising rates, coupled with worrisome signals such as the inverted yield curve, hint at the possibility of an economic downturn in 2024. During periods of recession, central banks usually reduce interest rates. Additionally, investors tend to reallocate their assets from riskier options to government bonds, resulting in yield declines.
- Market Reactions to an Inverted Yield Curve: Historical data indicates that the demand for high-risk assets typically remains robust either at the onset of, or during, a yield curve inversion. Consequently, the transition towards safer assets and the ensuing reduction in bond yields usually materialize at a later juncture.
- AI's Impact on Productivity Enhancement: The emergence of the artificial intelligence (AI) era, with its potential to greatly enhance efficiency and productivity, might be leading to an increased tendency for risk over a prolonged period.


