Where Are Copper Prices Heading?
Scenario 1. Since 2020, the commodity market might have been going through a supercycle. Scenario 2. Copper could be undergoing a brief correction phase before retesting the lows of 2022. The catalyst for this scenario might be a recession expected to materialize in 2024.


In this article, we delve into the technical and fundamental factors that have contributed to copper volatility over a span of over three years. Lastly, we'll look at the possible progression of copper prices according to different scenarios.
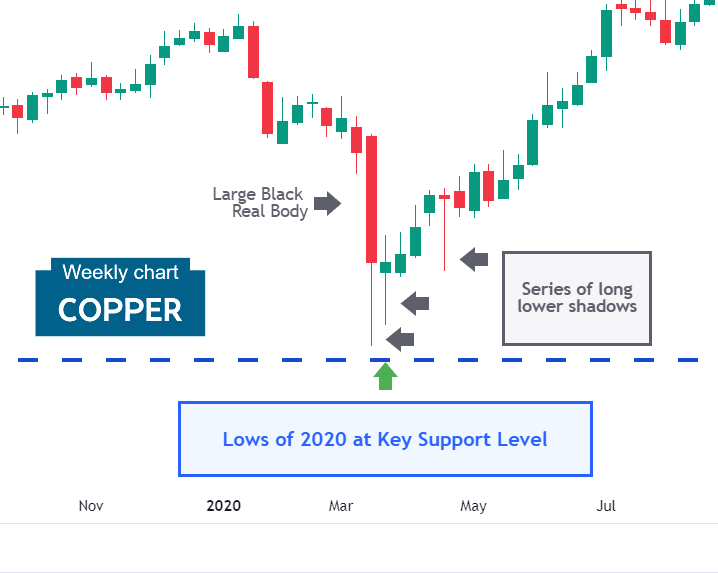
1. March 2020: The Lows of the Pandemic
Pandemic containment measures caused a major economic contraction globally, leading to a significant decline in copper prices, which fell to nearly $2 per pound.
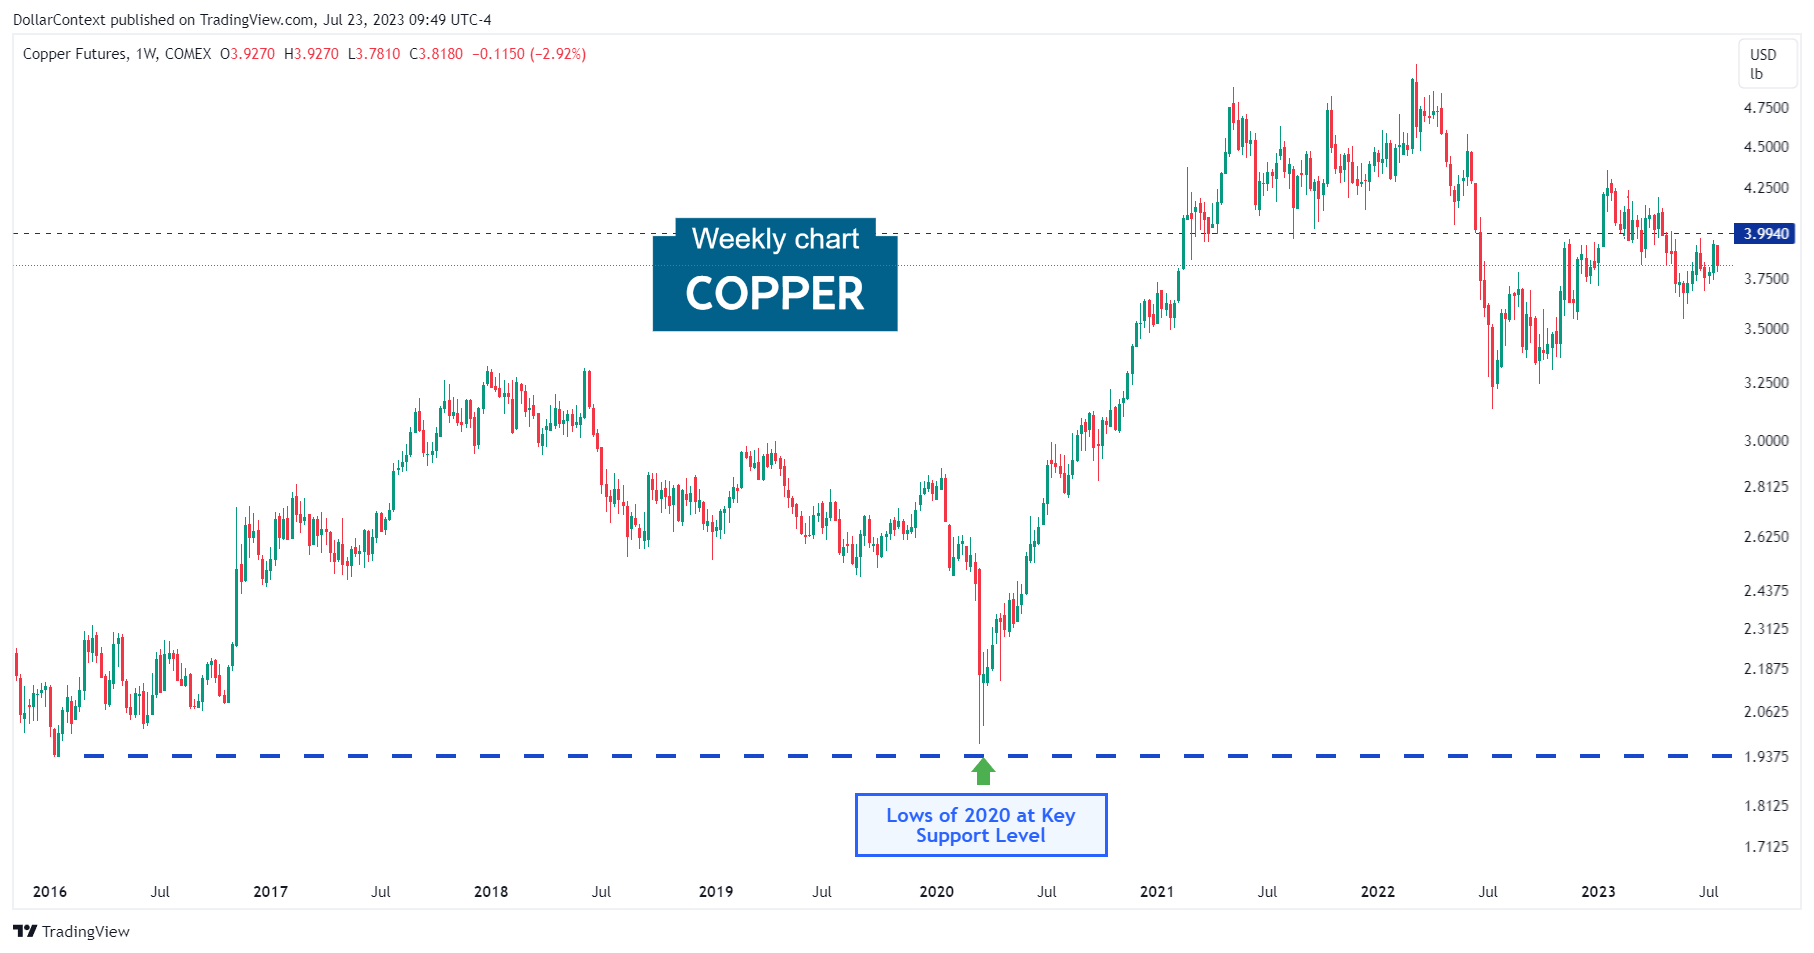
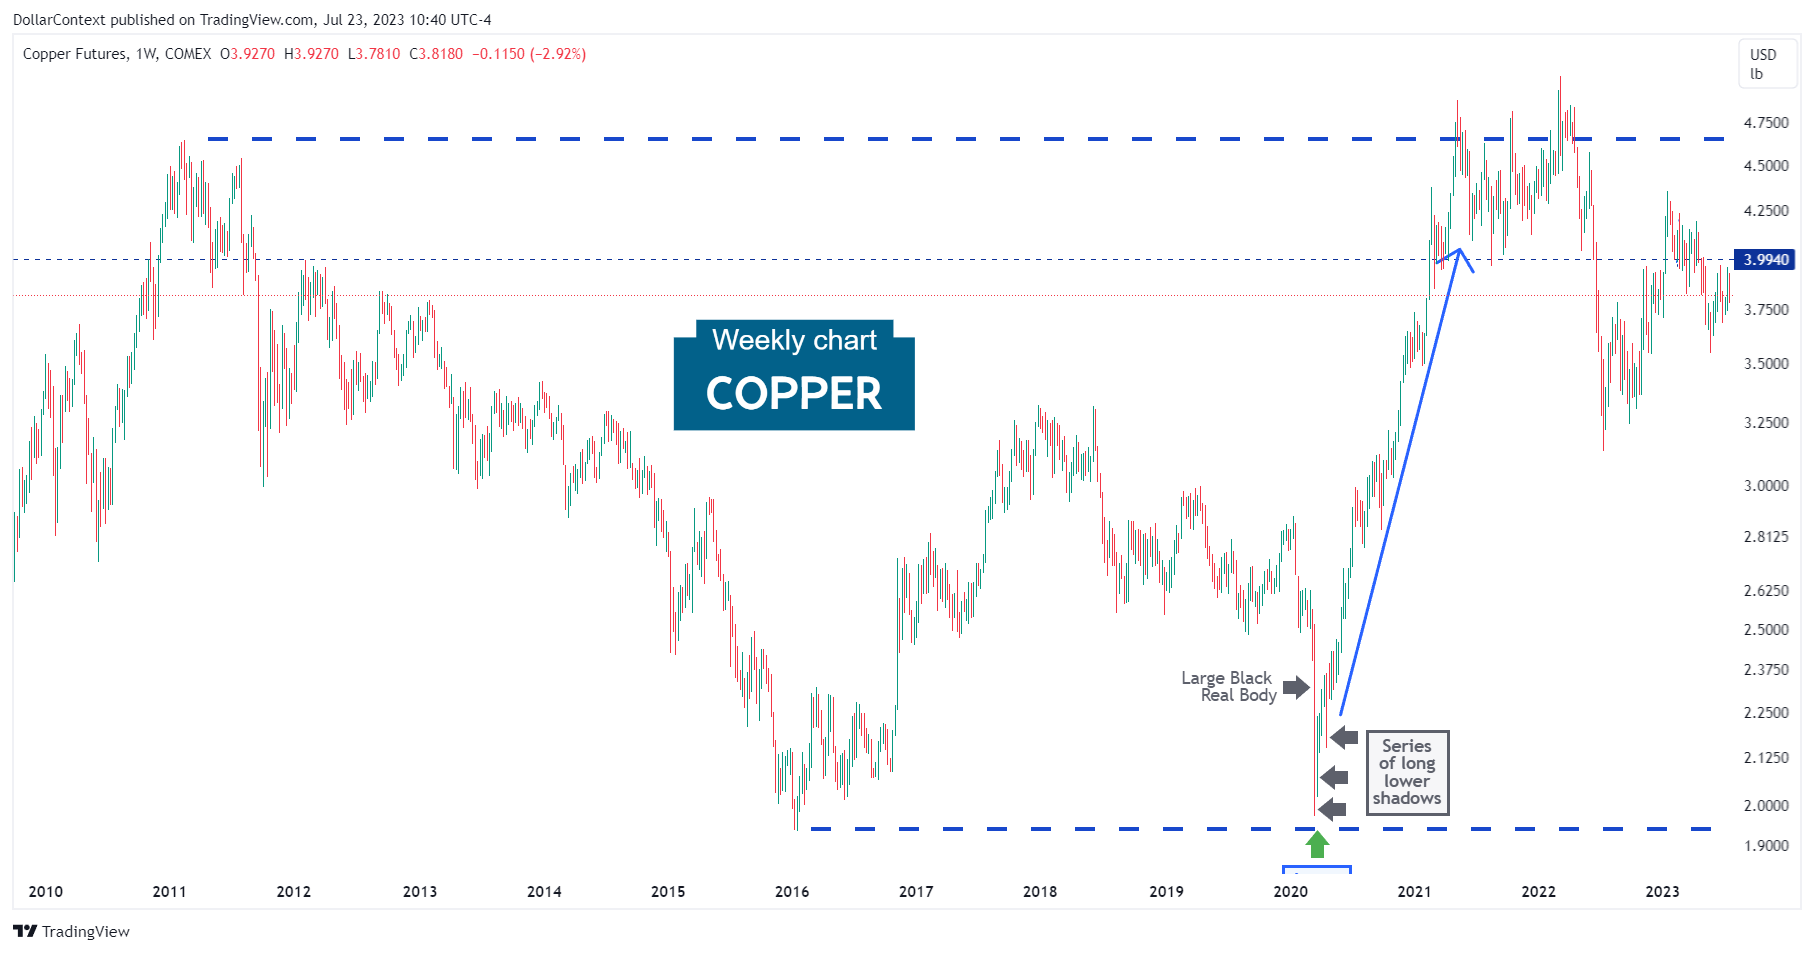
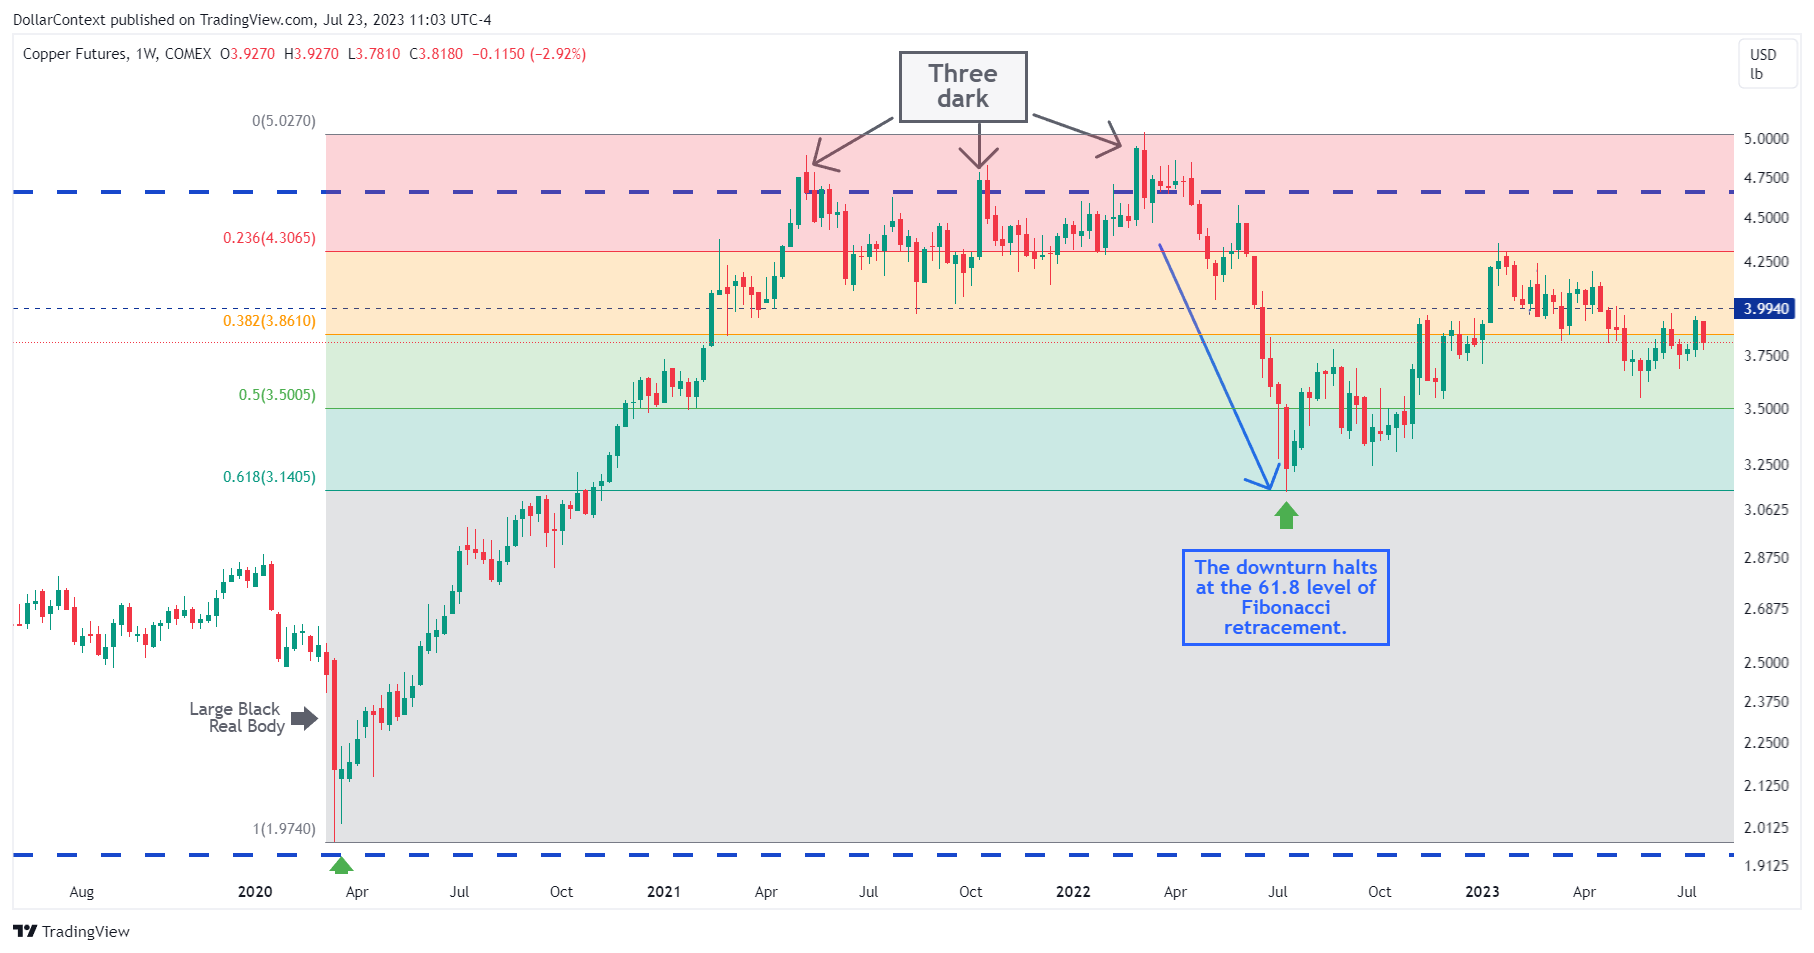
It’s worth noting that the formation of the bottom was characterized by a long black/red body and a sequence of elongated lower shadows at a key support area:
2. April 2020–May 2021: The Extraordinary Upturn
From April 2020 onwards, the following factors contributed positively to the surge in copper prices:
- Assertive and robust monetary reactions from the Federal Reserve and other major central banks to stimulate the economy, and
- Exceedingly optimistic expectations concerning copper's demand and its crucial role in the clean energy revolution, driven by electricity and decarbonization.
In this context, the red metal initiated a remarkable surge that paused just above its all-time highs, around the significant resistance level of $5.
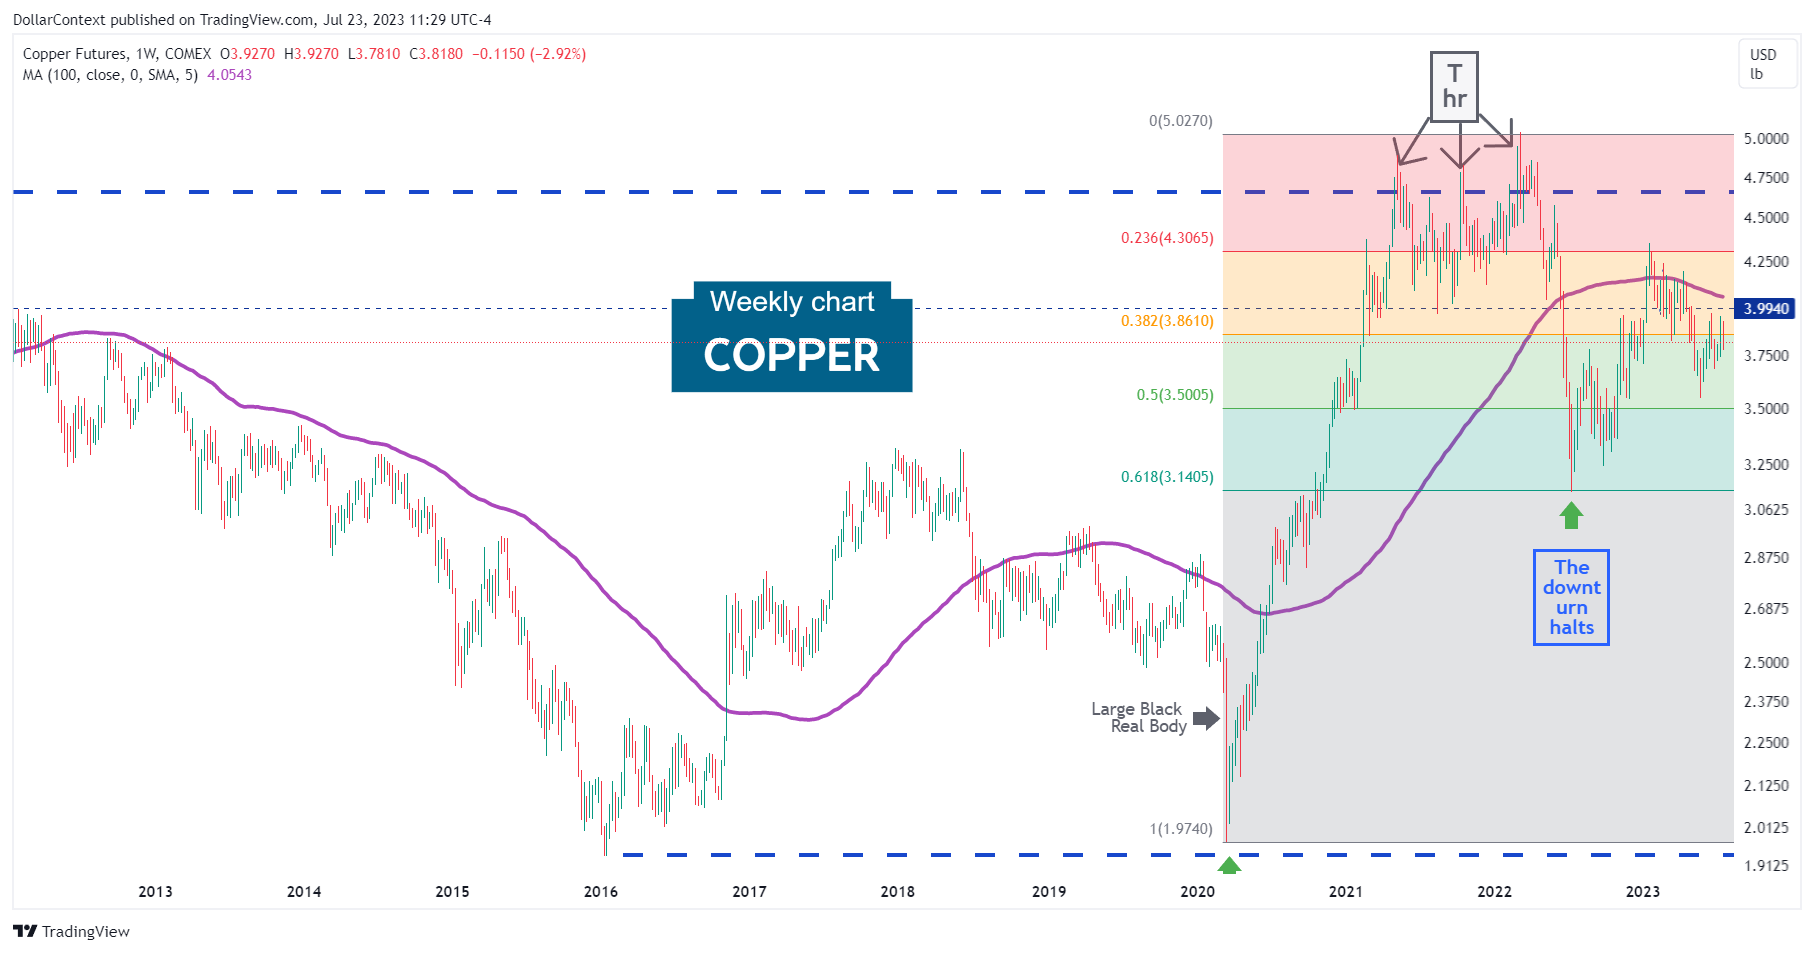
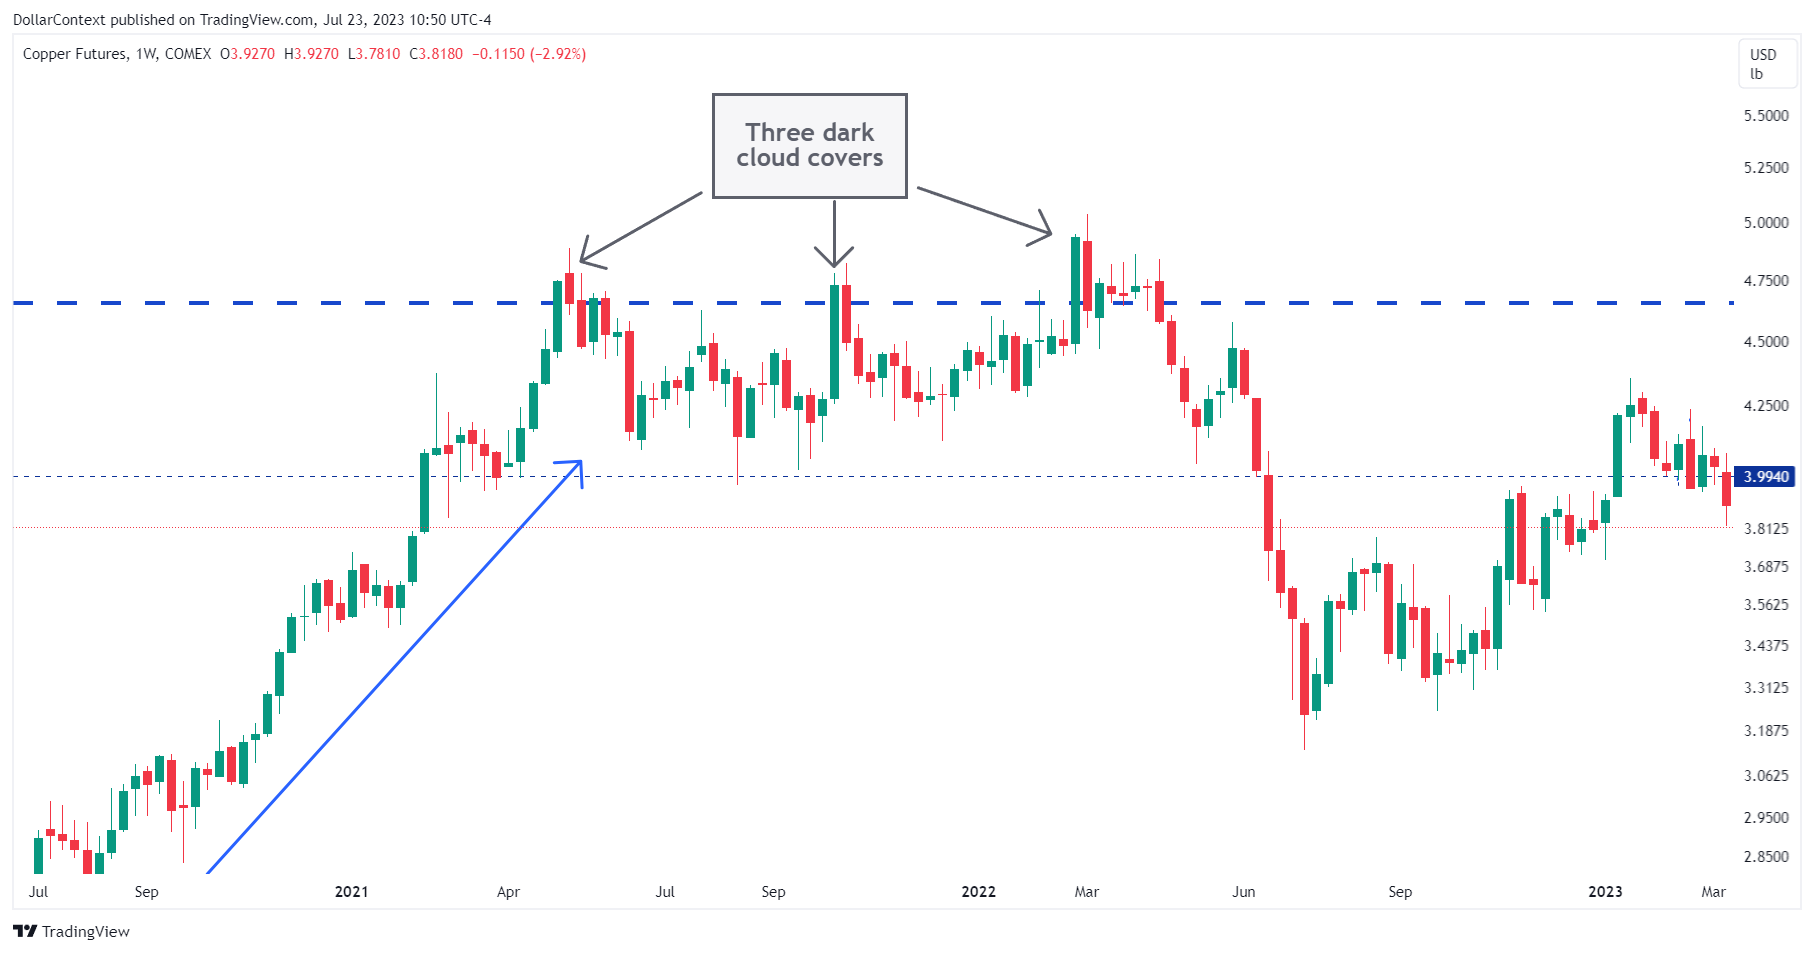
3. June 2021–February 2022: The Top
The copper market underwent a phase of lateral fluctuation. Indications of a possible peak included:
- The formation of a triple top around $4.9 (Conventional Technical Analysis).
- The appearance of three “irregular” dark cloud cover patterns (Japanese Candlestick Analysis).
The significant resistance zone in which these patterns appeared amplifies their significance as reversal signals.
4. March–June 2022. Reversal Confirmation
The reversal is confirmed with the breakout of the triple top formation. Interestingly, the descent halts at these benchmarks:
- 61.8% Fibonacci retracement, and
- 100% projection of the triple top range
5. From July 2022 Forward
Beginning July 2022, the market has seen a recovery in copper prices, a pattern that continues today. Unfortunately, making predictions at this point is challenging. However, in our view, there are a few probable outcomes that may occur moving forward:
- Scenario 1. Since 2020, the commodity market might have been going through a supercycle. Typically, commodity supercycles last for more than 8 years and result in huge price increases. If this hypothesis holds, copper would have undergone a correction phase from March to June 2022, before resuming the upward trajectory over a longer time span.
- Scenario 2. Copper could be undergoing a brief correction phase before retesting the lows of 2022. The catalyst for this scenario might be a recession expected to materialize in 2024. As indicated in the following chart, it's evident that the red metal's performance tends to deteriorate during times of recession (shaded areas).
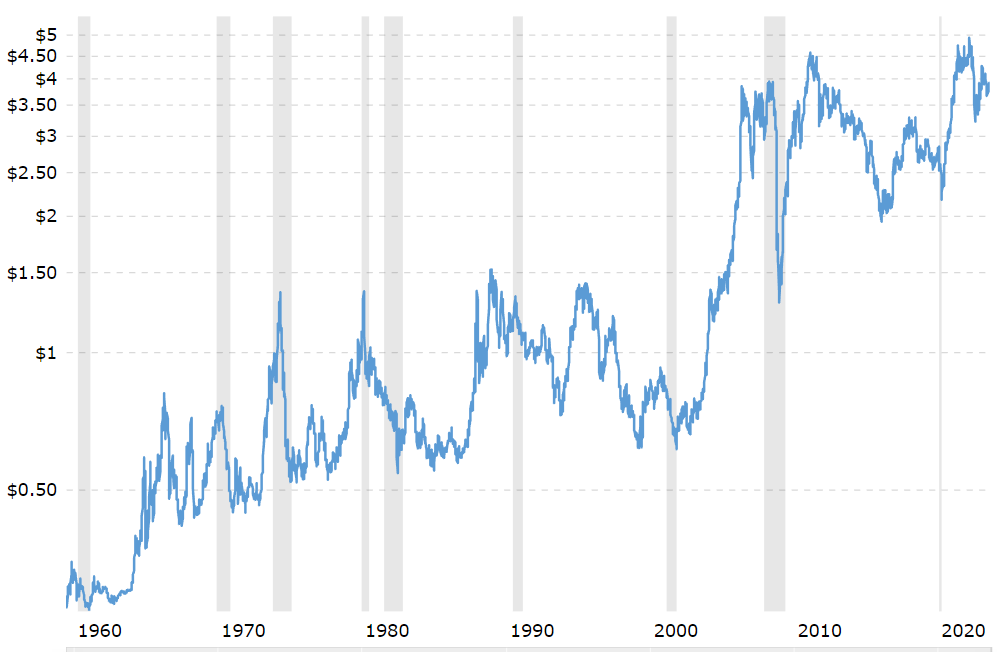
Source: Macrotrends
Finally, observe how the 100 Simple Moving Average (depicted in purple on the chart below) has historically functioned as a support/resistance indicator for copper. Currently, this SMA is acting as a resistance.