
The Evolution and Outlook of Corn Prices
We'll delve into the trends that have shaped the path of corn prices since 2020. Then, we'll provide our perspectives on the potential future course of this market.


In this article, we'll delve into the trends and factors that have shaped the path of corn prices since 2020. As we conclude, we'll provide our perspectives on the potential future course of this market.
1. January 2020–July 2020: The Initial Effect of the Pandemic
The initial effect of the COVID-19 pandemic on corn prices was largely negative, driven by a number of factors that disrupted demand and distribution networks globally:
- Reduced Demand for Ethanol: In many countries, corn is a major component in the production of ethanol, which is used as a biofuel additive for gasoline. As lockdowns and travel restrictions were put in place worldwide, the demand for gasoline plummeted. This led to a reduced demand for ethanol and corn, which in turn resulted in a decrease in prices.
- Global Economic Uncertainty: The widespread economic uncertainty and market volatility induced by the pandemic also had an indirect effect on corn prices. Investors and traders may have moved away from commodities like corn in favor of safer assets.
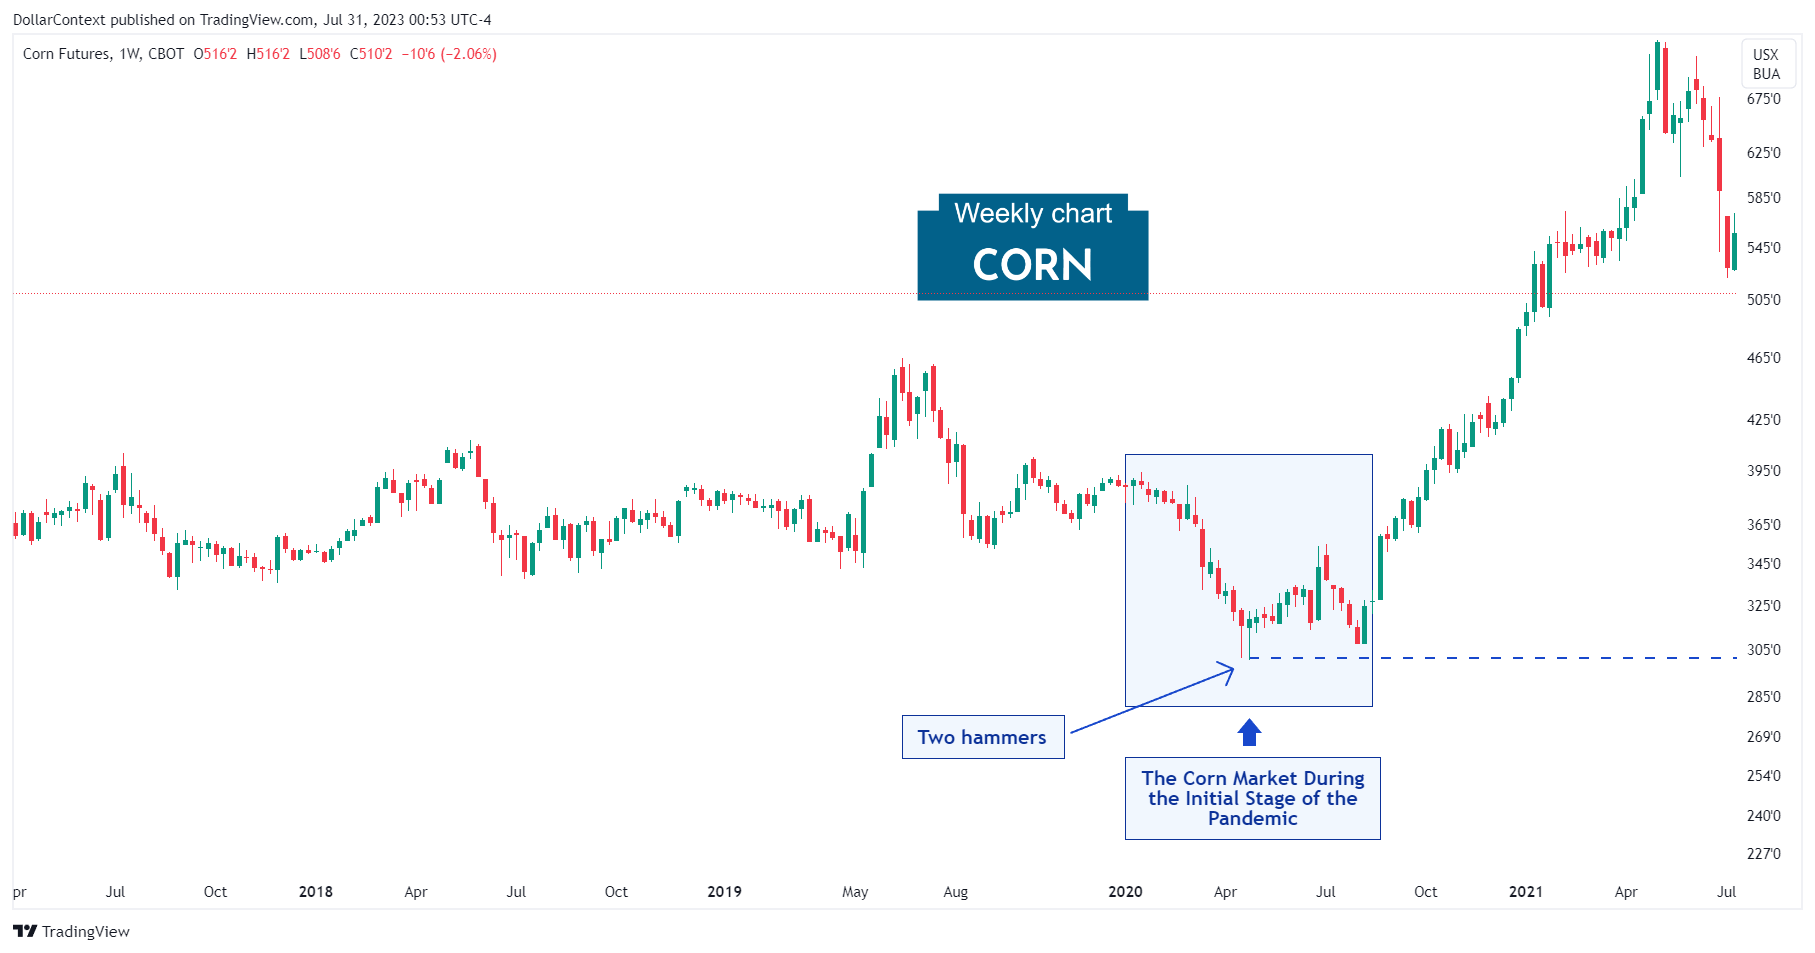
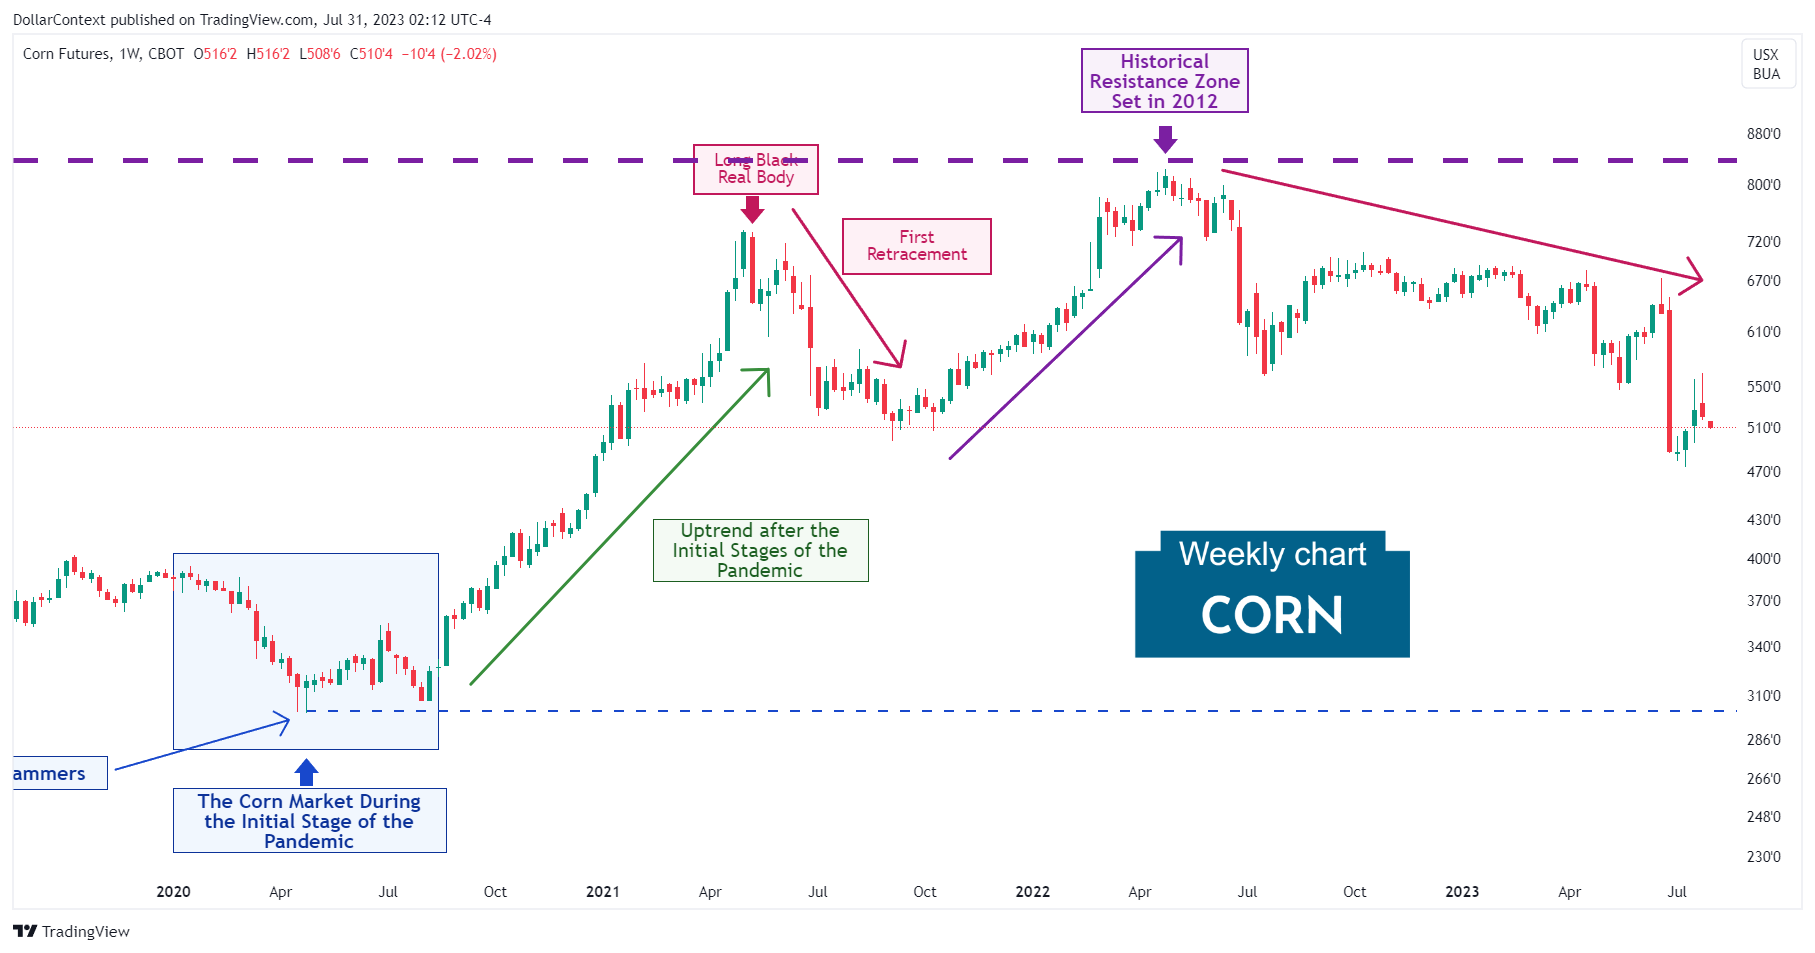
However, the decline in price, as denoted by the blue segment on the graph below, wasn't as severe as that observed in other non-agricultural commodities.
Technically, the decline stalled via two consecutive hammers (candlestick analysis), which were modest in size. Note that the support area created by these hammers was successfully tested in July 2020.
2. August 2020–April 2021: The Sustained Upturn
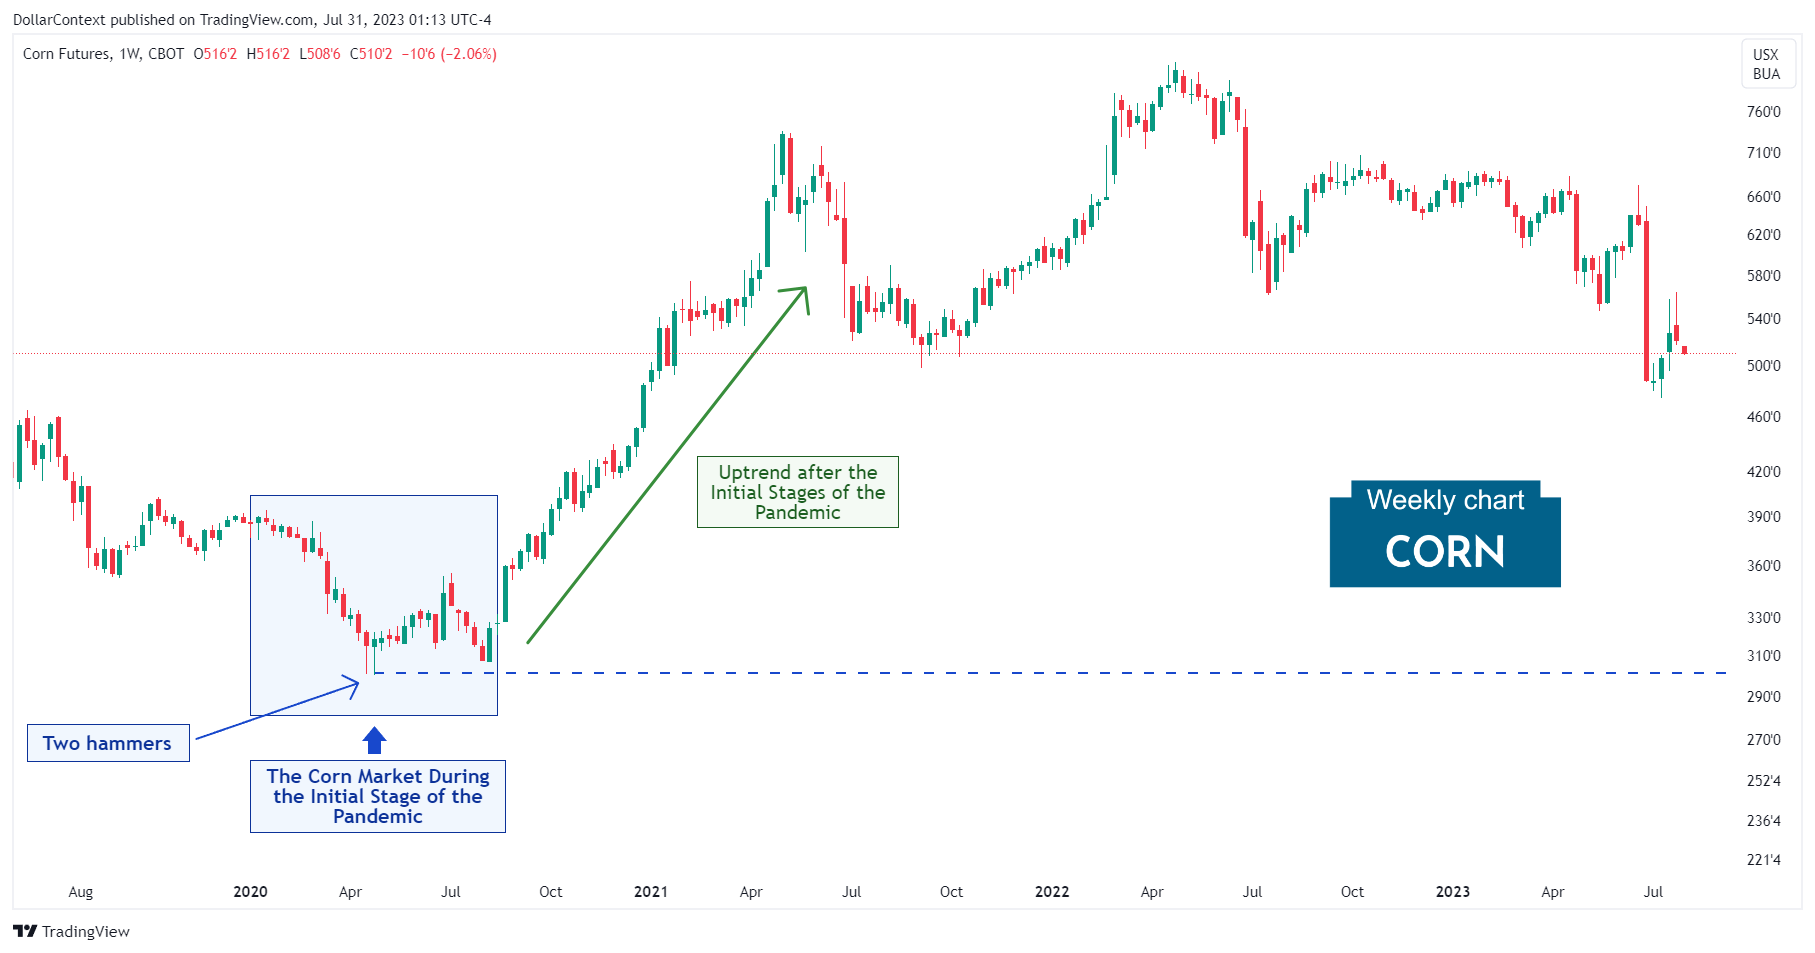
The corn market experienced an impressive upturn from August 2020 through April 2021. In the aftermath of the initial stages of the COVID-19 pandemic, several factors contributed to this uptrend:
- Supply Chain Disruptions: Pandemic-related disruptions in the supply chain, labor shortages, and other logistical issues decreased the overall supply of corn.
- Economic Recovery: As countries began to adjust to the pandemic and slowly reopen their economies, the demand for corn started to rebound, pushing prices higher.
- Biofuel Demand: As travel restrictions eased, the demand for gasoline and, in turn, ethanol began to recover. Since a significant portion of corn is used for ethanol production, this drove up corn prices.
- China's Import Demand: China, one of the largest importers of corn, increased its demand substantially during this period, significantly affecting global corn prices.
- USD Depreciation: During this period, the US dollar depreciated. Given that commodities such as corn are dollar-denominated, a decrease in the dollar's strength usually results in an escalation of their prices.
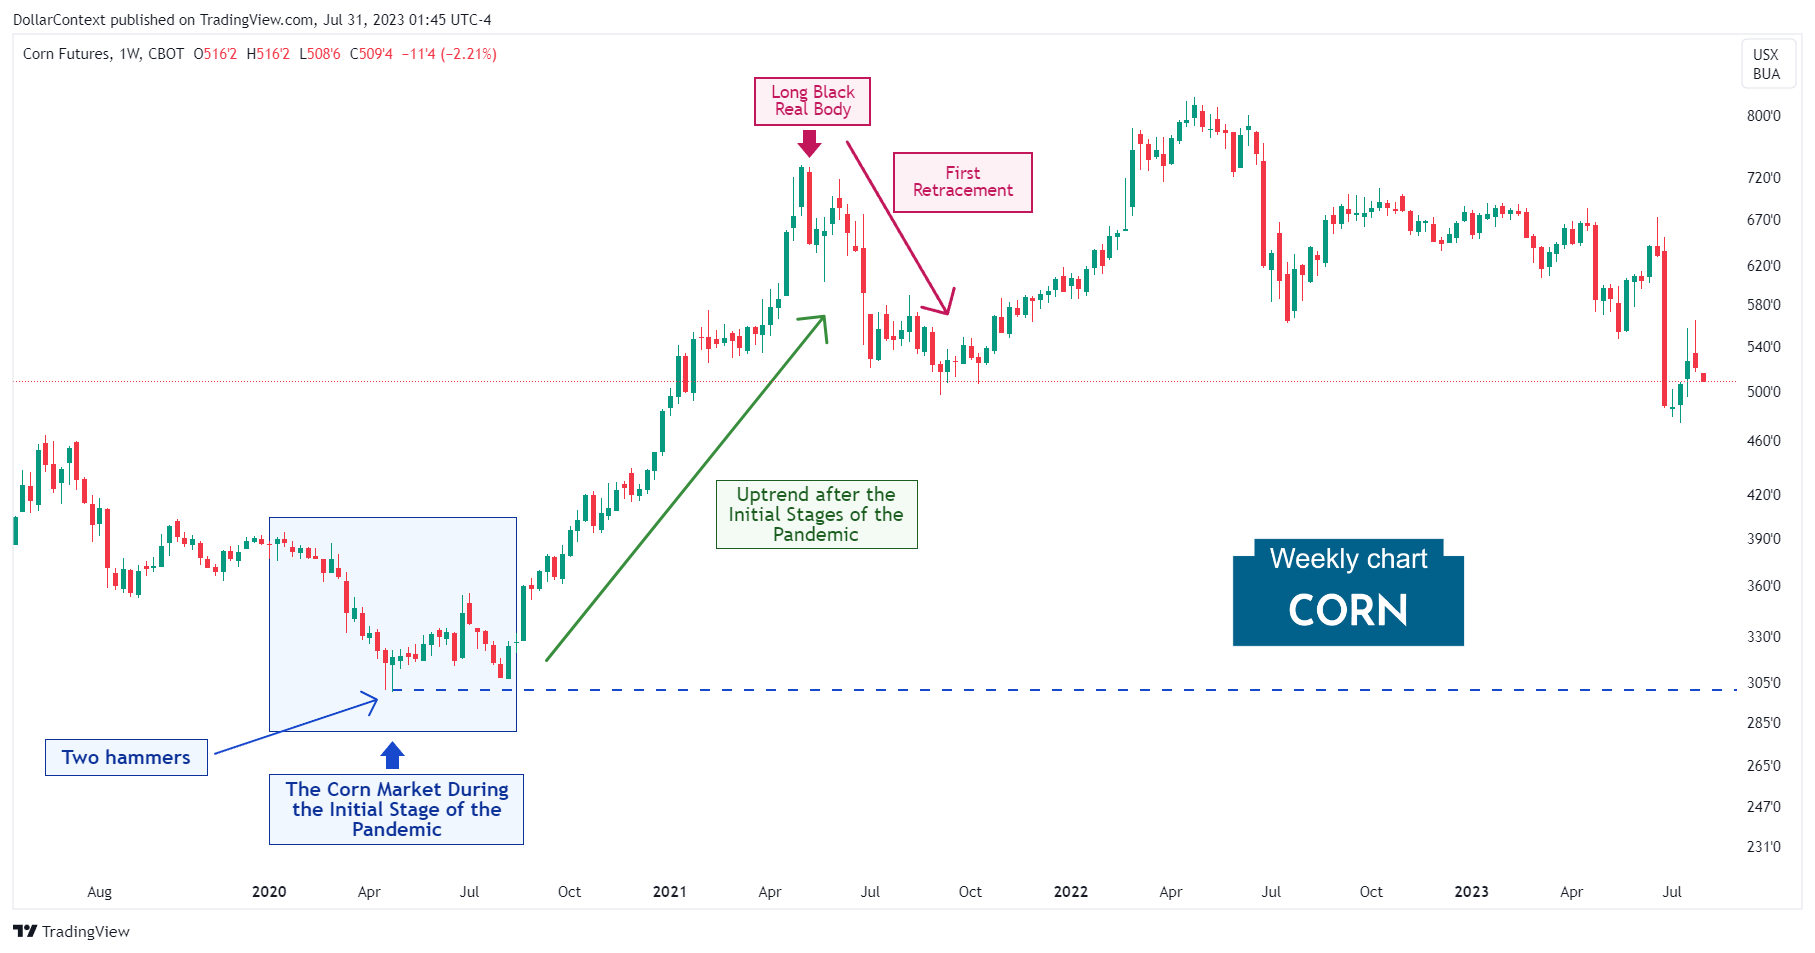
3. May 2021–August 2021: The Retracement
Triggered by a long black real body (candlestick analysis) in May 2021, a retracement commenced in the corn market. This downward trend persisted for approximately four months.
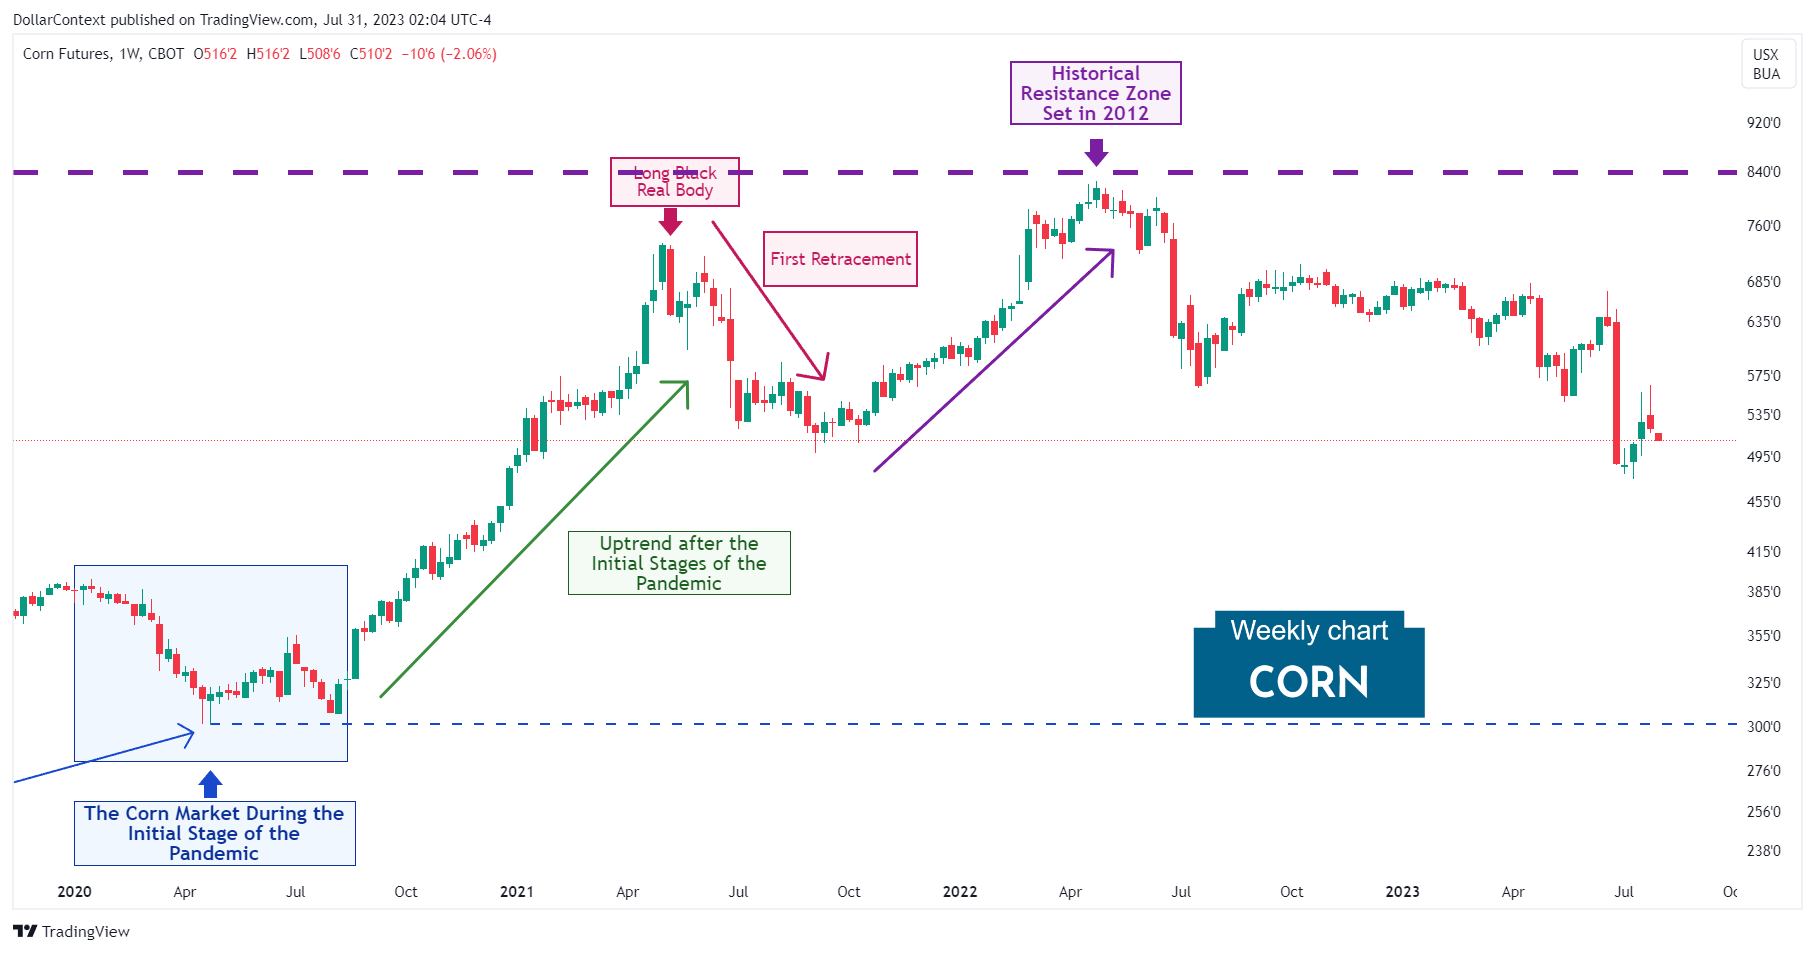
4. September 2021–April 2022: The Second High
In this timeframe, the price displays an additional surge that stalls marginally above the previous peak. This occurs within a historically significant resistance zone established back in 2012 (not shown on the chart.)
5. From May 2022 Onward
Corn prices, much like numerous other commodity prices, have been experiencing a prolonged period of correction since June 2022, which continues up until the present. The strengthening of the dollar has played a notable role in propelling this trend.
6. Projected Outlook for Late 2023 to 2024
Beginning in 2020, the commodity market, which includes corn and other agricultural assets, might have entered a supercycle period. This type of supercycle often lasts for more than 8 years and has a wide-ranging impact, affecting a broad array of commodity assets, not just a select few. Should this theory hold true, it would mean that the corn market has been experiencing an episode of correction since May 2022.
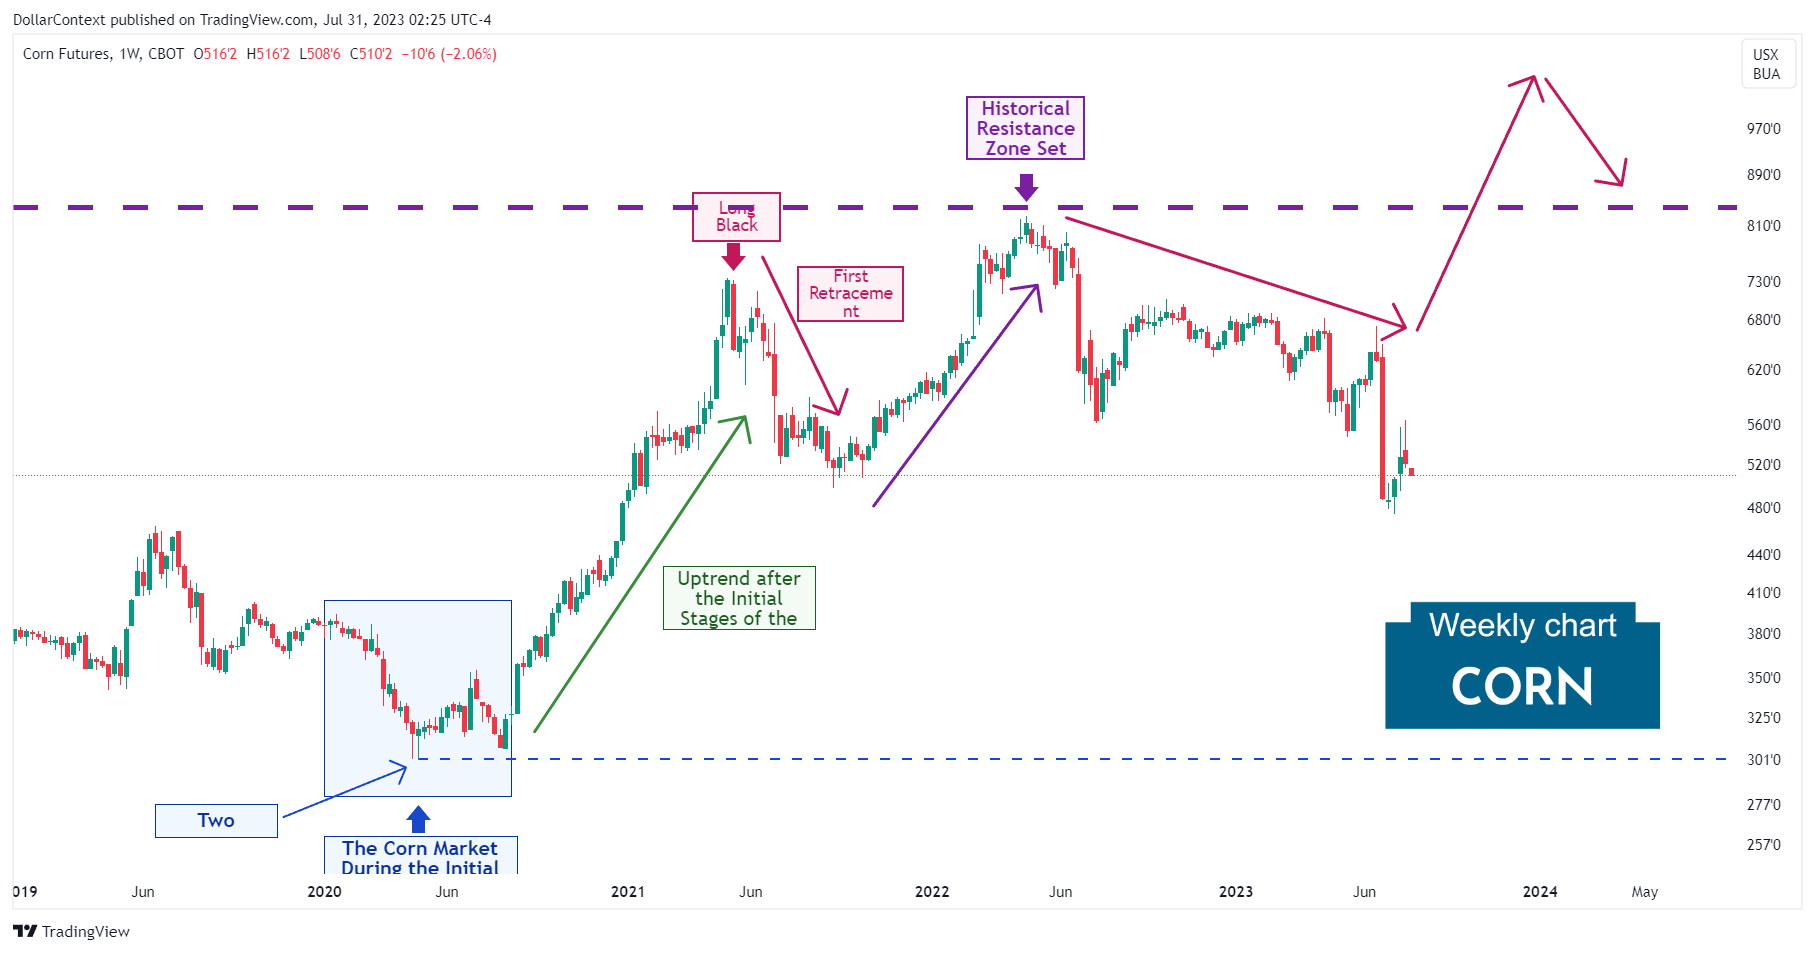
Nevertheless, we are considering a potential economic slowdown around 2024, which might initiate a significant correction in the broader commodity sector, inclusive of the corn market. This graph shows the negative impacts of economic recessions, represented by the areas shaded in gray, on corn prices.
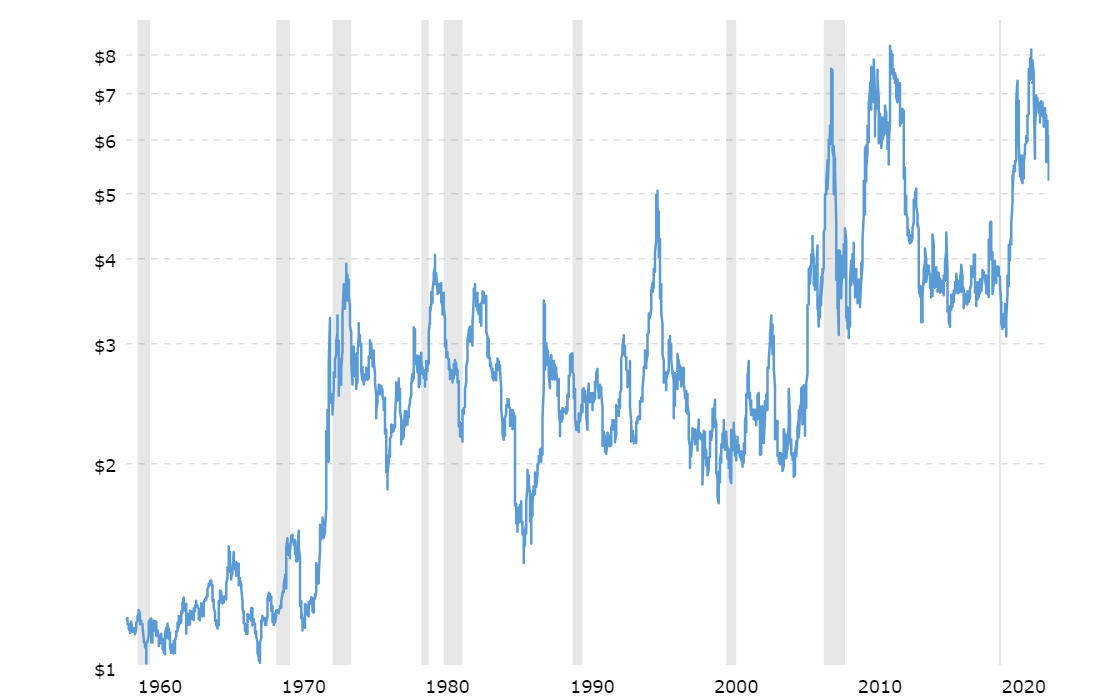
Source: Macrotrends


