
Gasoline Prices: Evolution and Outlook
In this article, we'll explore the fundamental and technical dynamics shaping the trajectory of gasoline prices since 2020. In conclusion, we'll discuss potential trends in this market.

In this article, we'll explore the fundamental and technical dynamics shaping the trajectory of gasoline prices since 2020. In conclusion, we'll discuss potential trends in this market.
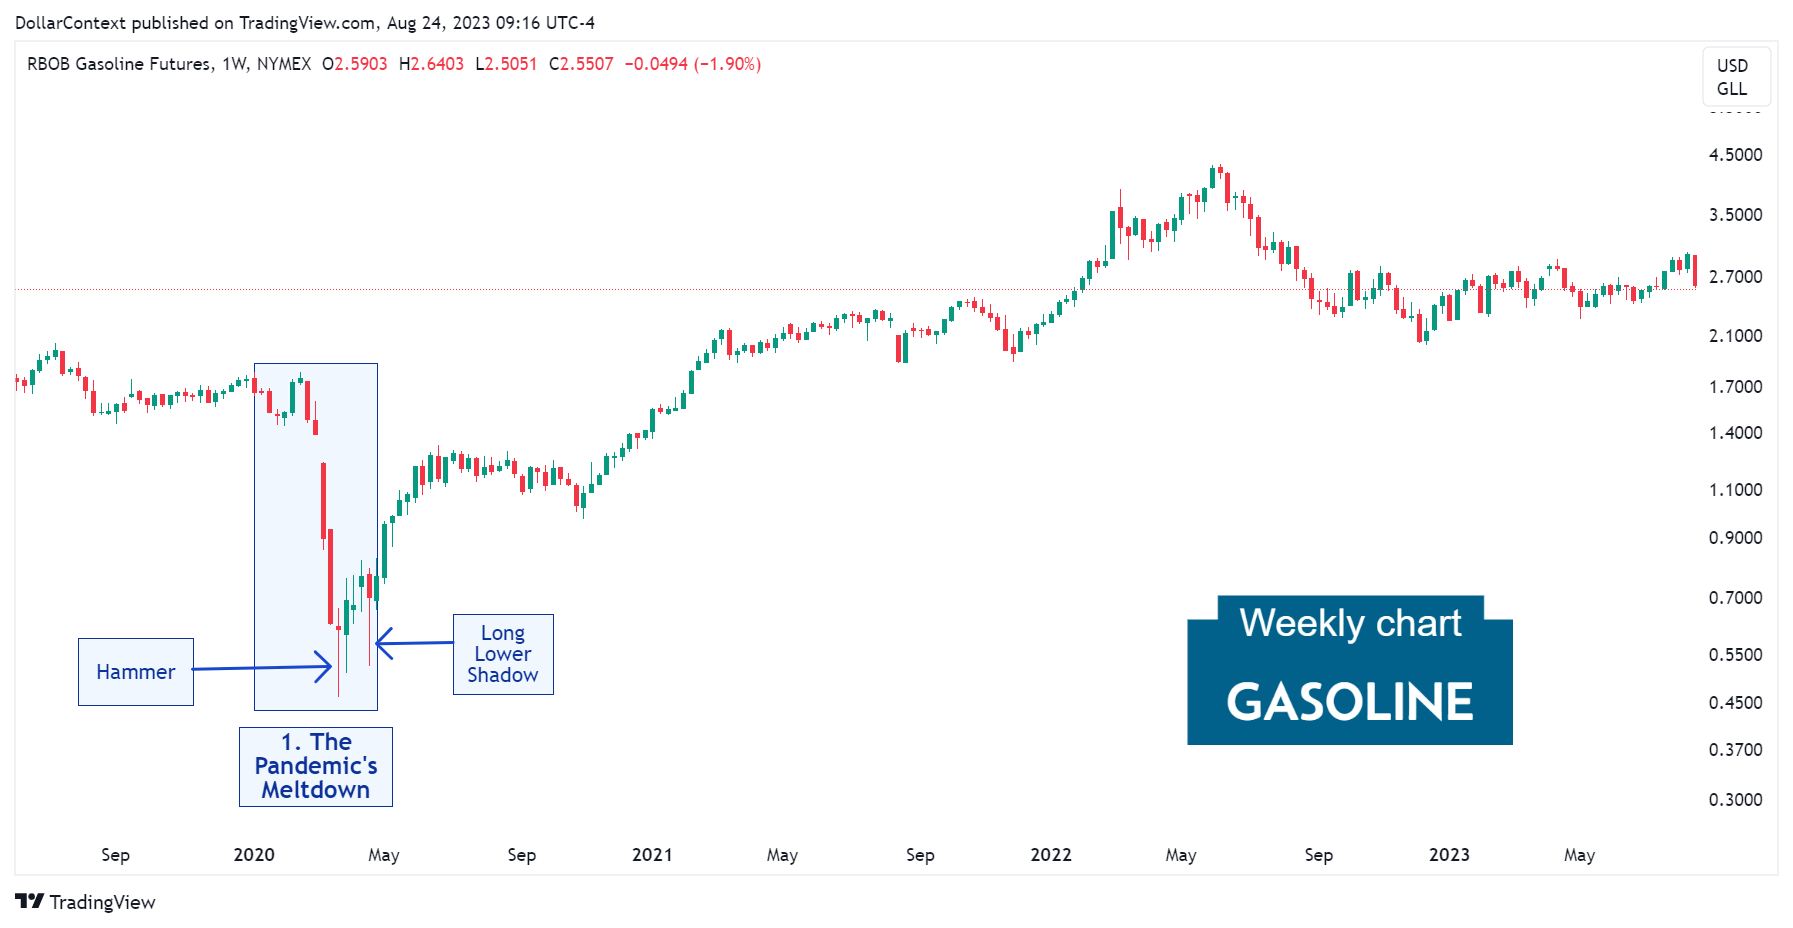
1. January 2020–April 2020: The Meltdown
From January to April 2020, gasoline prices experienced considerable fluctuations, culminating in a dramatic drop in March and April when the market plummeted. A unique combination of factors led to a pronounced decrease in demand alongside an excess in supply, including:
- COVID-19 Pandemic: In early 2020, the swift global proliferation of the COVID-19 virus prompted unparalleled lockdown actions. Major economies set travel limitations, quarantined vast numbers of people, and closed substantial segments of their economic activities. Consequently, there was a significant decline in oil (WTI and Brent) and gasoline demand, especially in areas such as aviation, transportation, and industry.
- OPEC Price War: The cost of crude oil is the largest component of the retail price of gasoline. Following a conflict between two oil giants, Saudi Arabia and Russia, crude oil prices experienced significant volatility in early 2020. By March, OPEC and its allies couldn't reach a consensus on oil production reductions. This discord prompted Saudi Arabia to declare significant reductions in oil prices and intentions to boost production. The looming threat of a saturated market, coupled with diminishing demand, intensified the price drop.
- Storage Limitations: Amid the significant decline in demand brought on by the COVID-19 pandemic in 2020, storage capacity issues arose at times, influencing prices.
- Economic Uncertainties: The extended economic forecast appeared bleak because of the potential enduring effects of the pandemic. This reduced economic activity further curtailed the chances of a rebound in gasoline demand.
From a candlestick analysis perspective, the sharp decline culminated in a hammer pattern, and a few sessions later, a prominent long lower shadow candle appeared.
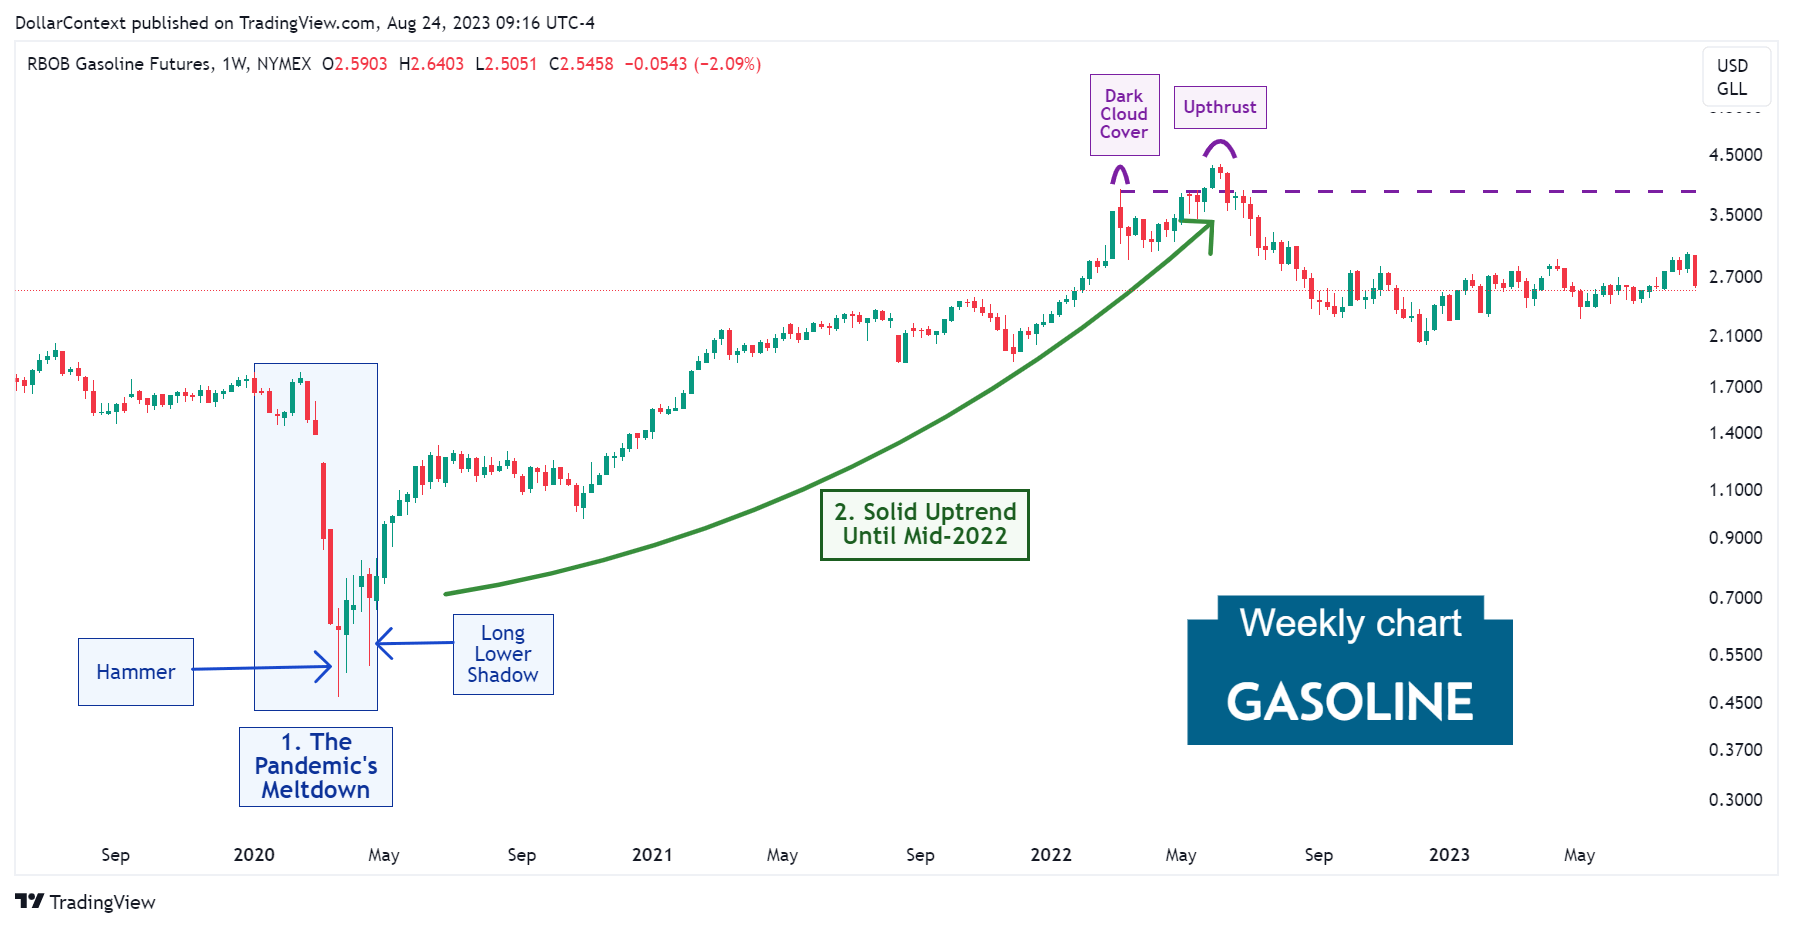
2. May 2020–May 2022: Solid Uptrend
Following the early stages of the pandemic, the gasoline market experienced a strong upward trajectory over a span of two years. Factors like the gradual economic revival, stimulus initiatives by the Federal Reserve and other leading central banks, and the weakening of the dollar played pivotal roles in fueling this surge.
Technically, you can observe how the upward trend concluded with a dark cloud cover pattern, and a few weeks later, a false breakout (upthrust) emerged.
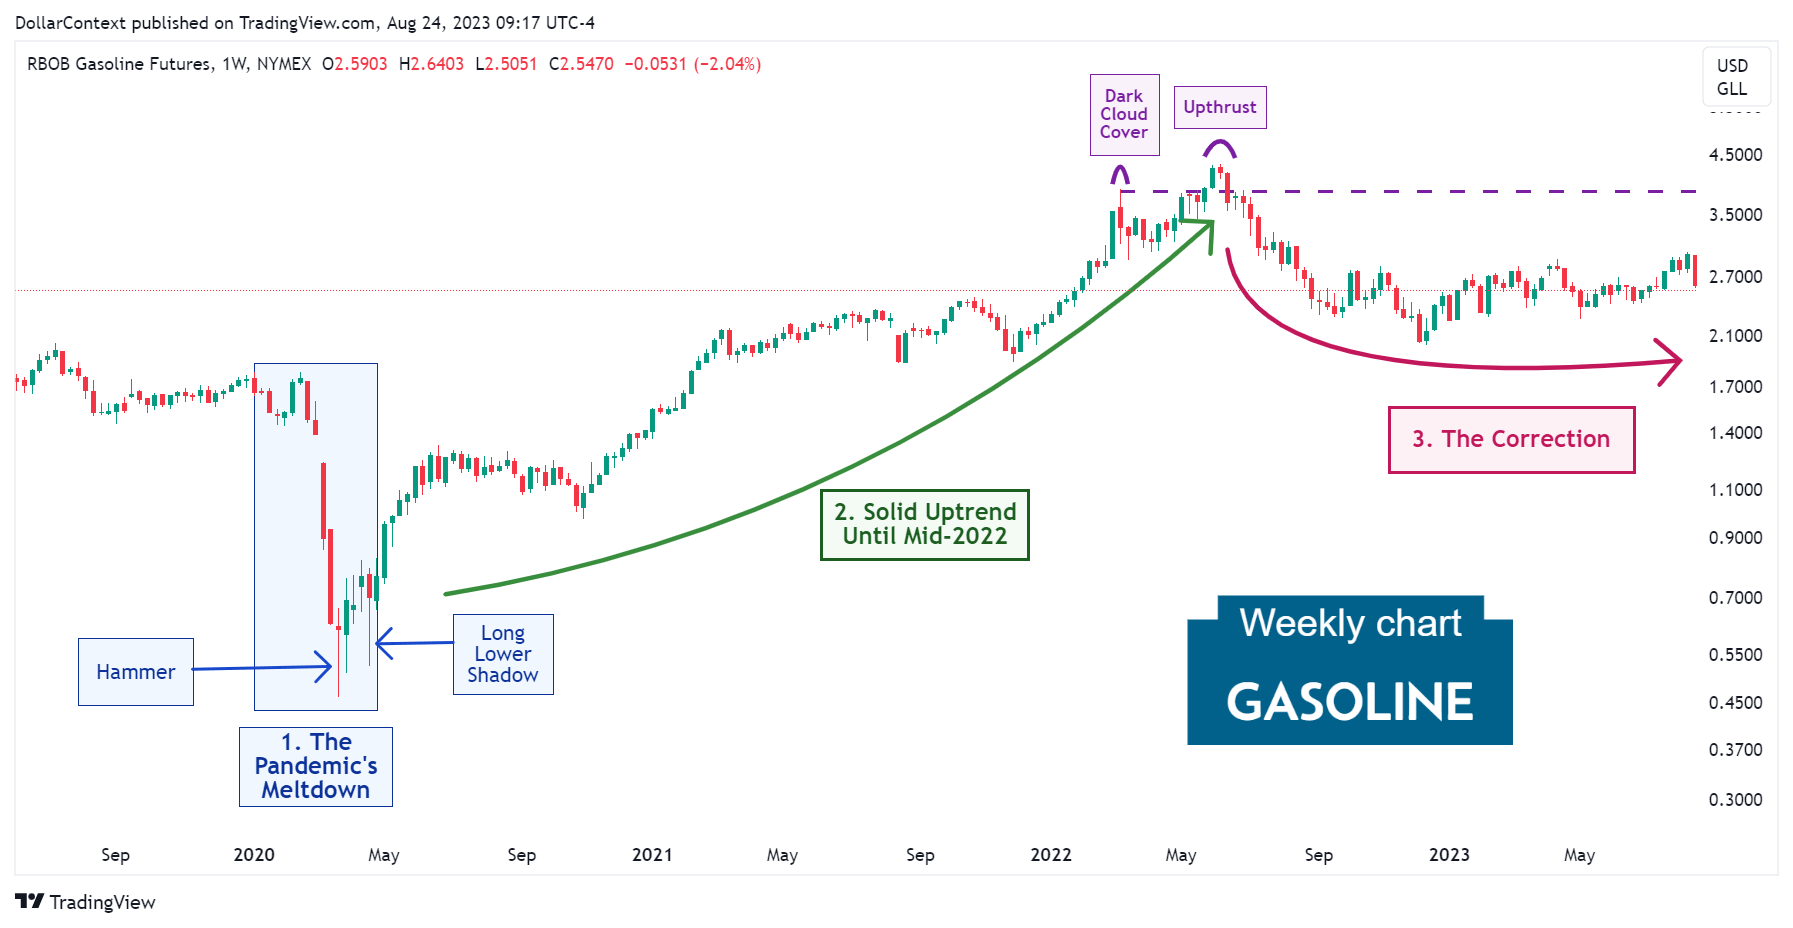
3. The Correction from June 2022 Onward
After the false breakout mentioned above, gasoline prices began a sustained correction. The Fed's commencement of a tightening cycle to tackle inflation strengthened the dollar, eventually leading to a change in the energy market outlook.
4. Outlook for the second half of 2023 and 2024
Starting in 2020, the commodity market may have embarked on a supercycle phase. Such supercycles often persist for more than 8 years, leading to notable price hikes. If this theory proves accurate, the gasoline market would have entered a correction phase since June 2022, setting the stage for a consistent upward trend in the ensuing years.
That said, with our anticipated economic deceleration in the next year due to the forceful monetary policy tightening, we could see an adjustment in gasoline prices sometime in 2024.


