Gold Prices: Evolution and Outlook
We delve into the dynamics and shifts affecting gold prices since 2015 and provide our perspective on possible upcoming trends in this market.

In this article, we'll cover the dynamics and shifts affecting gold prices since December 2015. In conclusion, we'll provide our perspective on possible upcoming trends in this market.
1. December 2015–January 2020: A Constructive Upward Trend
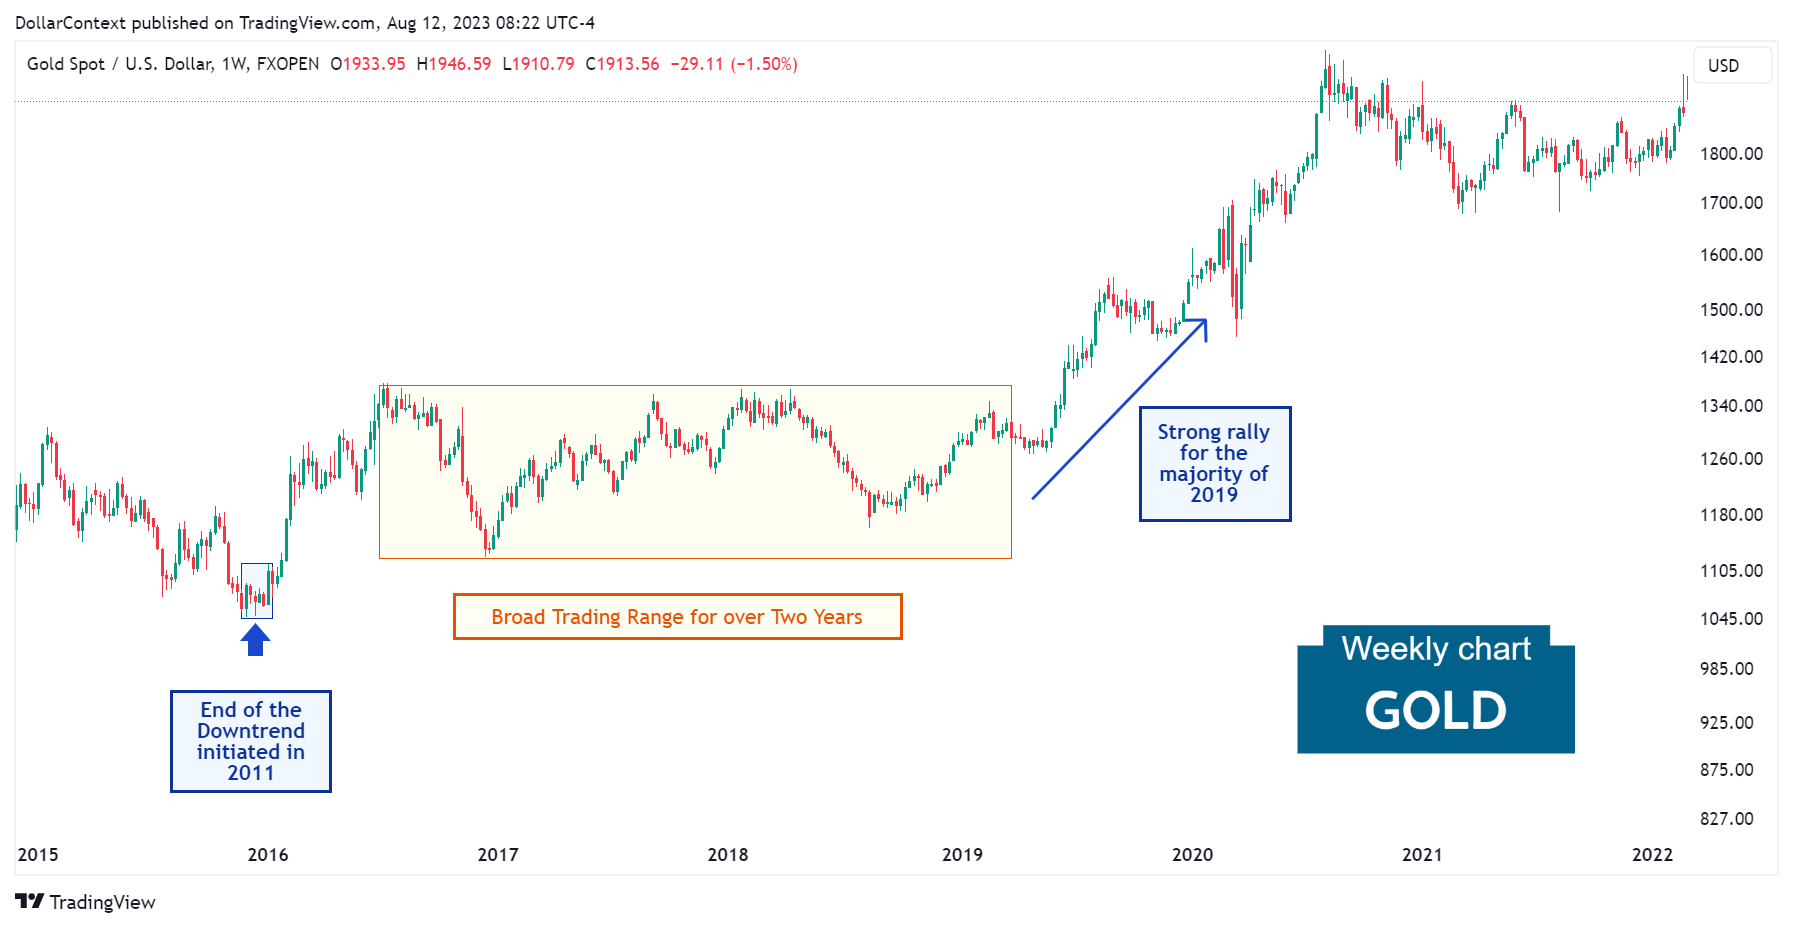
December 2015 marked the end of a prolonged bear market in gold. Then a new period kicked off in 2016, shaped by a substantial rally in prices and spurred by global uncertainties including China's economic prospects, Brexit, and the U.S. Presidential election. However, the enthusiasm waned towards the end of the year with the strengthening of the U.S. dollar after the unexpected victory of Donald Trump in the U.S. Presidential election. Throughout 2017 and 2018, the gold market exhibited a lateral trend, reflecting its inverse relationship with the U.S. dollar.
The real resurgence for gold came in 2019. Amid escalating U.S.-China trade tensions, a shift to a more dovish stance by major central banks, and the global tilt towards lower or even negative interest rates, gold solidified its position as a preferred safe-haven asset, witnessing a significant uptrend, especially in the latter half of the year. In essence, while the period was marked by volatility, the overarching trend for gold was an upward trajectory

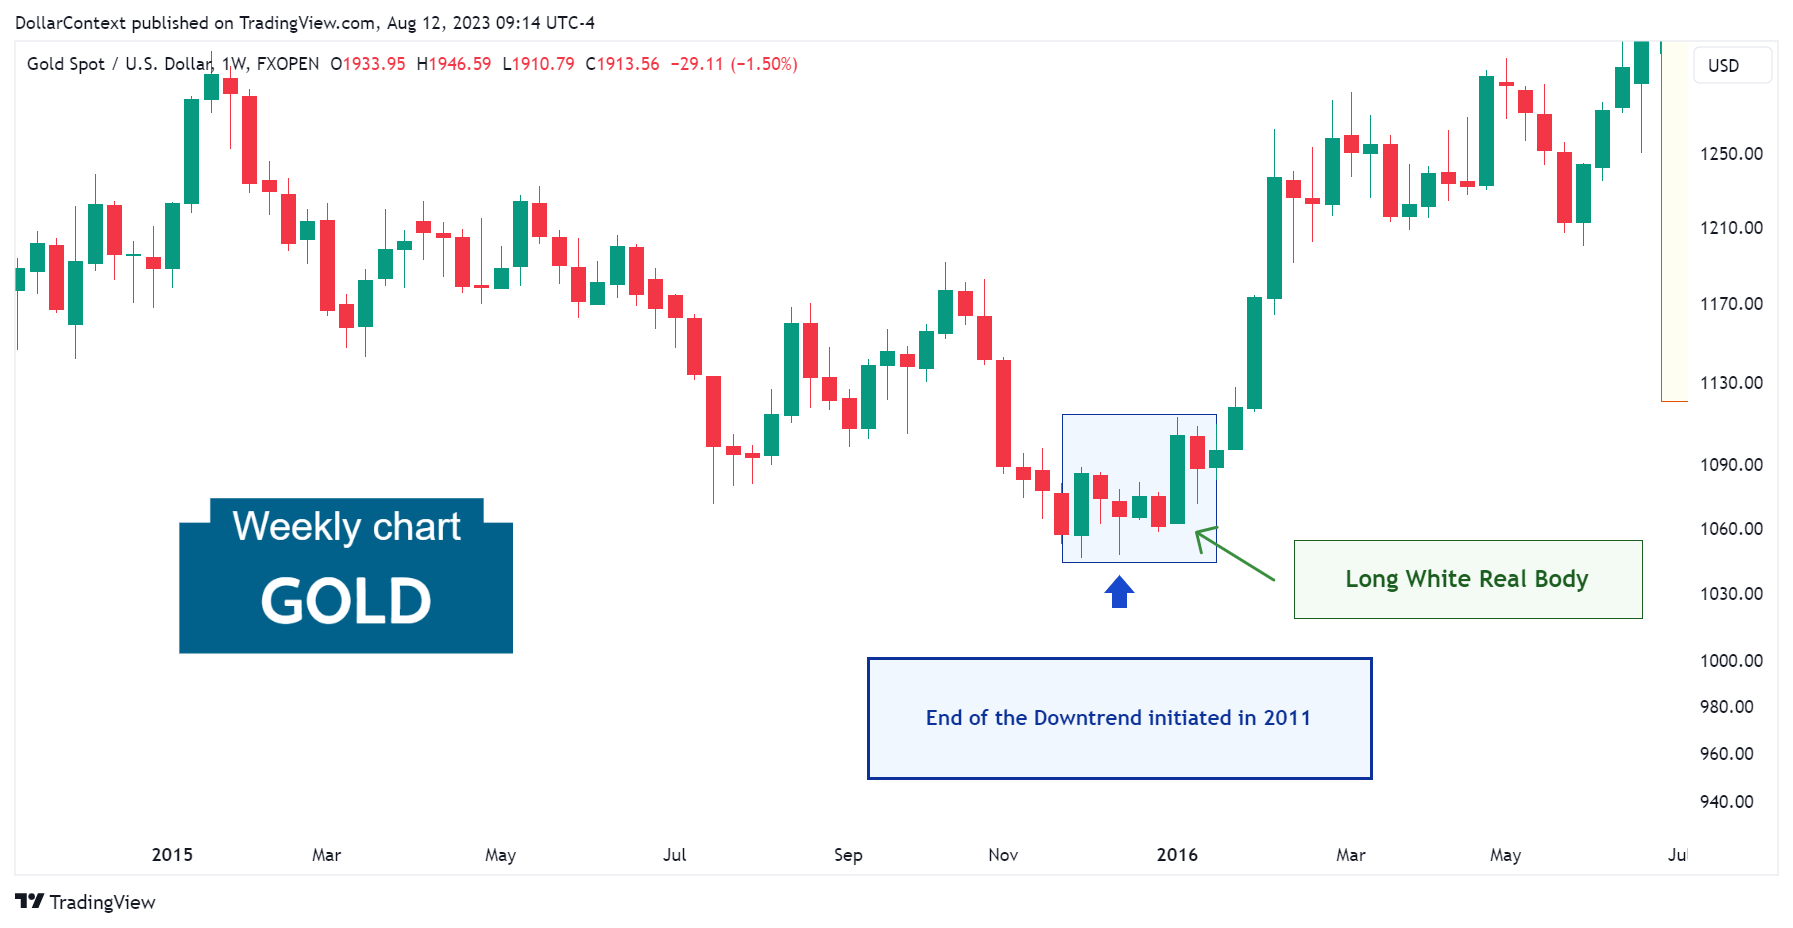
Technically, note that the lows of December 2015 were characterized by a long white real body in the first week of 2016. This provides a detailed view of the prior chart, highlighting the candlestick formation.

2. February 2020–March 2020: The Turbulent Times of the Pandemic
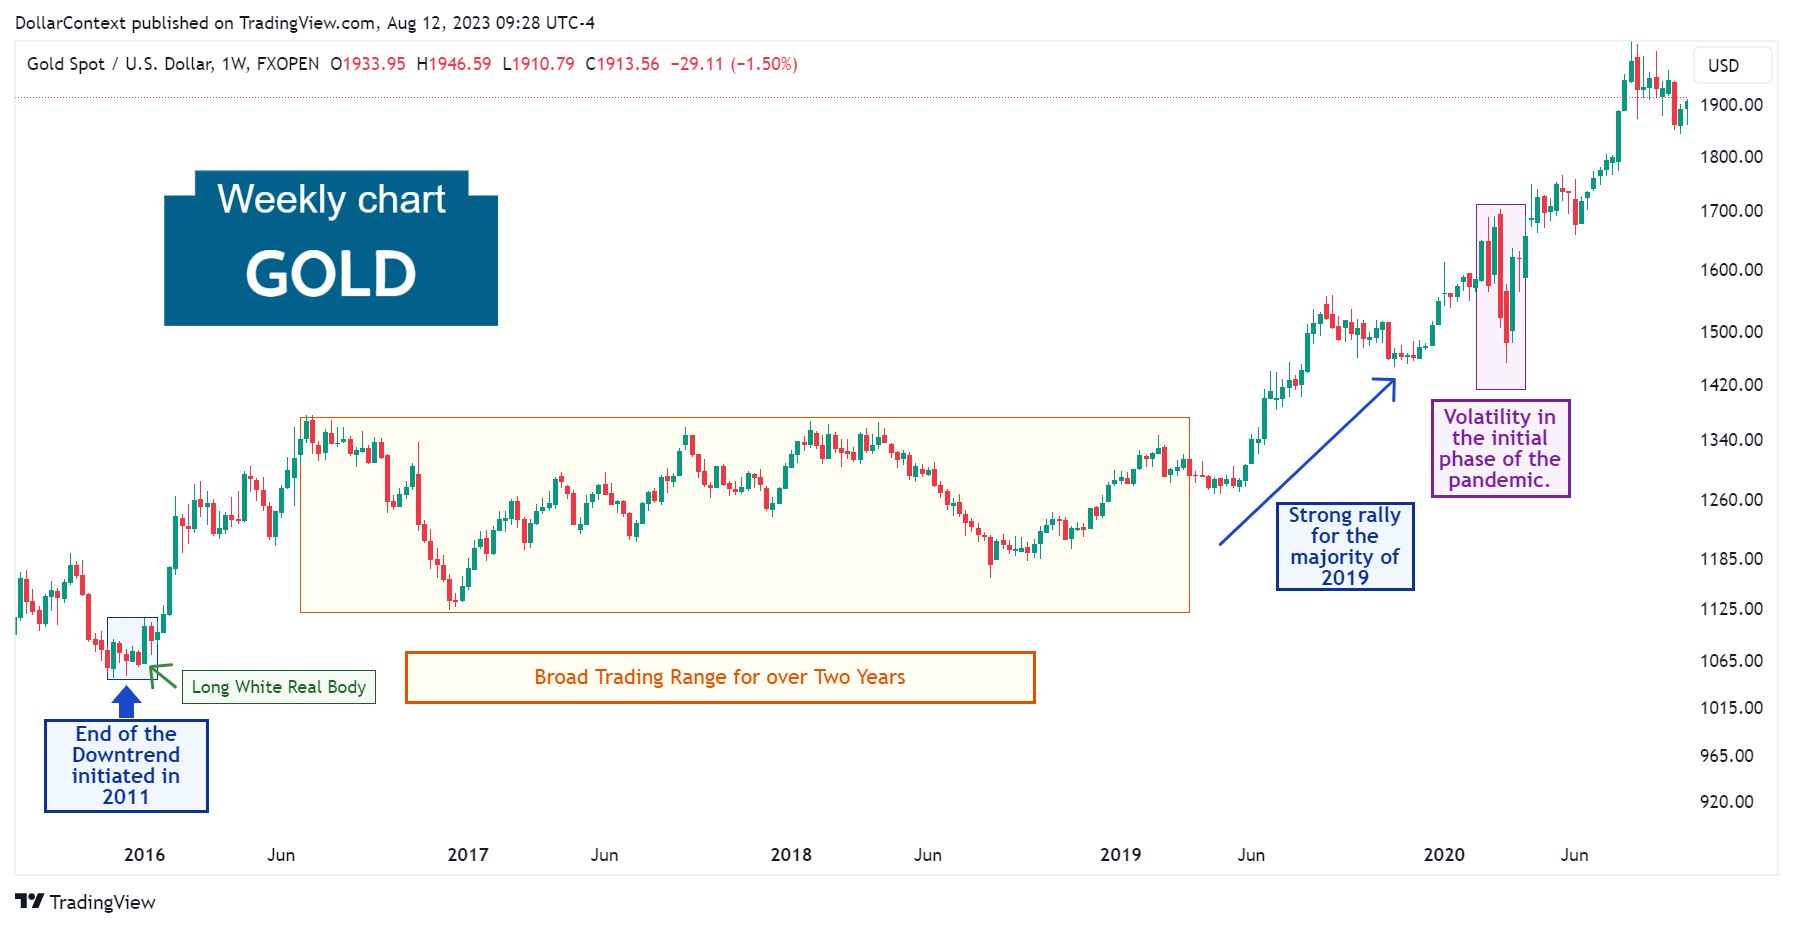
Between February and March 2020 (highlighted in purple on the chart below), the gold market underwent a phase of intense volatility, likely triggered by fluctuations in the dollar and the global shift towards safer assets.

3. From April 2020 Onward: The Ascent beyond Previous All-time Highs, Followed by a Wide Trading Range
Following the volatile weeks of the initial phase of the pandemic, another surge pushed gold prices to record highs, though the market soon pulled back, embarking on a somewhat sideways trend without clear lower limits.
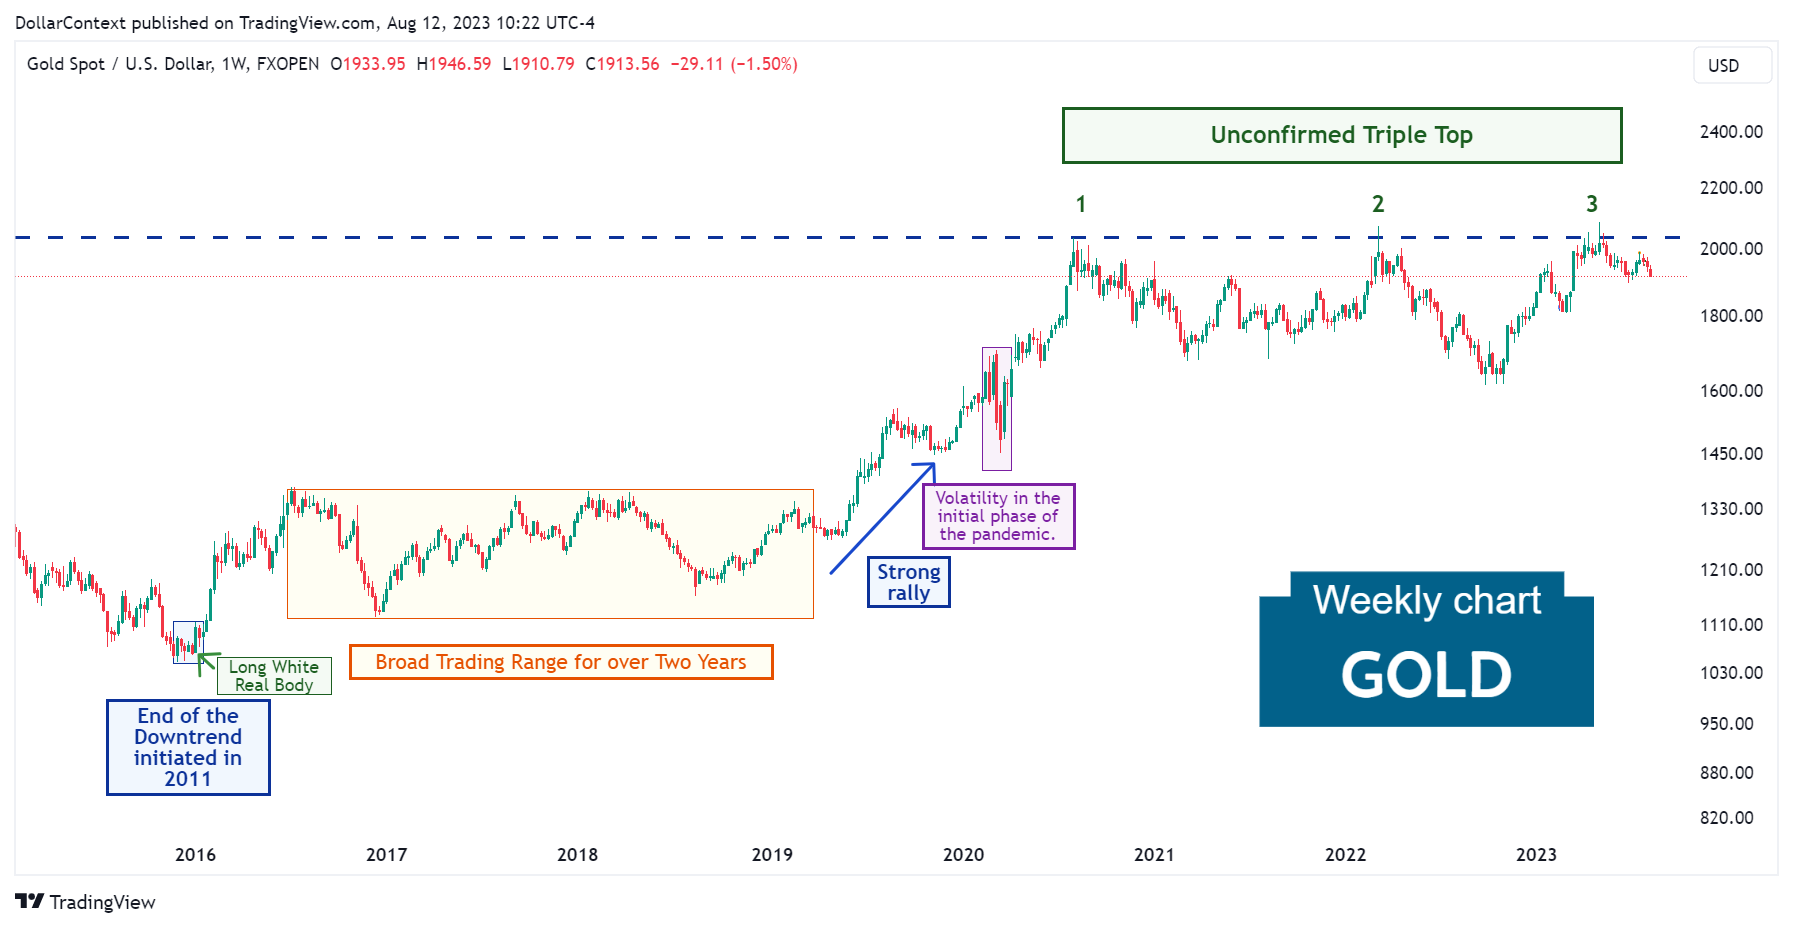
Observe the market's triple top since August 2020, which remains unconfirmed to this day.

From a candlestick view, the second top is distinguished by a shooting star right at a crucial resistance point. Furthermore, the third top showcased a candle with a long upper shadow, emphasizing the aggressiveness of the bears near this significant resistance area. Both these candle patterns can be characterized as upthrusts.
4. Outlook for Gold in 2023 and 2024
When projecting the gold trajectory for the next two years, it's pivotal to consider these three key factors:
- Supercycle Theory: The commodity market, beginning in 2020, may have embarked on a supercycle phase. Such a supercycle typically lasts for over eight years, leading to significant price increases in global commodities. If this assumption is correct, the gold market might resume its long term upward trend at some point.
- Recession Hypothesis: With the Federal Reserve's assertive interest rate hike strategy and telltale signs from leading indicators, like the inverted yield curve, there's a considerable chance of an economic downturn, possibly around 2024. Typically, commodities, including gold, face price pressures during the early stages of a recession.
- Short-term Technical Indicators: The technical signals suggesting a potential bearish reversal, mentioned in the previous section, are too compelling to be ignored.


