
Lead Prices: Evolution and Outlook
We cover the factors and changes influencing lead prices post-2015. We'll wrap up with our insights on potential future trends in this market.


In this article, we'll cover the factors and changes influencing lead prices post-2015. We'll wrap up with our insights on potential future trends in this market.
1. December 2015—November 2016: The Notable Upward Trend
Several factors likely drove the increase in lead prices from December 2015 to November 2016, including:
- Global Demand: The demand for lead mainly came from the battery sector. Automotive and industrial batteries are the biggest consumers of lead, and any growth or slowdown in these sectors has direct implications for lead demand.
- Chinese Market: China has always been a major player in the metals market, including lead. In 2016, any changes in China's industrial production, environmental regulations, and economic growth played a significant role in driving the lead market.
- Environmental Concerns and Supply Constraints: Increasing environmental concerns and regulations around the world could influence the lead market. Stricter regulations could increase production costs or lead to the closure of mines that don't meet the required standards. In fact, during this period, there were instances of mine closures or reduced production levels worldwide.
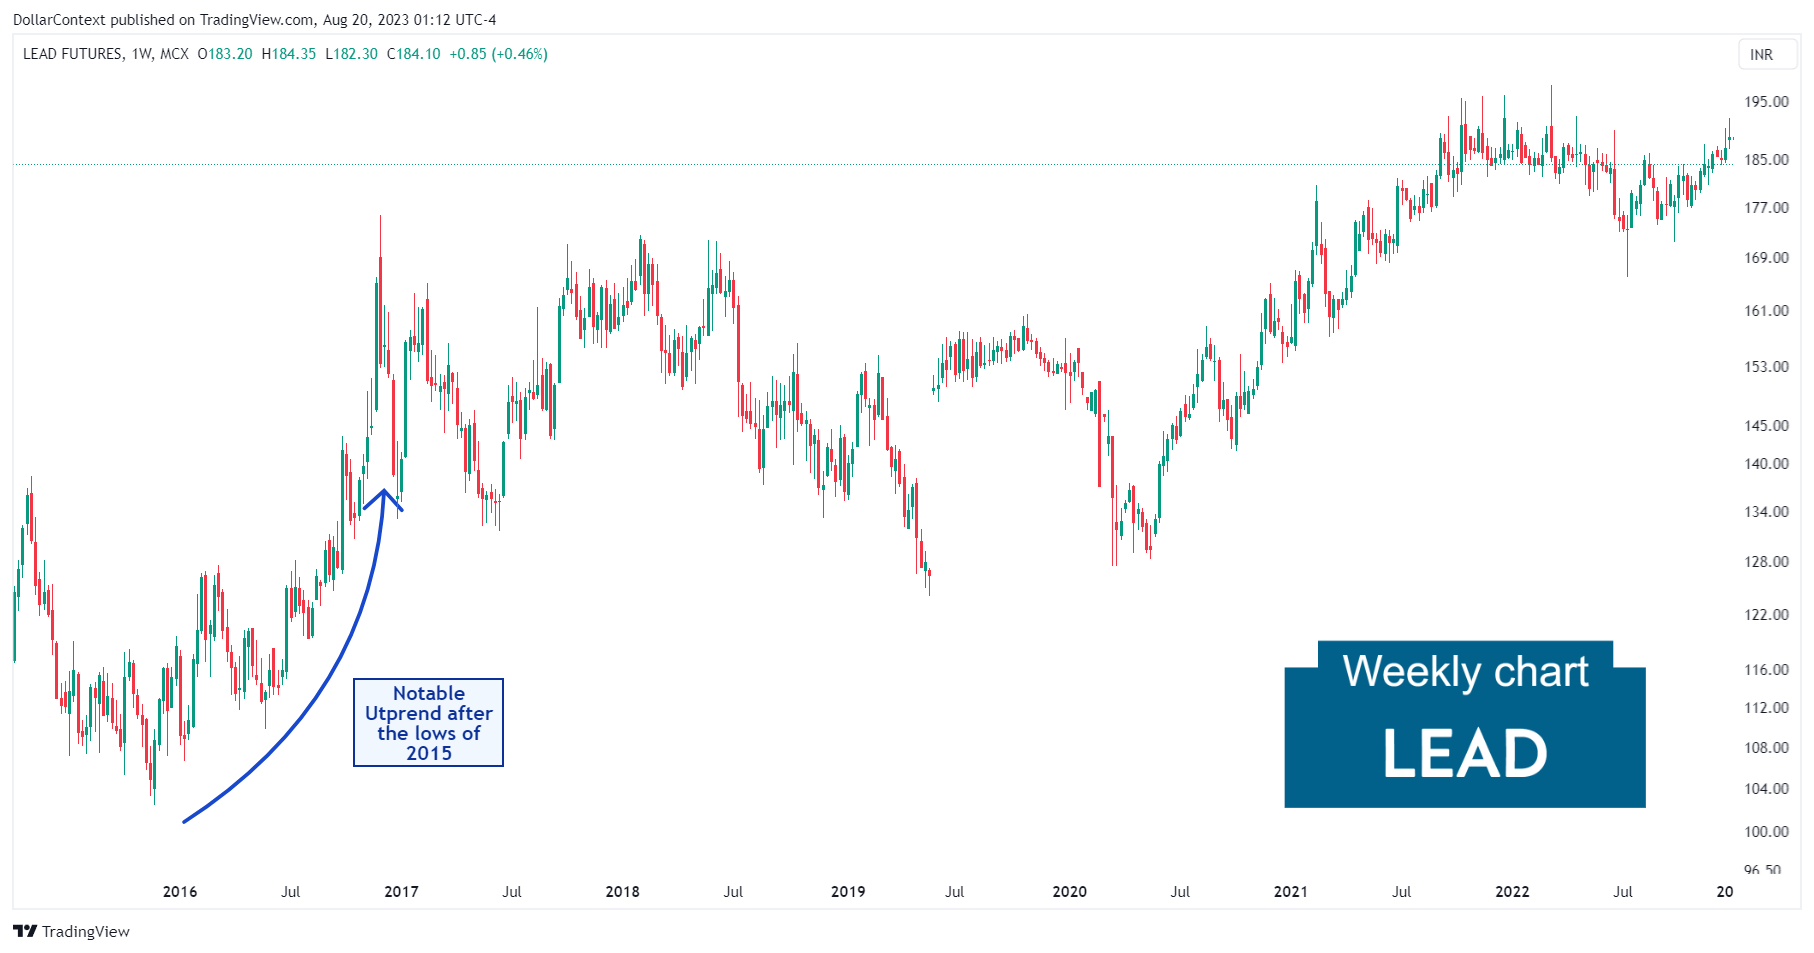
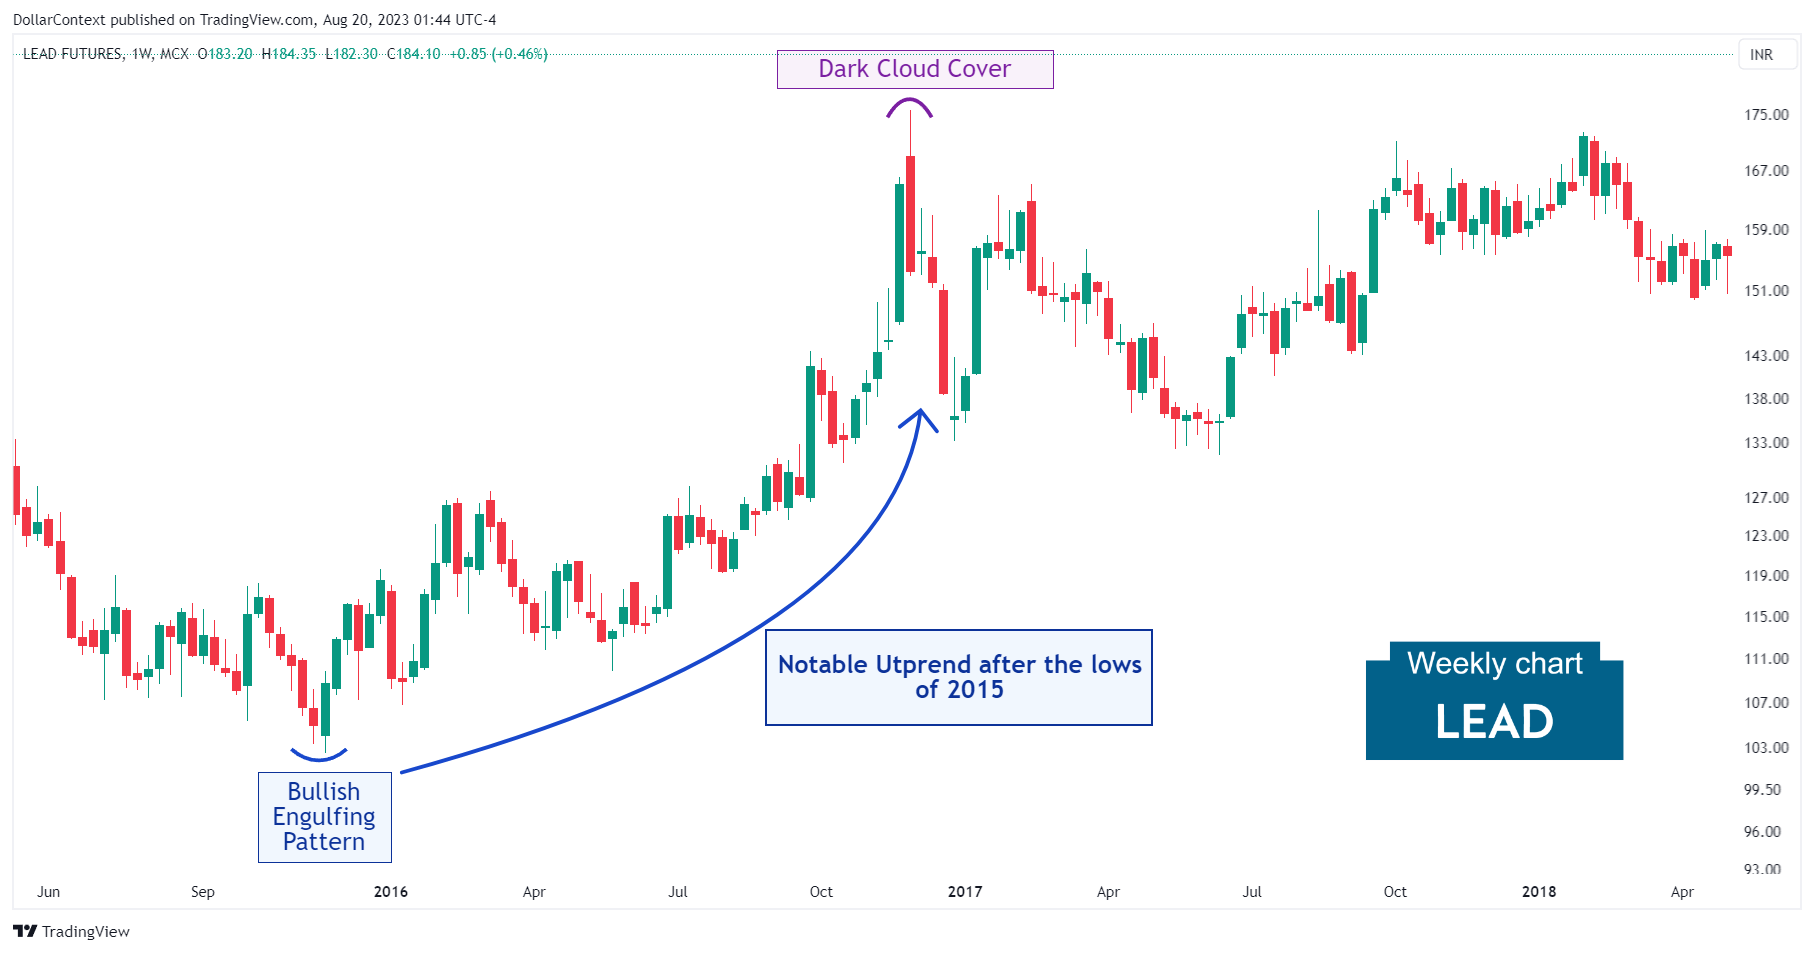
From the perspective of candlestick analysis, examining the chart closely reveals that the 2015 lows were highlighted by a bullish engulfing pattern, while the peak at the end of 2016 displayed a dark cloud cover formation.
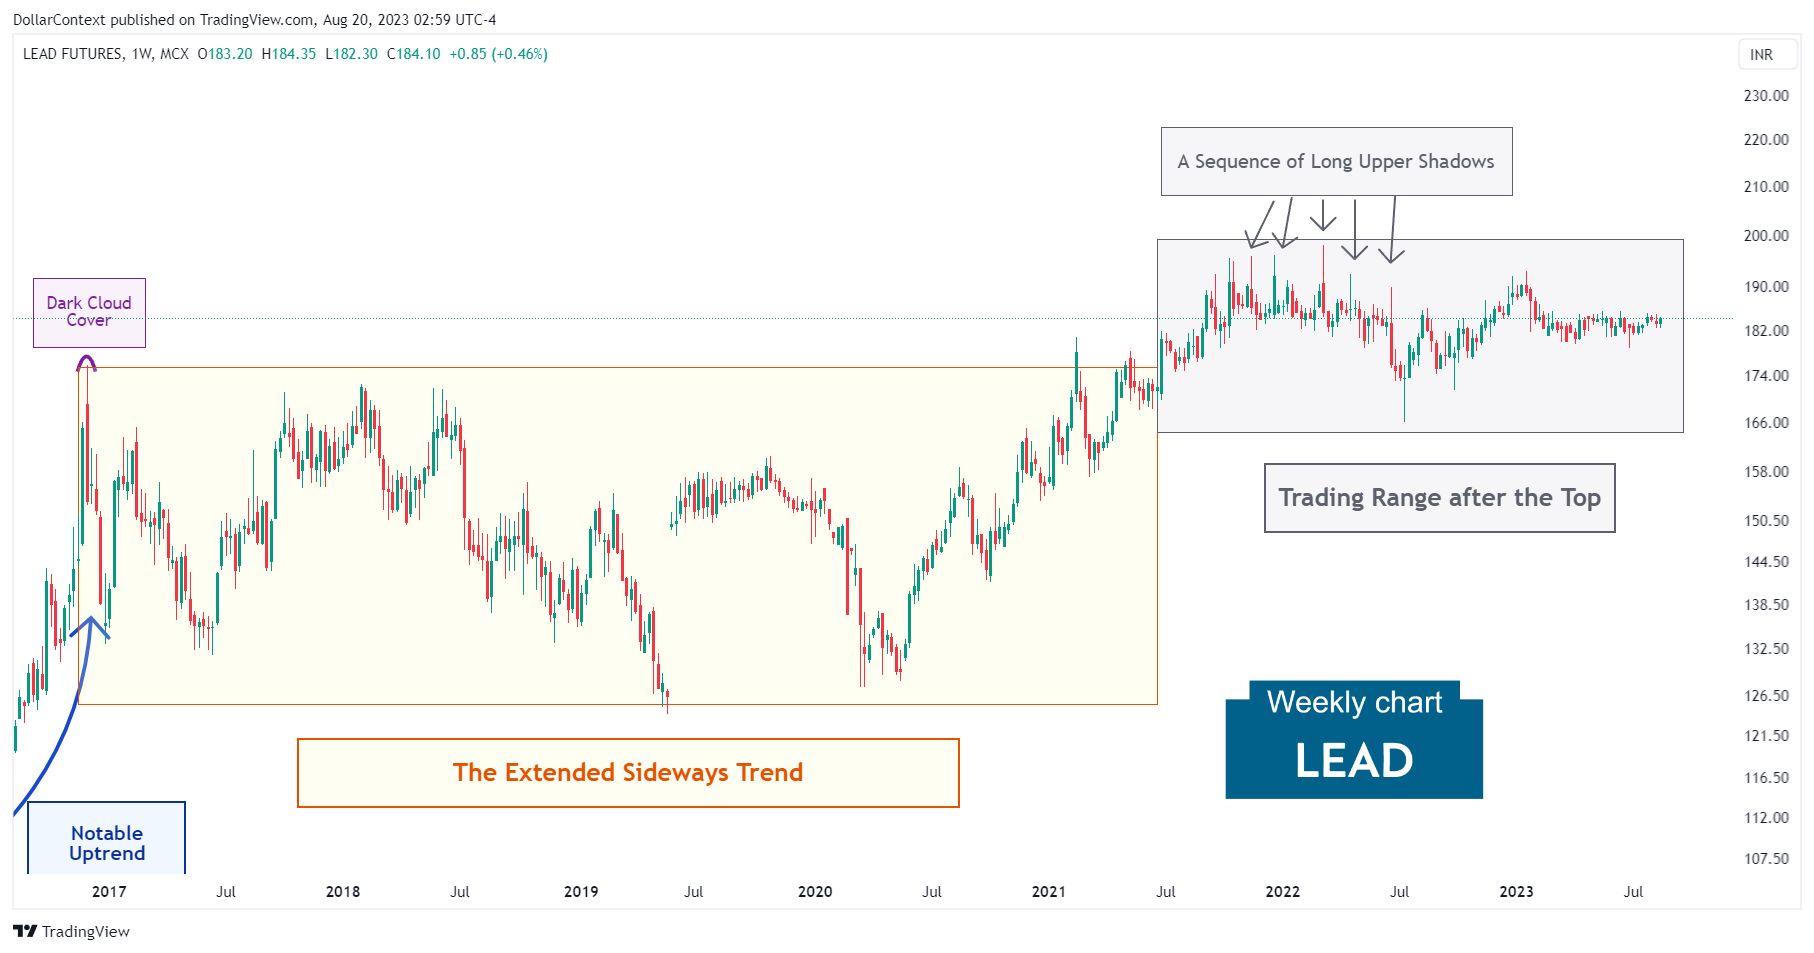
2. December 2016—June 2021: The Extended Sideways Trend
For nearly five years, lead prices oscillated within a broad trading range. The last significant drop coincided with the early stages of the pandemic, which introduced volatility from a global economic slowdown and disruptions in both demand and supply. Dollar fluctuations were also influential throughout this period.

3. From July 2021 Onward: The Lead Price Peak
After the tumultuous weeks marking the onset of the pandemic, a subsequent surge in July 2021 drove lead prices upward, breaking past the previous trading range. Then a new sideways trend, marked by a sequence of long upper shadows, started to develop. This trend remains in play today.
The tightening monetary policy implemented by the Federal Reserve and other leading central banks, coupled with dollar shifts, are likely reasons for the lead price stagnation during this time.
4. Outlook for Lead in 2023 and 2024
When forecasting the lead trend for the upcoming two years, these two key elements might be essential to consider:
- Supercycle Theory: Starting in 2020, the commodity market might have entered a supercycle phase. These supercycles often span more than eight years, resulting in considerable price hikes for global commodities. If this premise holds true, the lead market could eventually return to its long-term upward trajectory.
- Recessionary Outlook: Given the Federal Reserve's aggressive interest rate increase approach, there's a substantial likelihood of an economic slump, potentially in 2024. In the initial phases of a recession, commodities such as lead often typically experience pricing pressures.


