Natural Gas Prices: Evolution and Outlook
We explore the factors that have impacted natural gas prices since 2020, and detail our view on future trends in this market.

This analysis reflects market conditions and information available at the time of publication (September 2023). It is provided for educational and historical context.
In this article, we'll explore the drivers and shifts impacting natural gas prices since 2020. We'll conclude with our perspectives on future trends in this market.
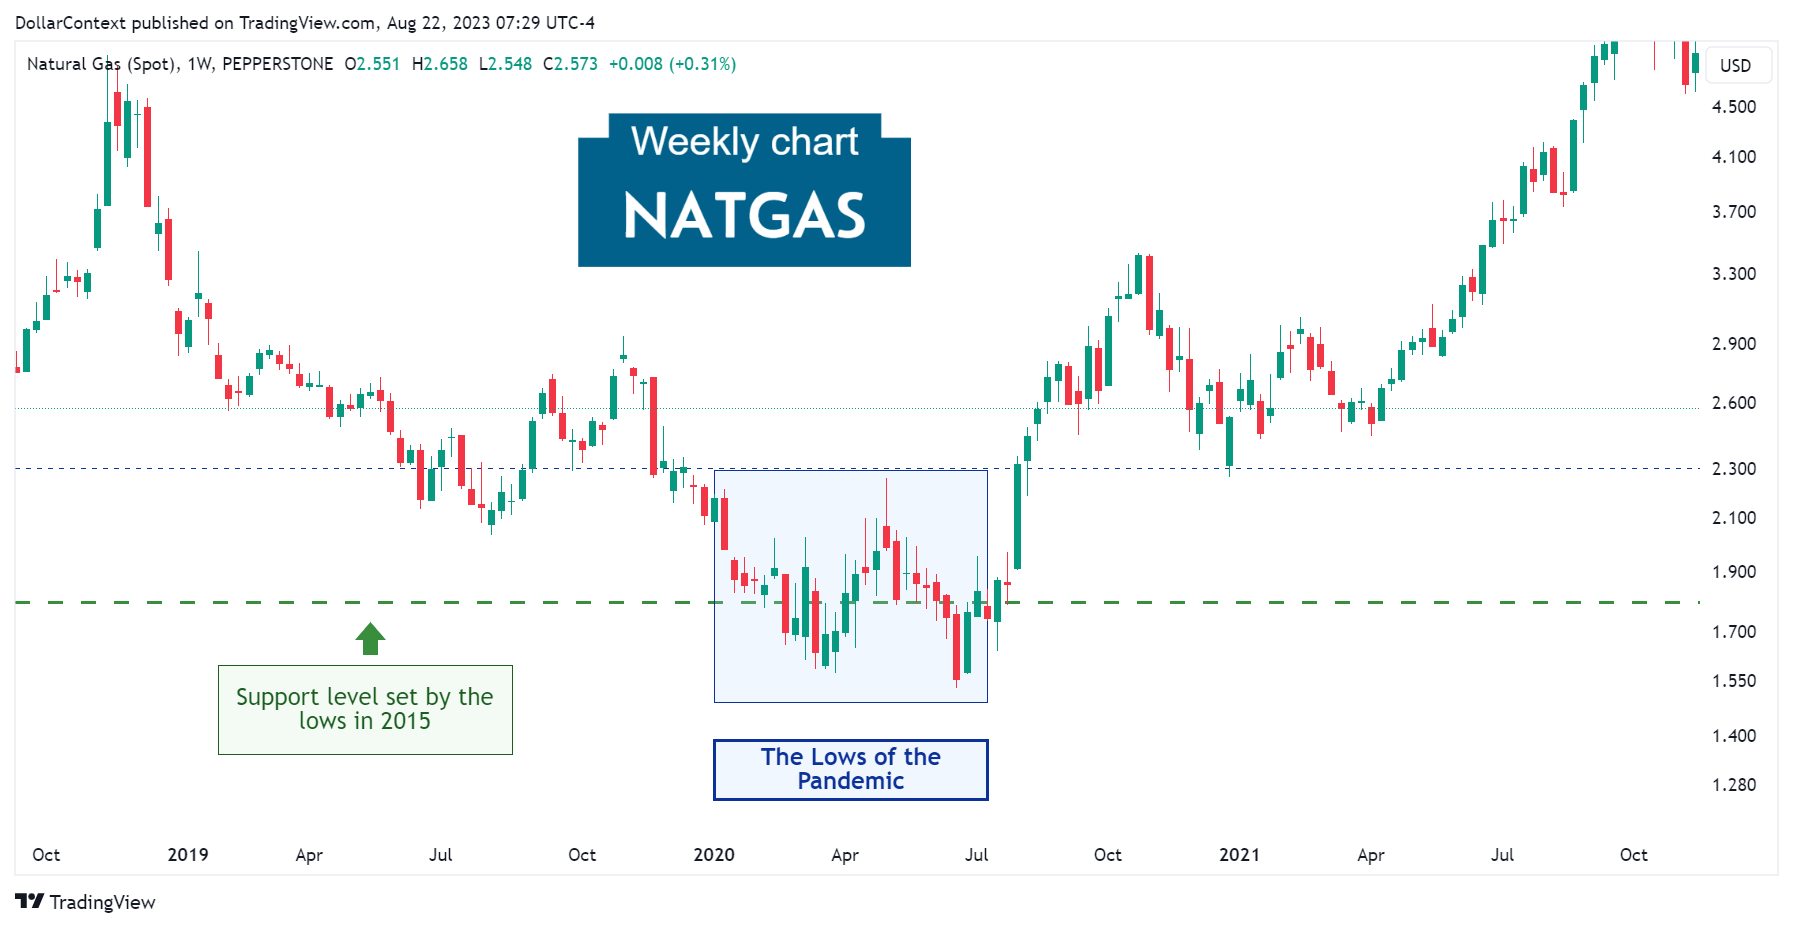
1. January 2020–June 2020: The Lows of the Pandemic
During the first half of 2020, global economic slowdown concerns, largely due to the pandemic, influenced the broader energy market sentiment. Among the factors that shaped natural gas prices during this period, we can highlight:
- COVID-19 Pandemic: The sudden onset of the COVID-19 pandemic significantly impacted global energy demand. Many industries slowed or halted production, and commercial energy use decreased due to lockdown measures. This reduced demand pressured natural gas prices.
- Mild Winter in the Northern Hemisphere: The winter of 2019—2020 was milder than average in many parts of the Northern Hemisphere, particularly in the U.S. A milder winter means less demand for natural gas for heating, leading to higher inventory levels and downward pressure on prices.
- Increased Production Capacity: Prior to 2020, there was an expansion in natural gas production, especially in the United States, due to the shale revolution. This led to an oversupply situation, which, coupled with the reduced demand, pushed prices down.
From a technical analysis perspective, observe how natural gas prices displayed two false breakouts (springs) of the historical support level set by the lows in 2015.
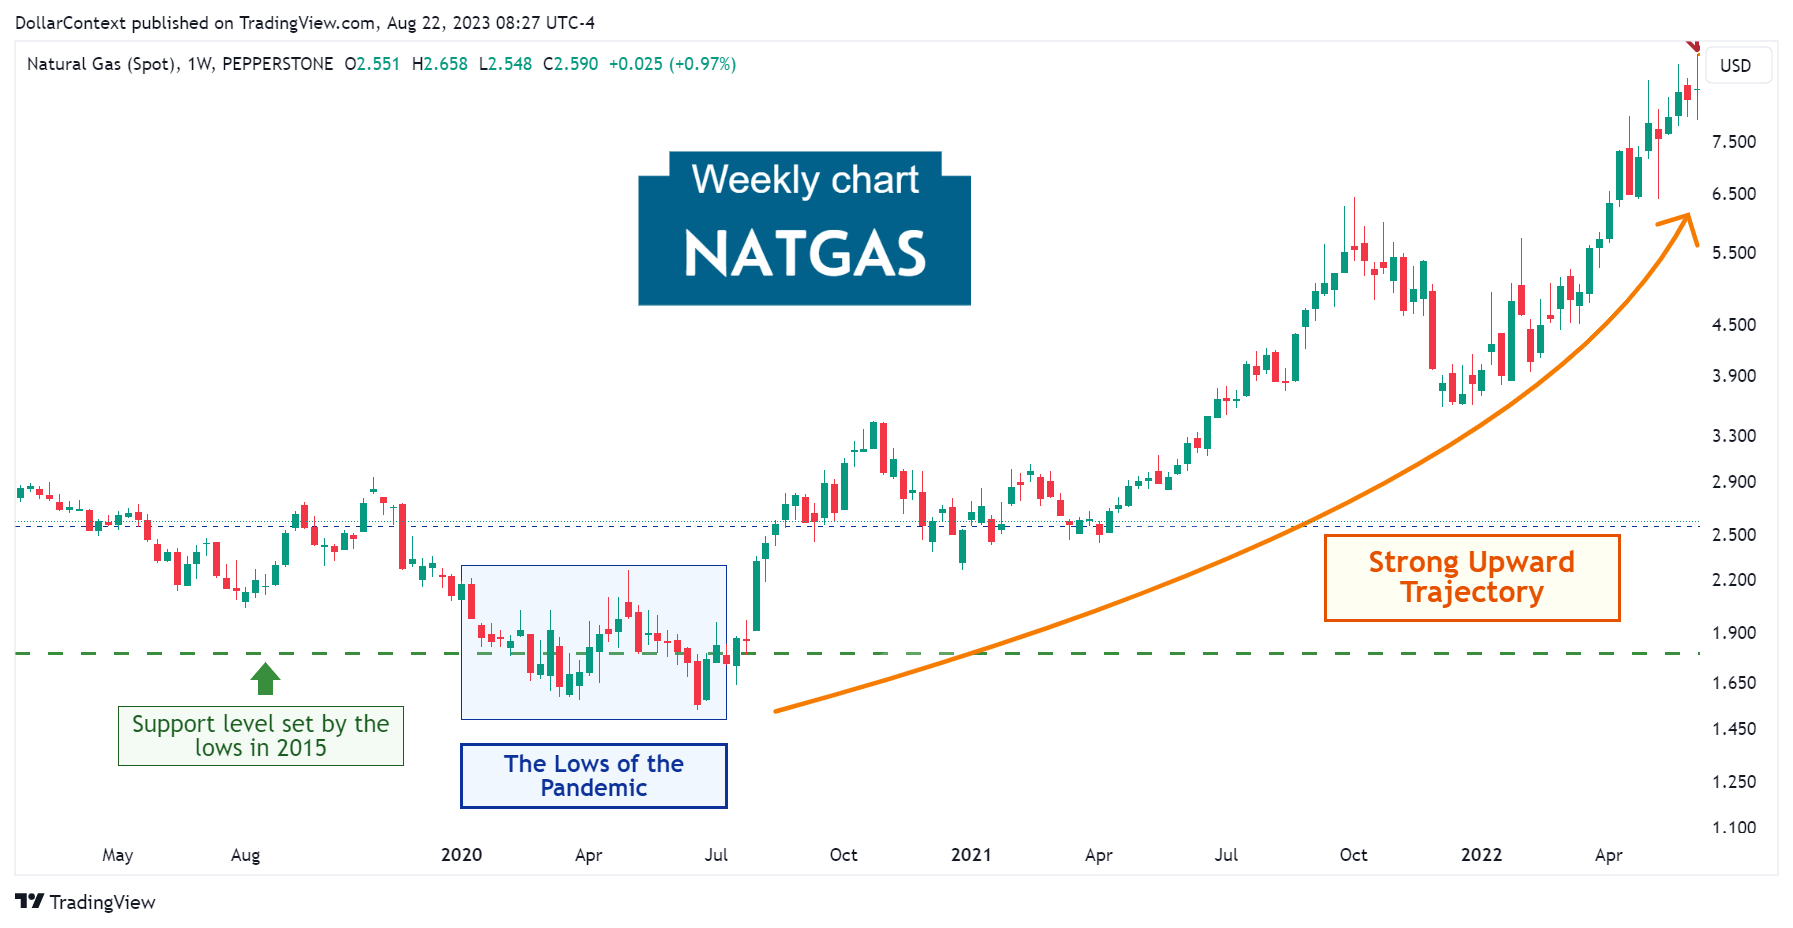
2. July 2020–April 2022: The Striking Upward Trajectory
Over a span of 22 months, natural gas prices surged by more than 400%. The stimulus measures introduced by the Federal Reserve and other major central banks to counter the economic slump and promote growth ultimately led to a change in energy market sentiment.
In the first half of 2022, natural gas prices gained momentum following the onset of the Ukrainian-Russian conflict and Russia's use of natural gas supplies as a geopolitical tool. This war raised concerns about the stability of natural gas supplies to Europe.
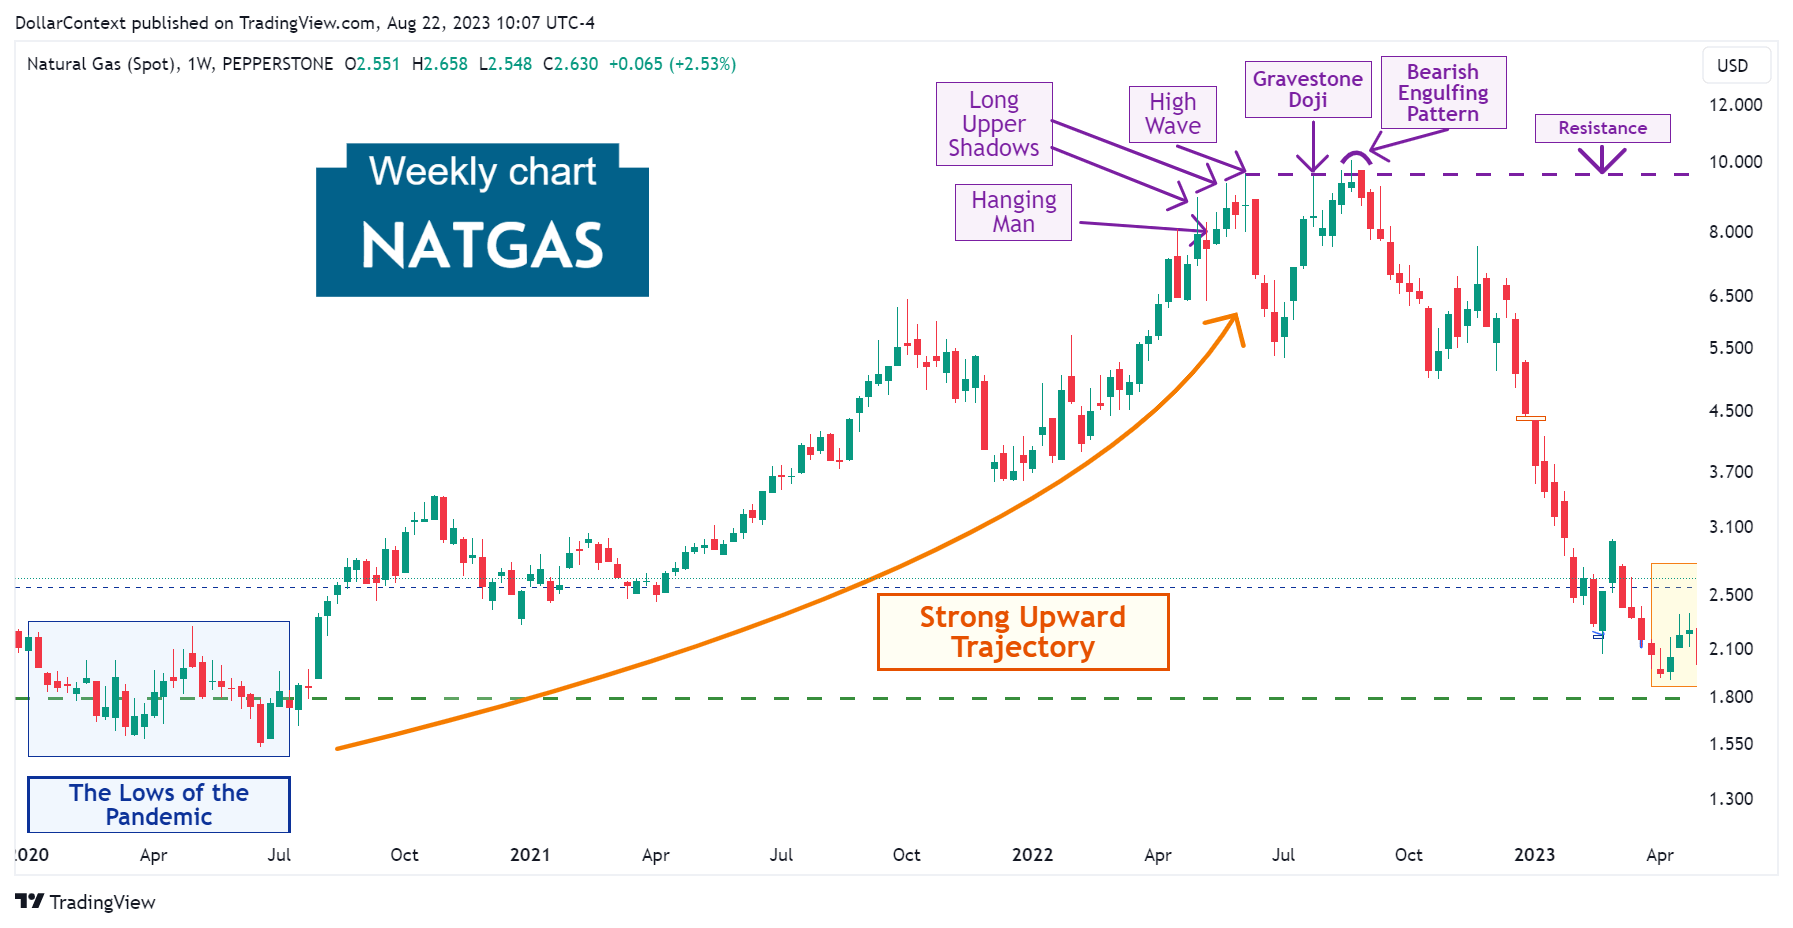
3. May 2022–September 2022: The Top
Rising inflation rates observed in the US, Europe, and other regions prompted the Federal Reserve and other leading central banks to implement an aggressive rate-hiking cycle to temper the economy and address inflation. Consequently, the dollar strengthened, and many commodity asset prices reached a market peak.
For natural gas, multiple candlestick indicators surfaced, suggesting that the prior bullish trend was nearing its conclusion. These are indicated in purple on the chart and can be described as follows:
- Hanging Man: In May 2022, the appearance of a hanging man pattern suggested a potential threat to the ongoing bullish trend. However, the market initially ascended to slightly surpass the highs of the hanging man.
- Long Upper Shadows: A few sessions later, two long upper shadow candles emerged to reflect the fierceness of the bears near those price levels.
- High Wave: The high wave candle during the initial week of June underscored the possibility of a reversal or peak in that vicinity.
- Gravestone Doji: The July's gravestone doji reinforced the significance of the 9.60 mark as a key resistance zone.
- Bearish Engulfing Pattern: Finally, the bearish engulfing pattern in August 2022 marked the peak of the market and the beginning of a new bear trend.
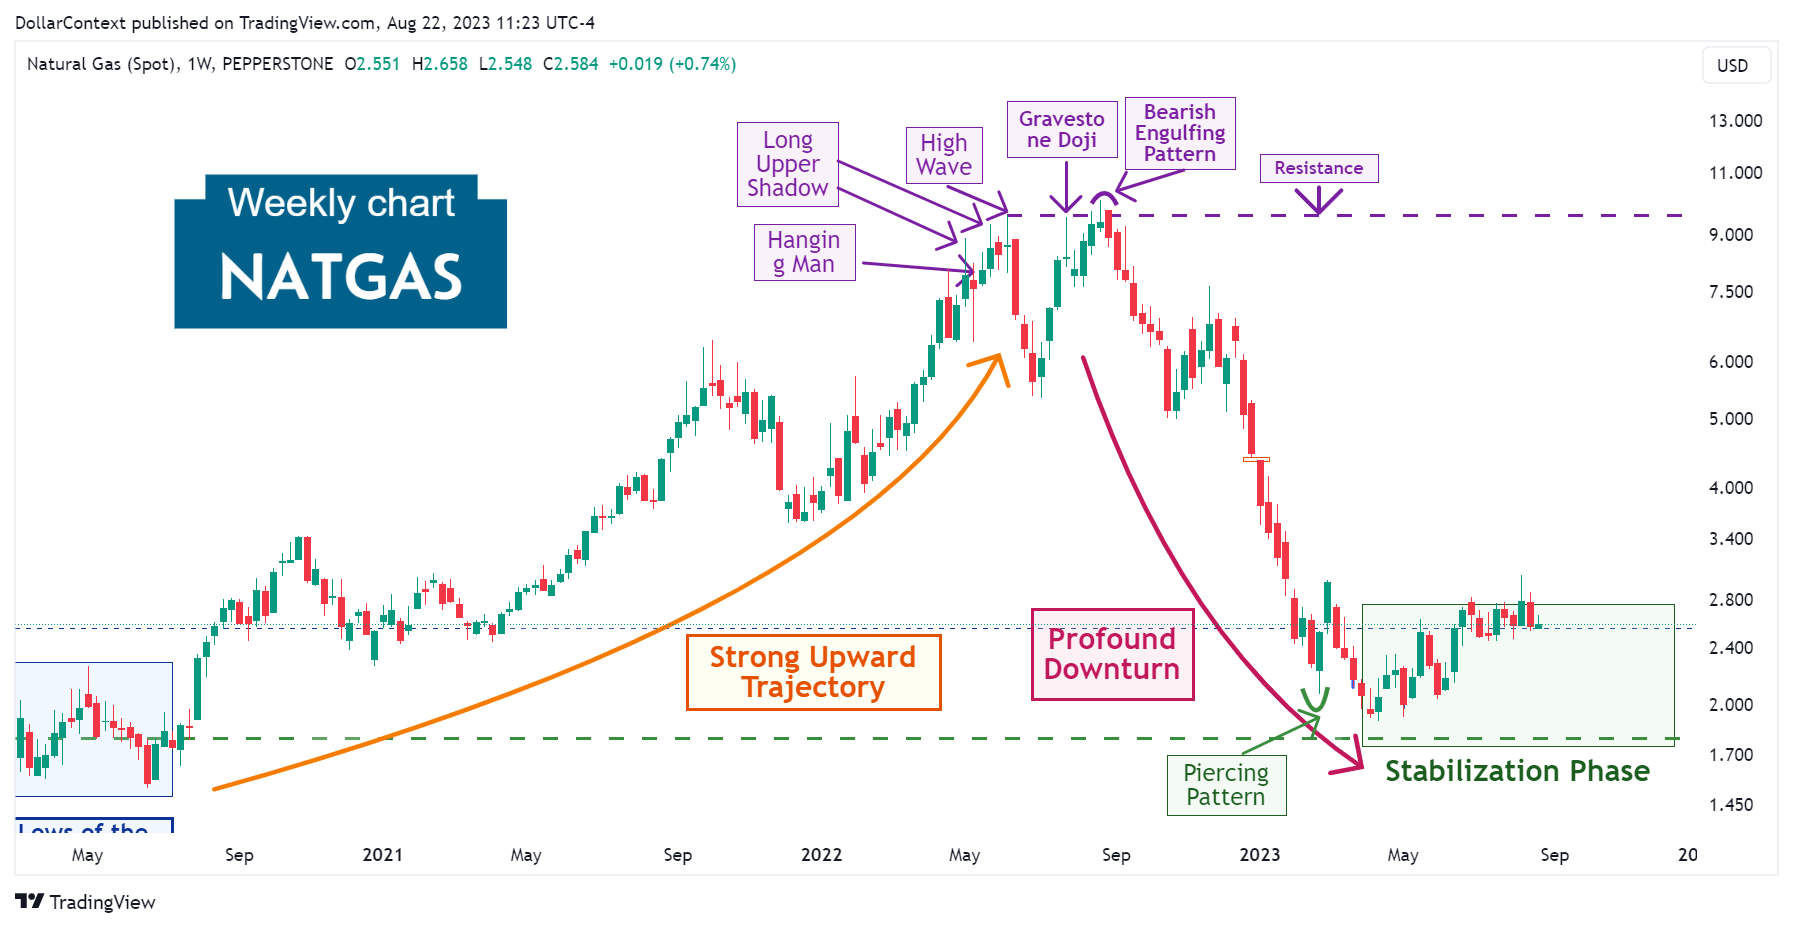
4. October 2022–July 2023: The Dramatic Decline
After the series of candlestick patterns mentioned earlier, natural gas prices embarked on a sharp downward trajectory for roughly five months. The intensification of the Federal Reserve's restrictive monetary policy and the notable appreciation of the dollar have been major contributors to this decline.
It was only in April 2023 that the market began showing signs of stabilization while attempting to form a pattern of higher highs and higher lows. Note the piercing pattern and the subsequent spring before the stabilization phase.
5. Outlook for Natural Gas in 2023 and 2024
The following perspective reflects expectations based on information and policy signals available at the time of writing.
When projecting the trend for natural gas prices over the next two years, it's crucial to take these two key factors into account:
- Supercycle Theory: Beginning in the 2016–2020 period, the commodity market may have embarked on a supercycle phase. Such supercycles typically last over eight years and can lead to significant price increases for global commodities. If this assumption proves accurate, the natural gas market might resume its long-term upward trend.
- Recessionary Outlook: Considering the Federal Reserve's assertive stance on raising interest rates, there's a significant chance of an economic downturn, possibly by 2024. In the early stages of a recession, energy commodities, such as natural gas, typically face price challenges.


