
Oil Prices (WTI): A Glimpse into the Future
Starting in 2020, the commodity market may have entered a supercycle phase. Such supercycles usually extend beyond 8 years and lead to substantial price escalations.

In this post, we'll explore the technical aspects and fundamental dynamics that have been driving the trajectory of oil prices, specifically the West Texas Intermediate (WTI) oil. Finally, we'll consider the potential evolution of this market.
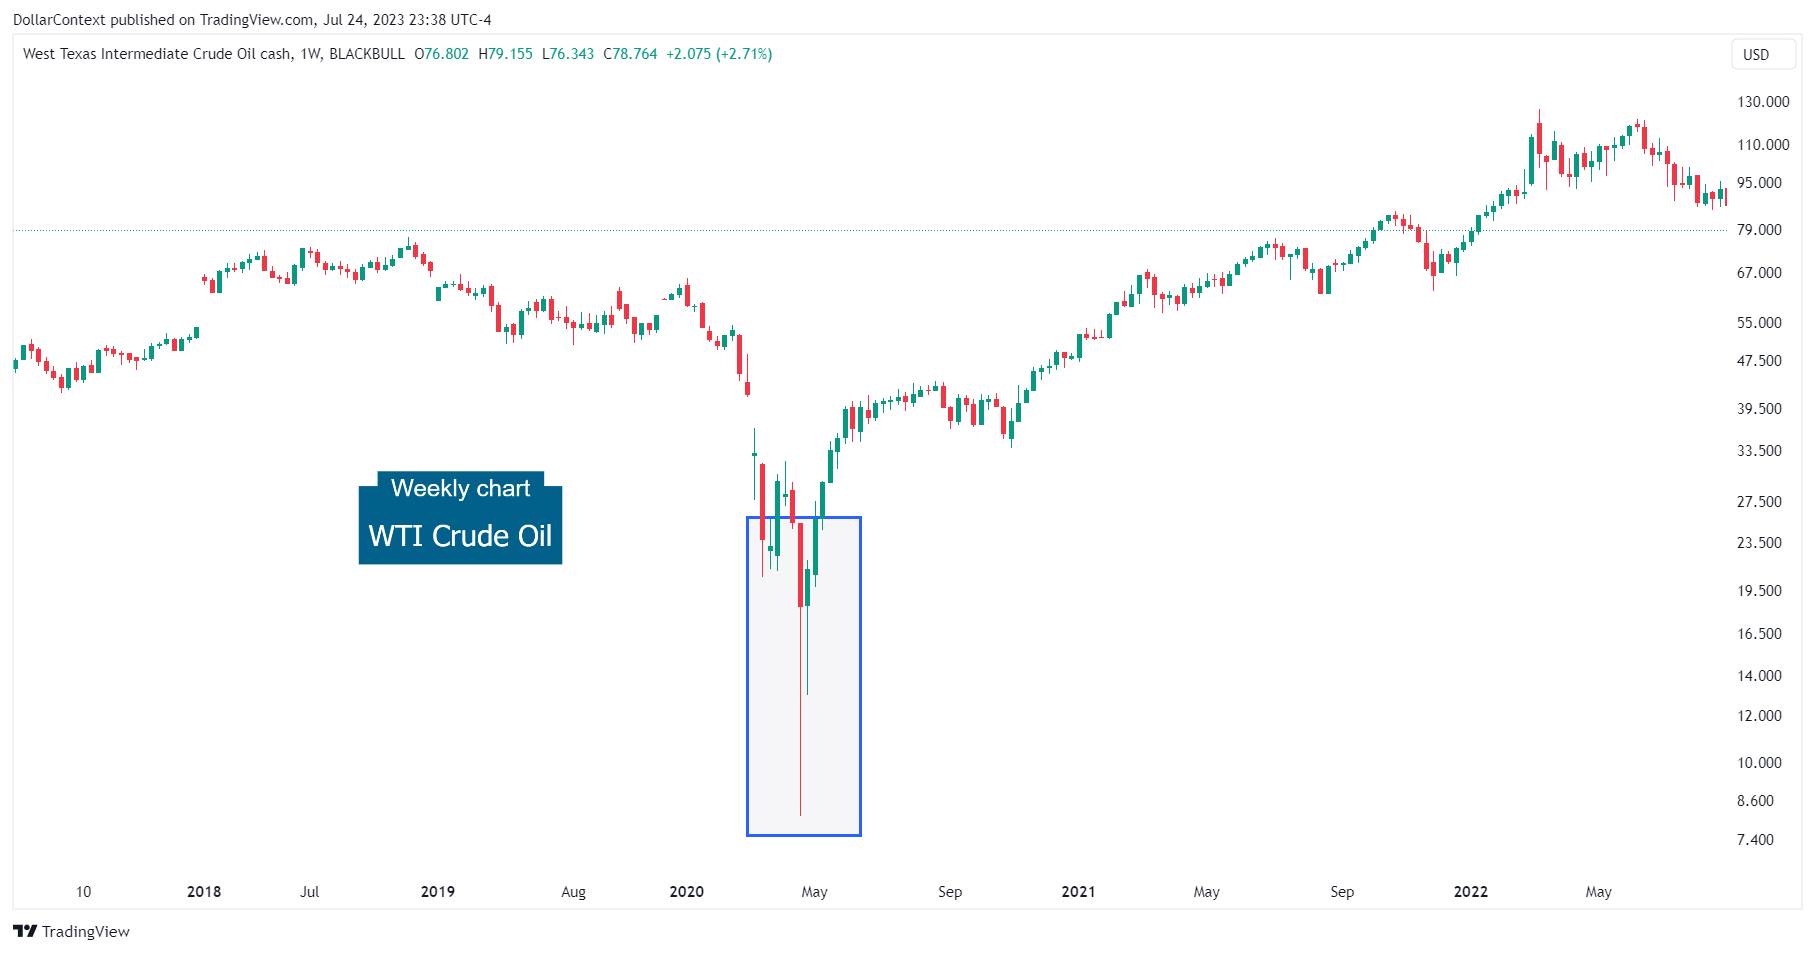
1. April 2020: The Collapse
In April 2020, oil prices collapsed. A combination of variables led to a severe demand shock and a supply glut. Here are the two key drivers of this exceptional contingency:
- COVID-19 Pandemic: The COVID-19 outbreak led to a global slowdown, forcing many countries to impose lockdowns and travel restrictions. This drastically reduced the demand for oil, as industries closed and transportation needs plummeted.
- Limited Storage Capacity: With production exceeding demand by a large margin, the world quickly ran out of places to store all the excess oil. This was particularly problematic in landlocked places like Cushing, Oklahoma, a critical hub in the U.S. oil market. In fact, the lack of storage was so severe that prices for West Texas Intermediate (WTI), a grade of crude oil used as a benchmark in oil pricing, went negative in April 2020. This meant that sellers were effectively paying buyers to take oil off their hands and avoid storage costs.
Observe how the plummet concluded with an impressive long lower shadow candle.
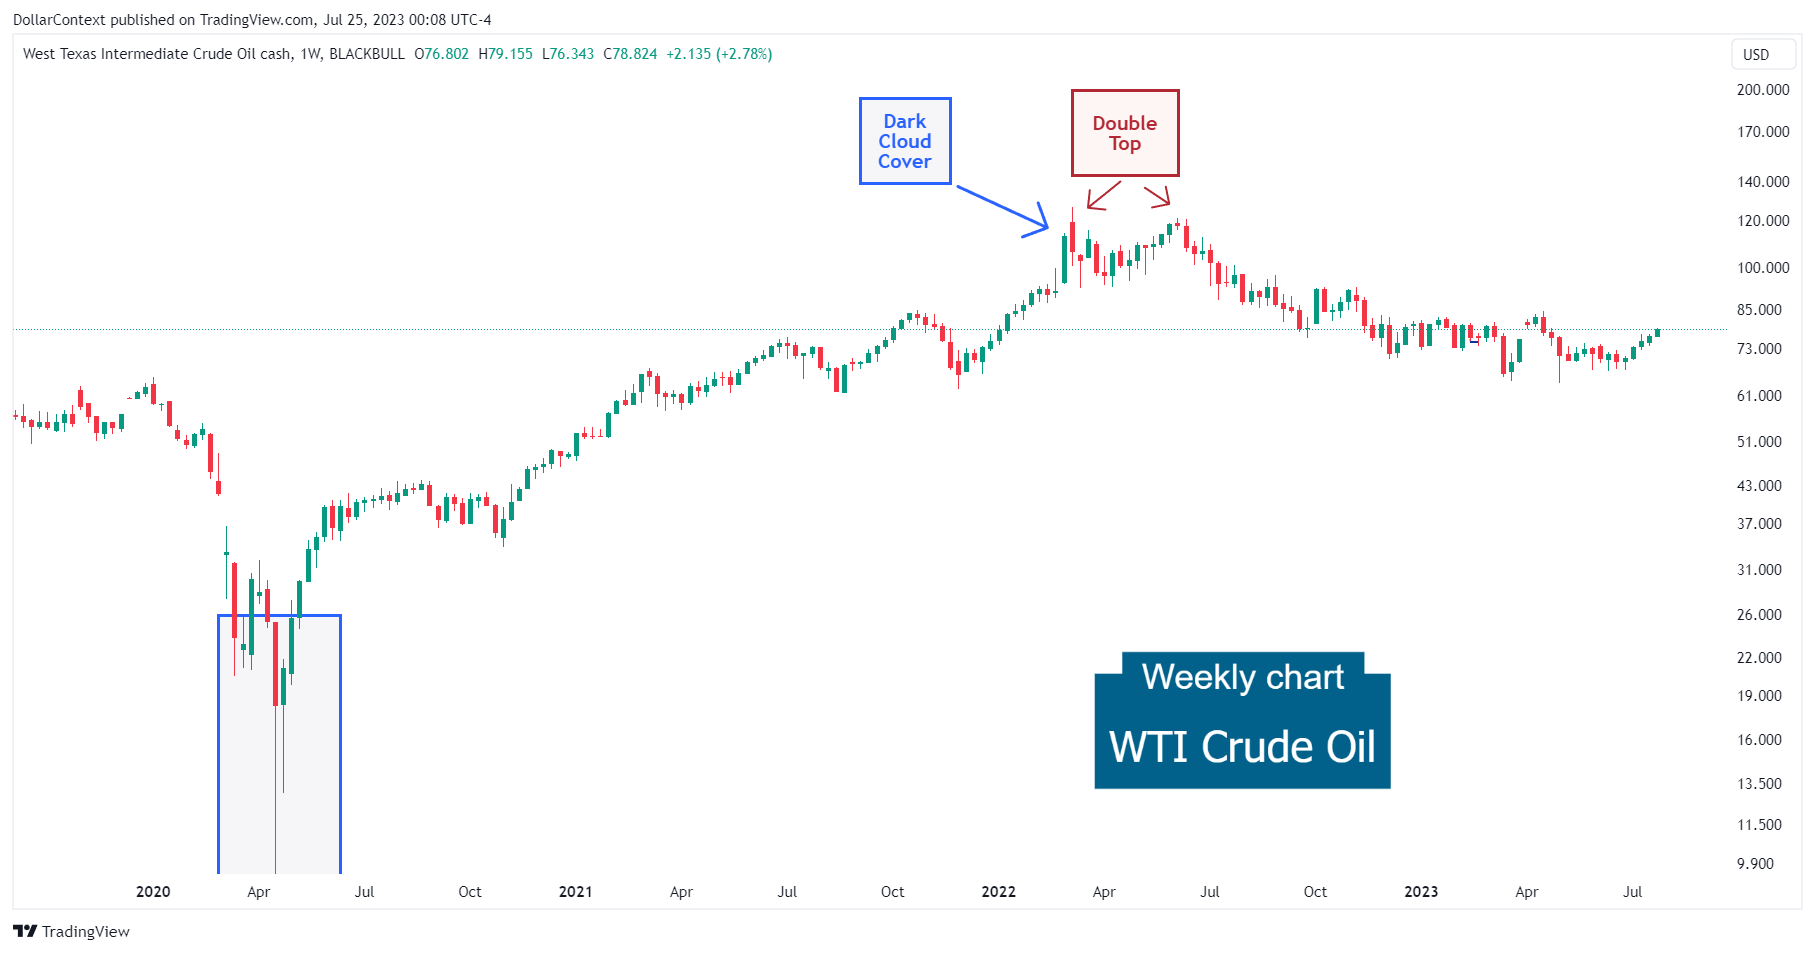
2. May 2020–May 2022: The Recovery
For nearly two years, oil prices have been displaying a persistent upward trend. The upturn was characterized by:
- A period of consistent upward momentum, with only minor pullbacks or corrections along the way.
- The lack of profound corrections indicates a strong and steady demand for the asset, signaling investor confidence and favorable underlying fundamental factors after the pandemic.
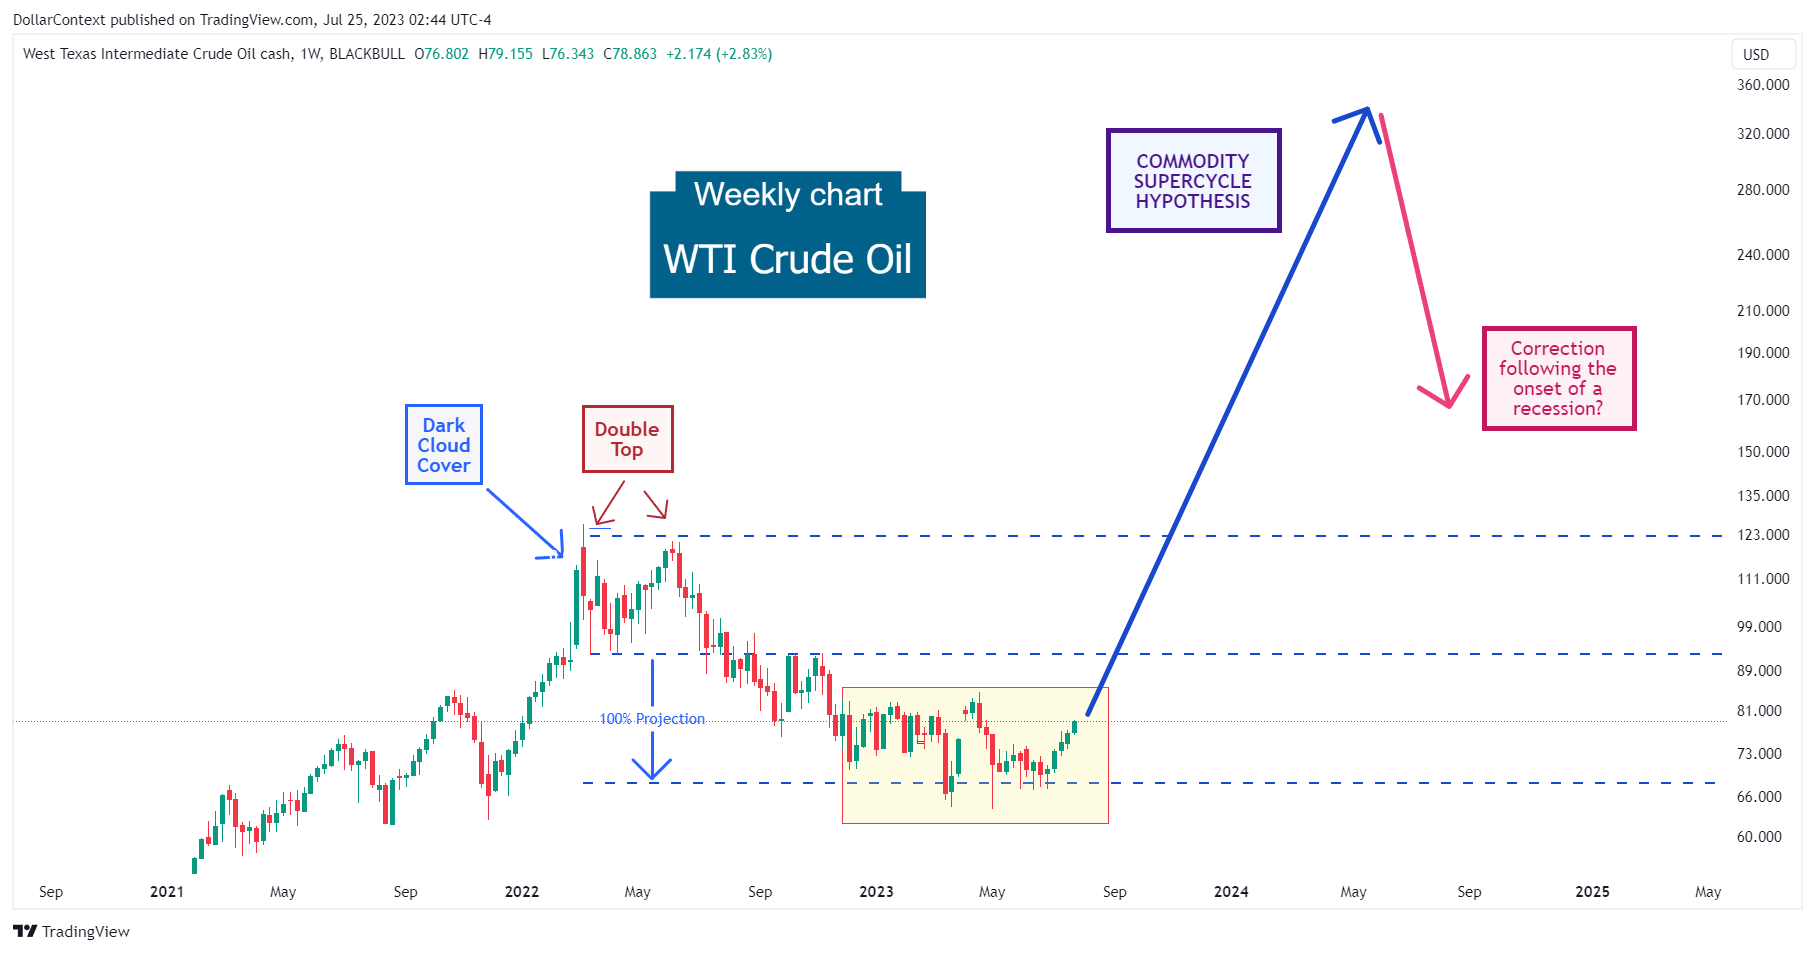
Note how the upward trajectory ends via:
- An irregular dark cloud cover formation (candlestick analysis), and
- A double top (conventional technical analysis)
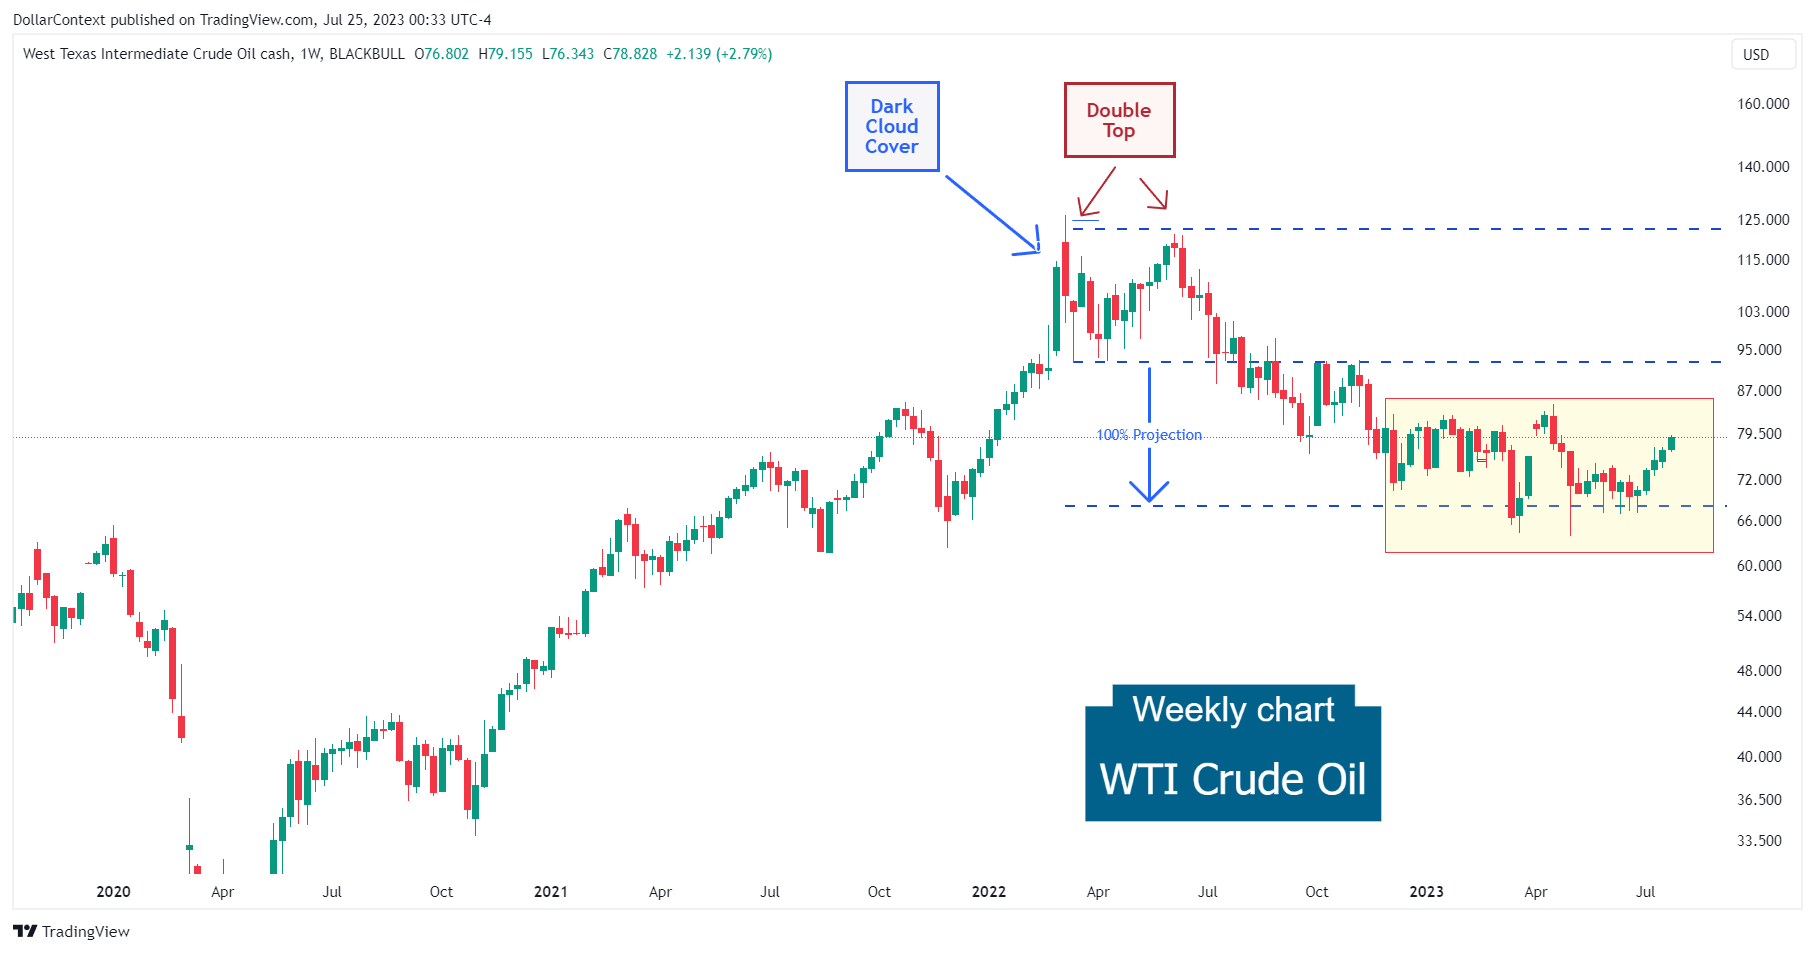
3. Since June 2022
Following the confirmation of the trend reversal and hitting the double top target (100% double-top projection added to the level of breakout), WTI pauses and embarks on a sideways movement, a pattern that continues to this day.
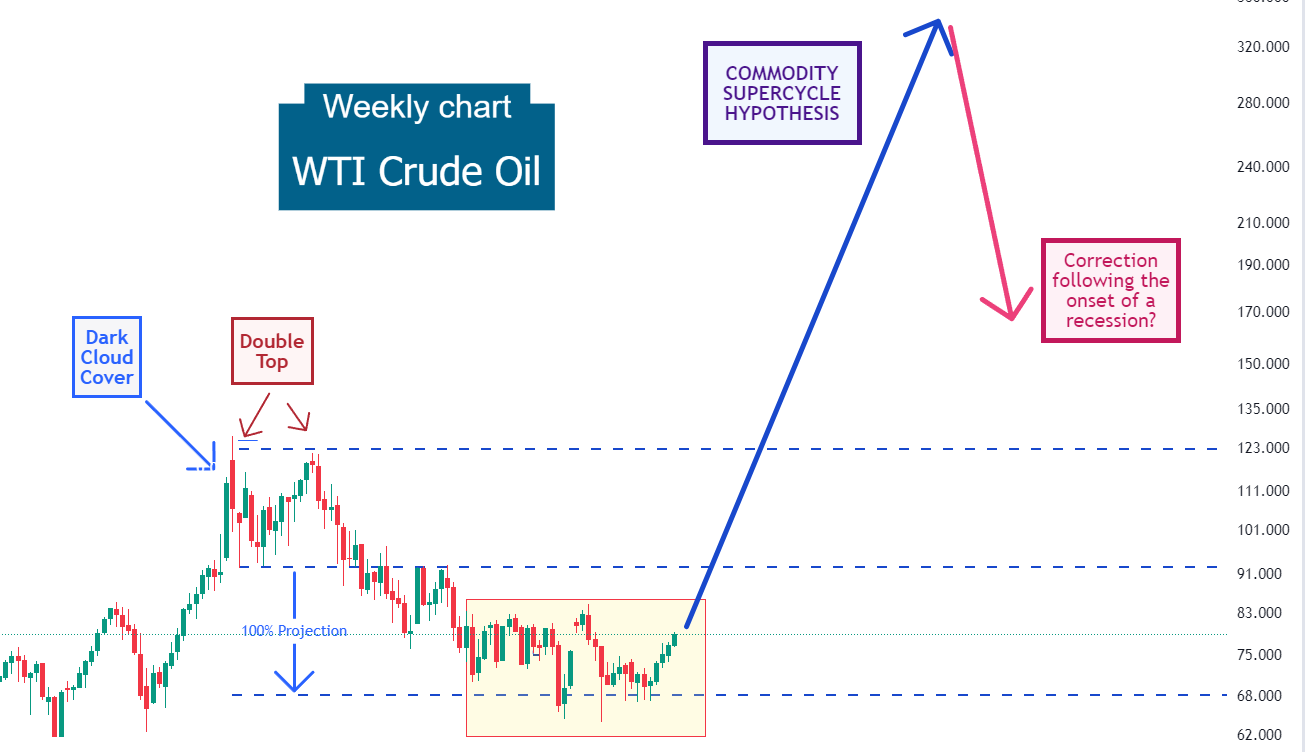
4. Outlook for the second half of 2023 through 2024
Starting in 2020, the commodity market may have entered a supercycle phase. Such supercycles usually extend beyond 8 years and lead to substantial price escalations. If this theory is valid, then WTI would have been in a phase of correction since June 2022, poised to continue its upward trend over a more extended period.
However, considering our anticipation of an economic downturn sometime in the coming year, we might see a sharp correction in 2024, potentially causing a significant price correction.
Observe how oil typically undergoes significant downturns during periods of recession (highlighted by gray-shaded areas on the chart below).
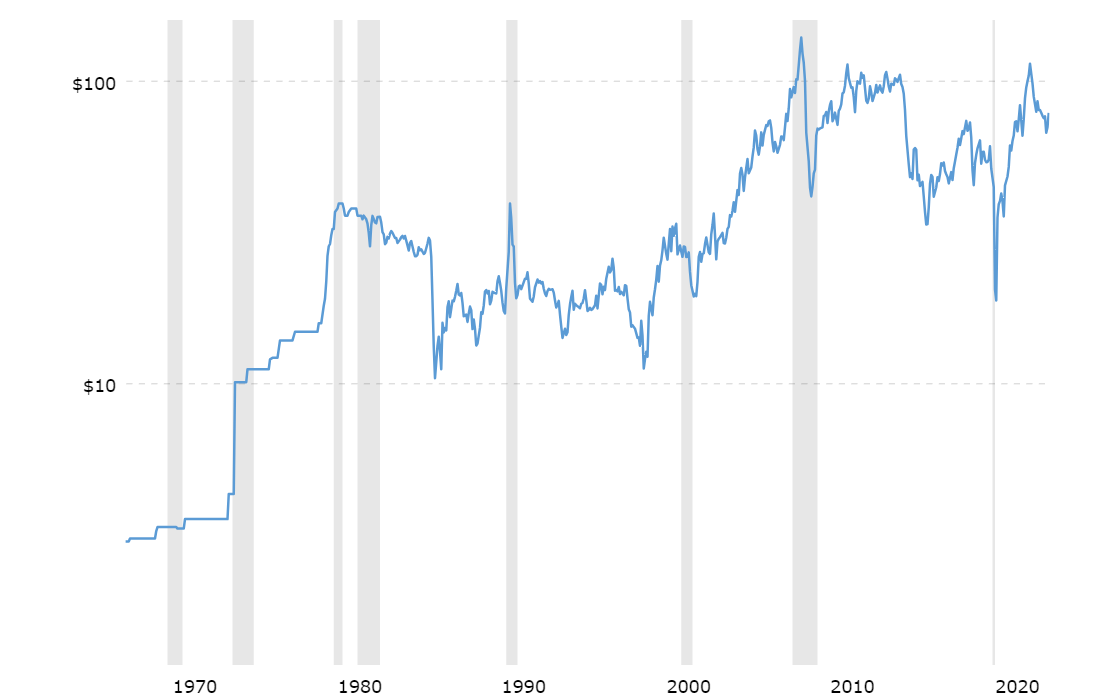
Source: Macrotrends
Obviously, this scenario might not materialize. However, we consider it a plausible outcome. Commodity supercycles often follow episodes of intense collapses, much like the one witnessed in 2020.


