
Commodity Prices: Evolution and Outlook
We discuss the trends and forces that have influenced the commodity market's path and offer our perspective on future shifts in this market.


In this article, we will discuss the trends and forces that have influenced the commodity market's path, including energy, metals, and agricultural commodities. We'll conclude by offering our perspective on potential future shifts in this sector.
1. First Half of 2020: The Pandemic's Collapse
During the initial months of 2020, the commodity market experienced dramatic plunges, mainly due to the pandemic and its ripple effects on the global economy. These elements were chiefly responsible for the initial slump in the prices of many such commodities:
- COVID-19 Pandemic: In the early months of 2020, the swift global proliferation of COVID-19 prompted unparalleled lockdown protocols. Major economies enforced travel bans, quarantined vast segments of their populations, and halted significant portions of their commercial activities. Sectors such as industry, transportation, and aviation faced severe repercussions. Consequently, the metal and energy sectors bore the brunt of this situation.
- Storage Challenges: The significant decline in demand occasionally resulted in storage constraints, especially within the energy sector, which subsequently influenced prices.
- Economic Uncertainties: The prolonged economic forecast appeared bleak because of the potential enduring effects of the pandemic. This reduction in economic activity further curtailed hopes for a rebound in commodity demand.
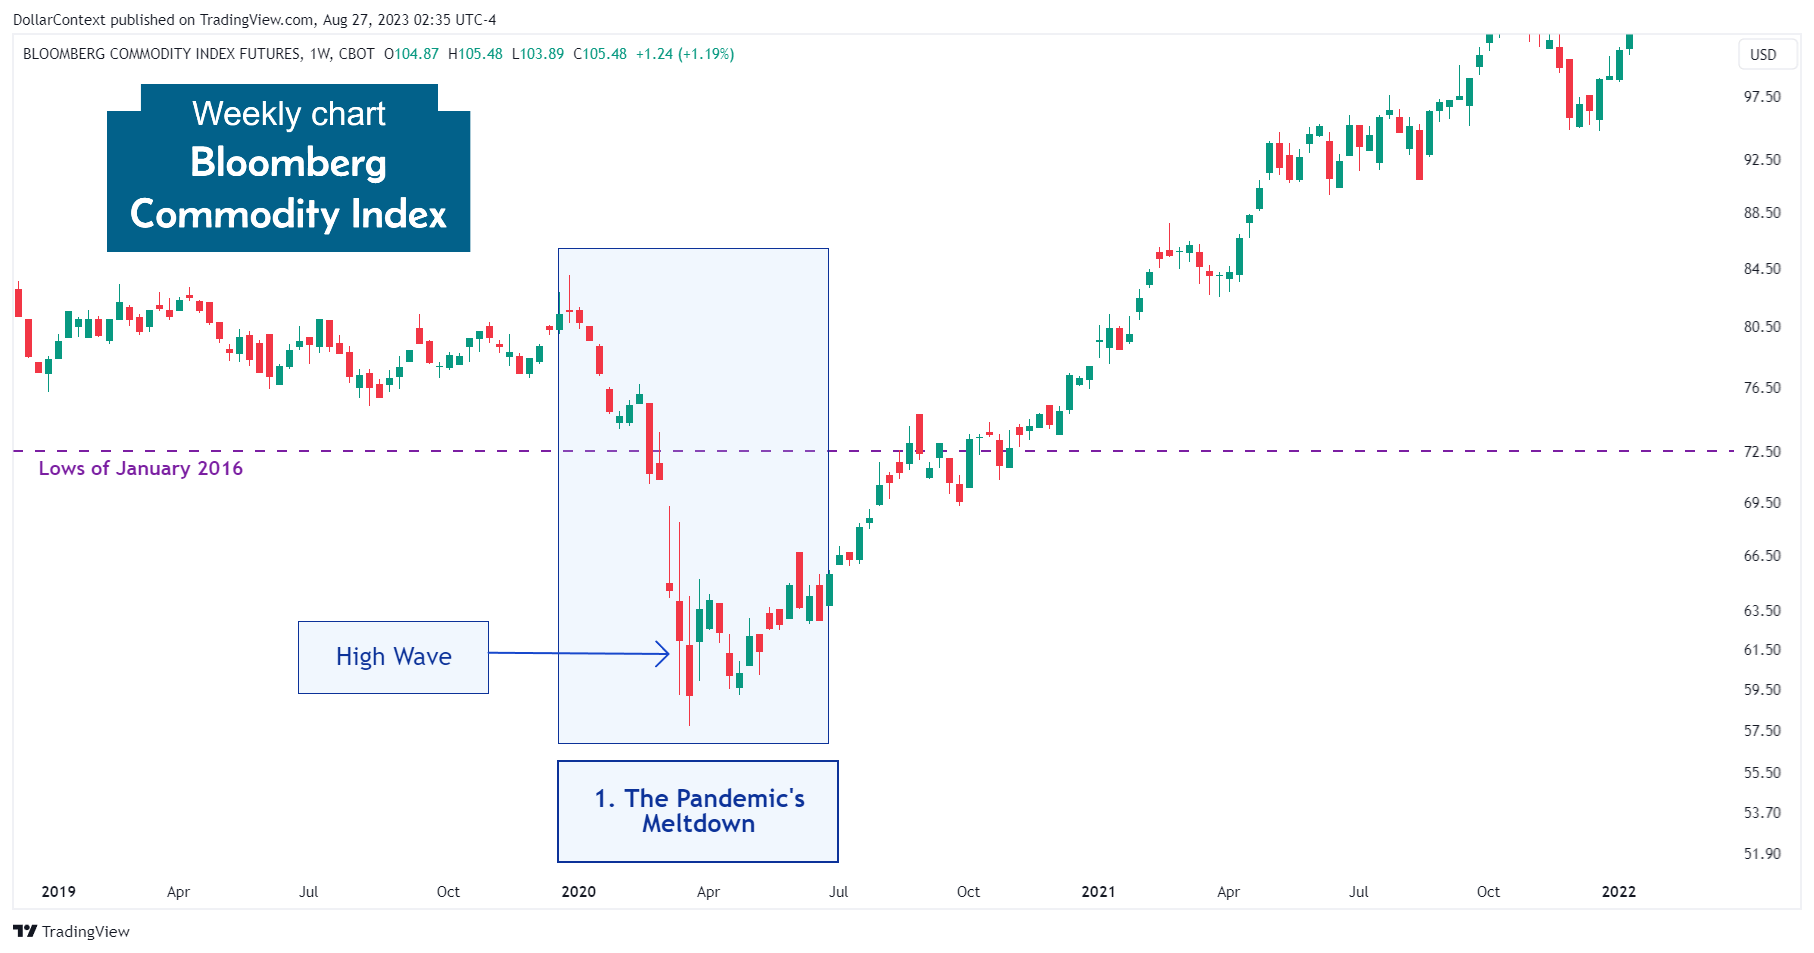
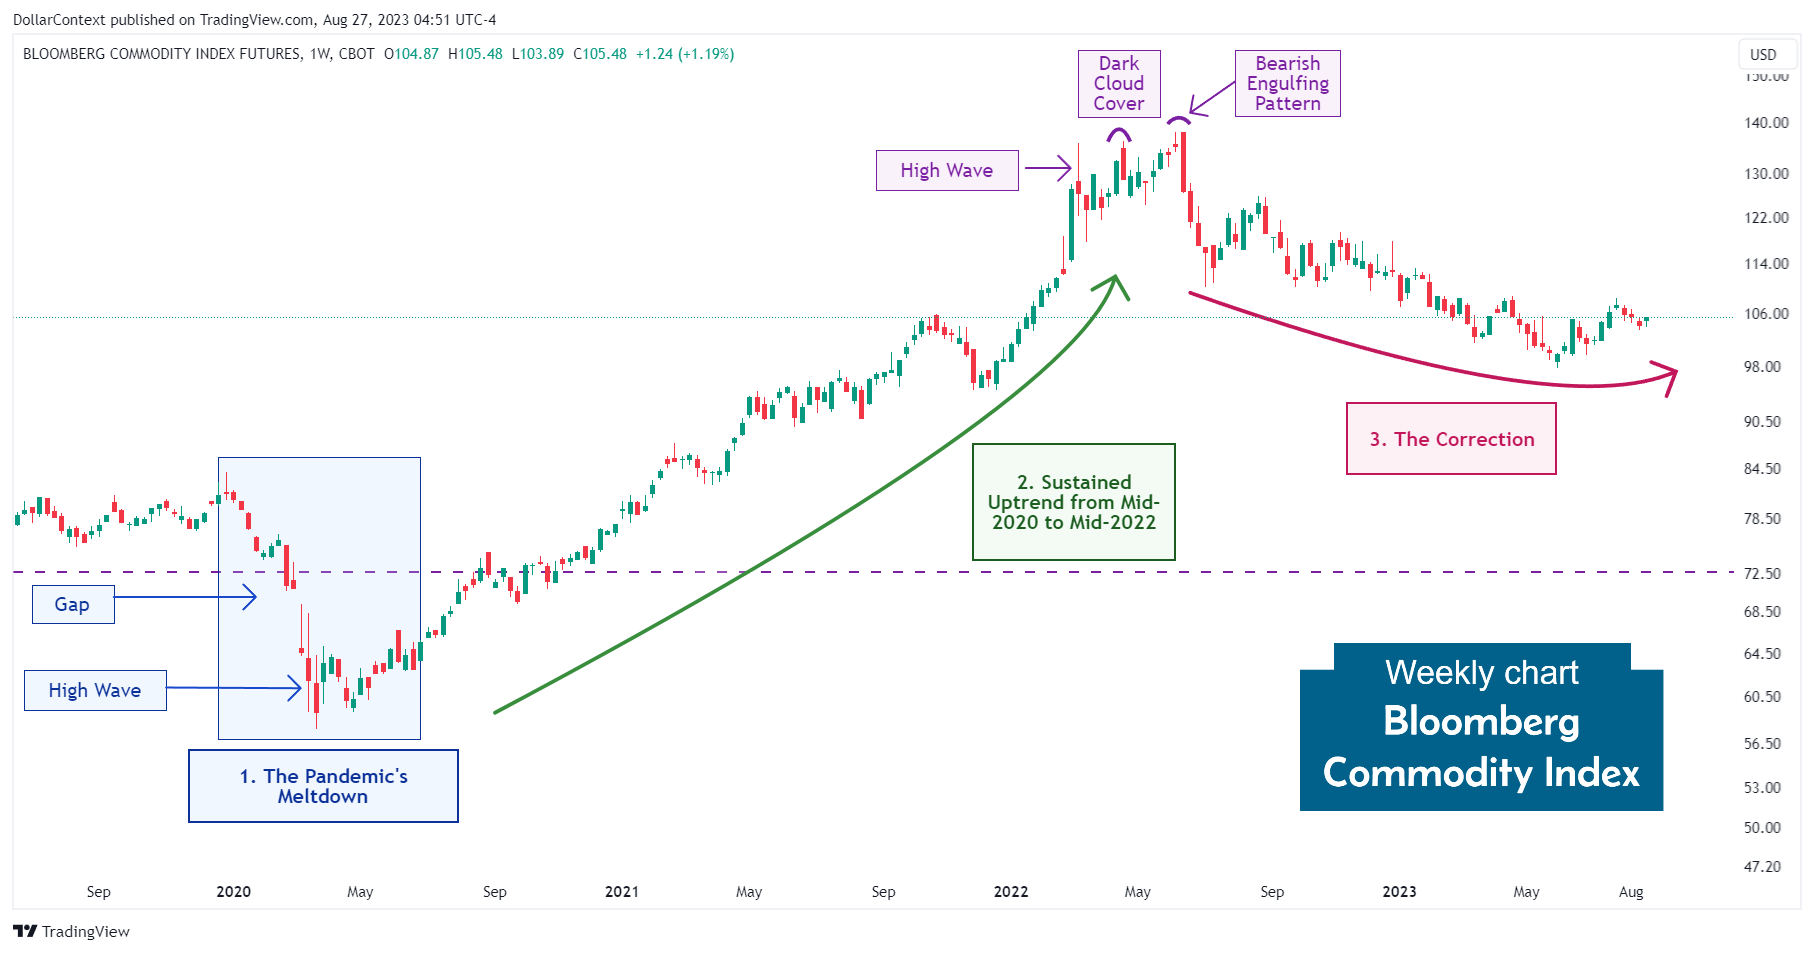
Observe how the Bloomberg Commodity Index displayed an important gap down in March, breaching the previous historical support established in January 2016.
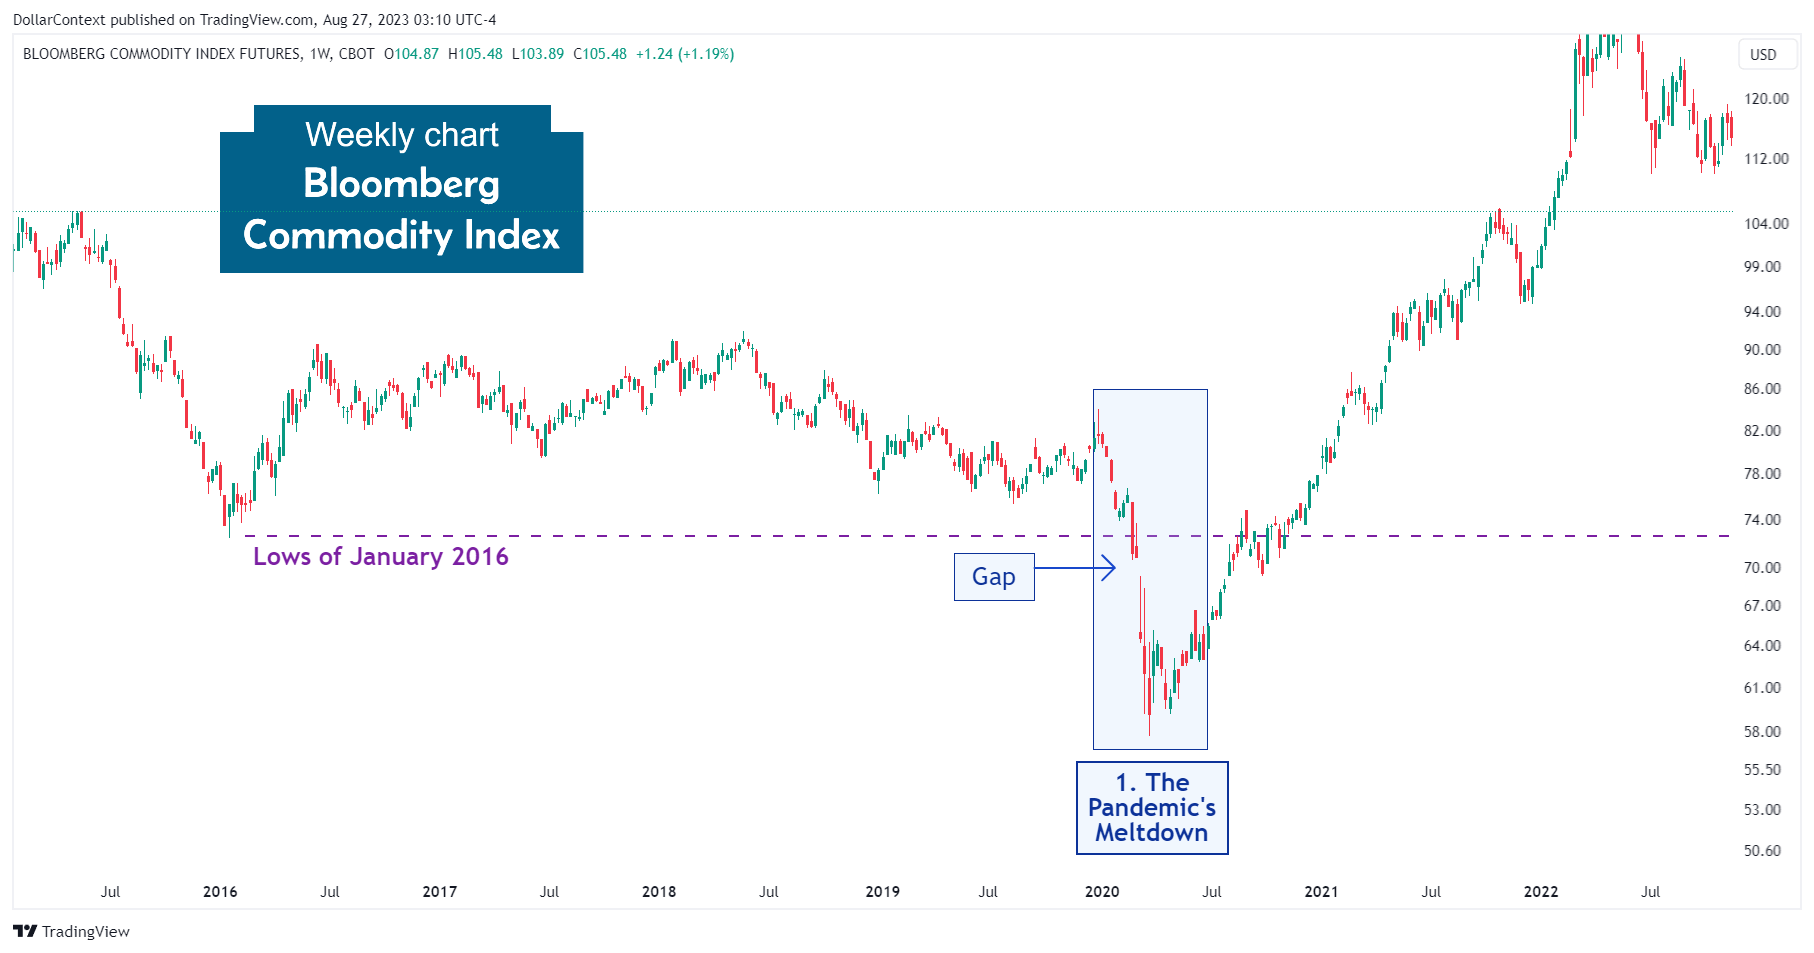
From a candlestick analysis perspective, a closer examination of the chart reveals that the decline essentially culminated in a high wave candle.
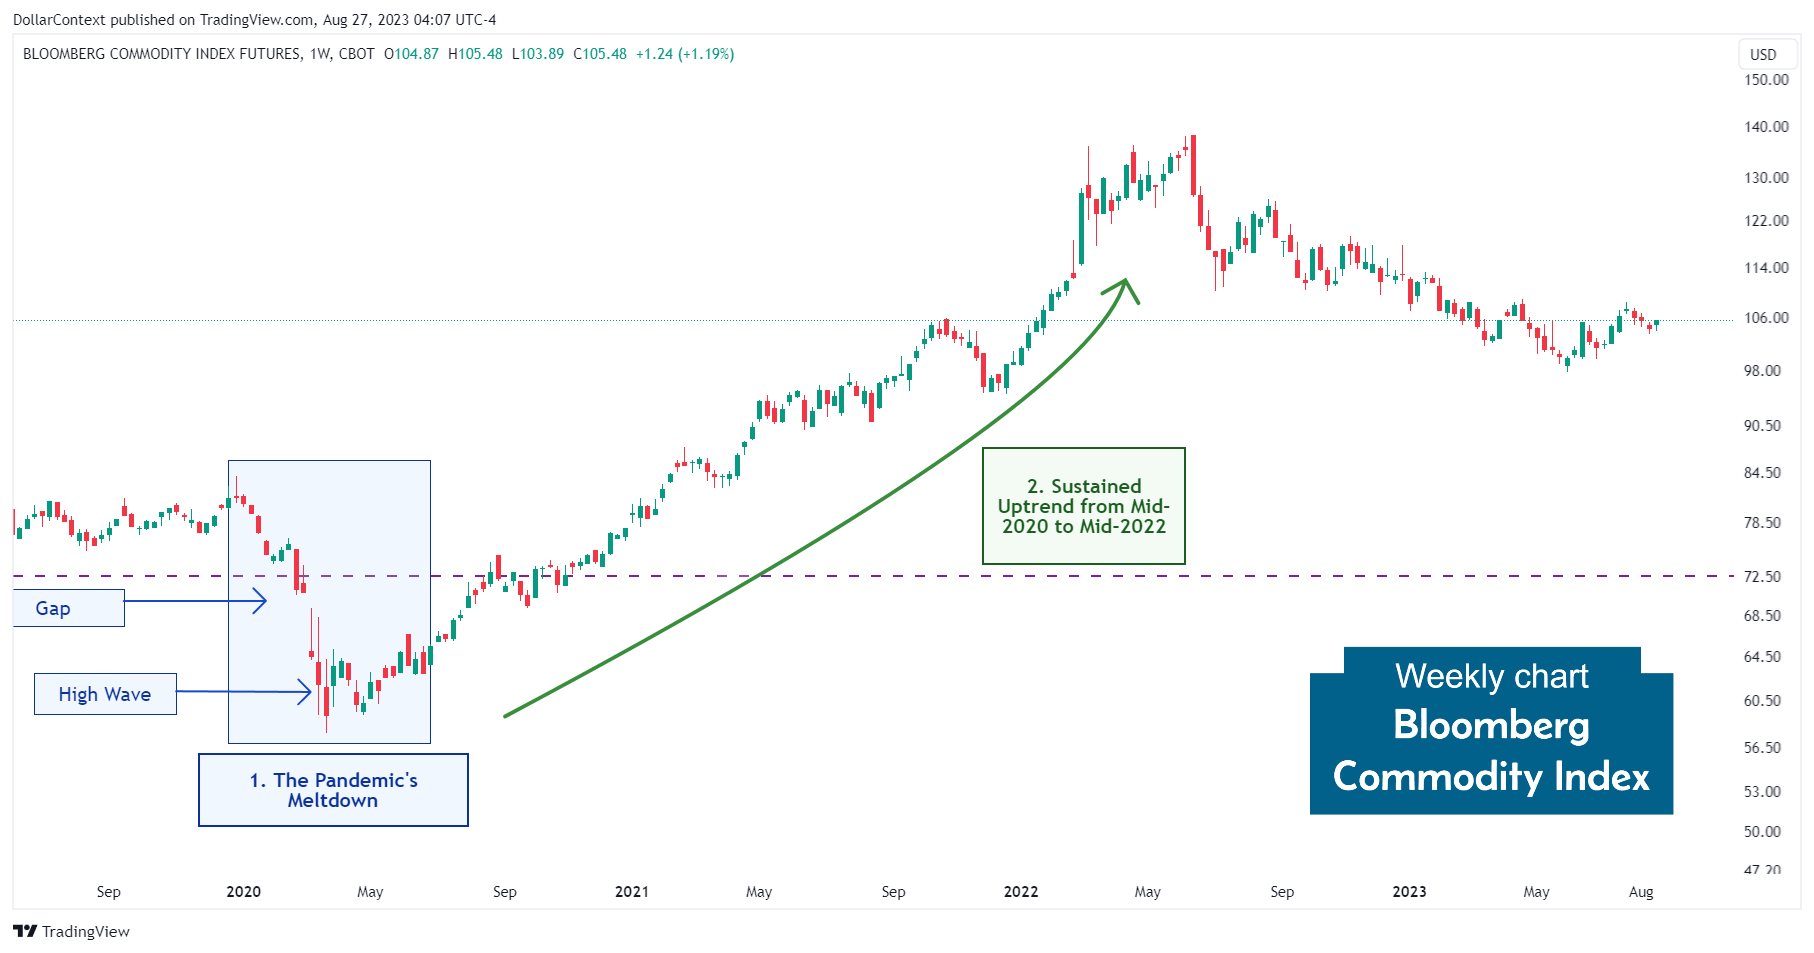
2. From Mid-2020 to Mid-2022: The Sustained Upward Momentum
After the initial decline in prices, most commodity assets quickly recovered, setting in motion a robust and sustained upward trend. Three primary factors drove this change in market sentiment:
- Stimulus Measures Promoted by Major Central Banks: During the initial stages of the pandemic, the Federal Reserve and other leading central banks took decisive actions to stabilize the economy. They injected significant liquidity into the financial system and introduced stimulus measures. These steps were designed to alleviate the economic stress caused by the pandemic and ensure the smooth functioning of financial markets. The interventions played a crucial role in bolstering confidence and preventing a deeper economic downturn.
- Dollar Depreciation: Throughout much of this period, the dollar index saw a decrease. As most commodities are denominated in dollars, this drop contributed to pushing commodity prices upward.
- Economic Recovery After the Pandemic: Following the most challenging stages of the pandemic, economic recovery largely surpassed common forecasts, boosting global economic activity and heightening demand for commodity assets.
- Supply Chain Disruptions: The pandemic led to supply chain interruptions across numerous sectors, resulting in price surges for various commodity assets.
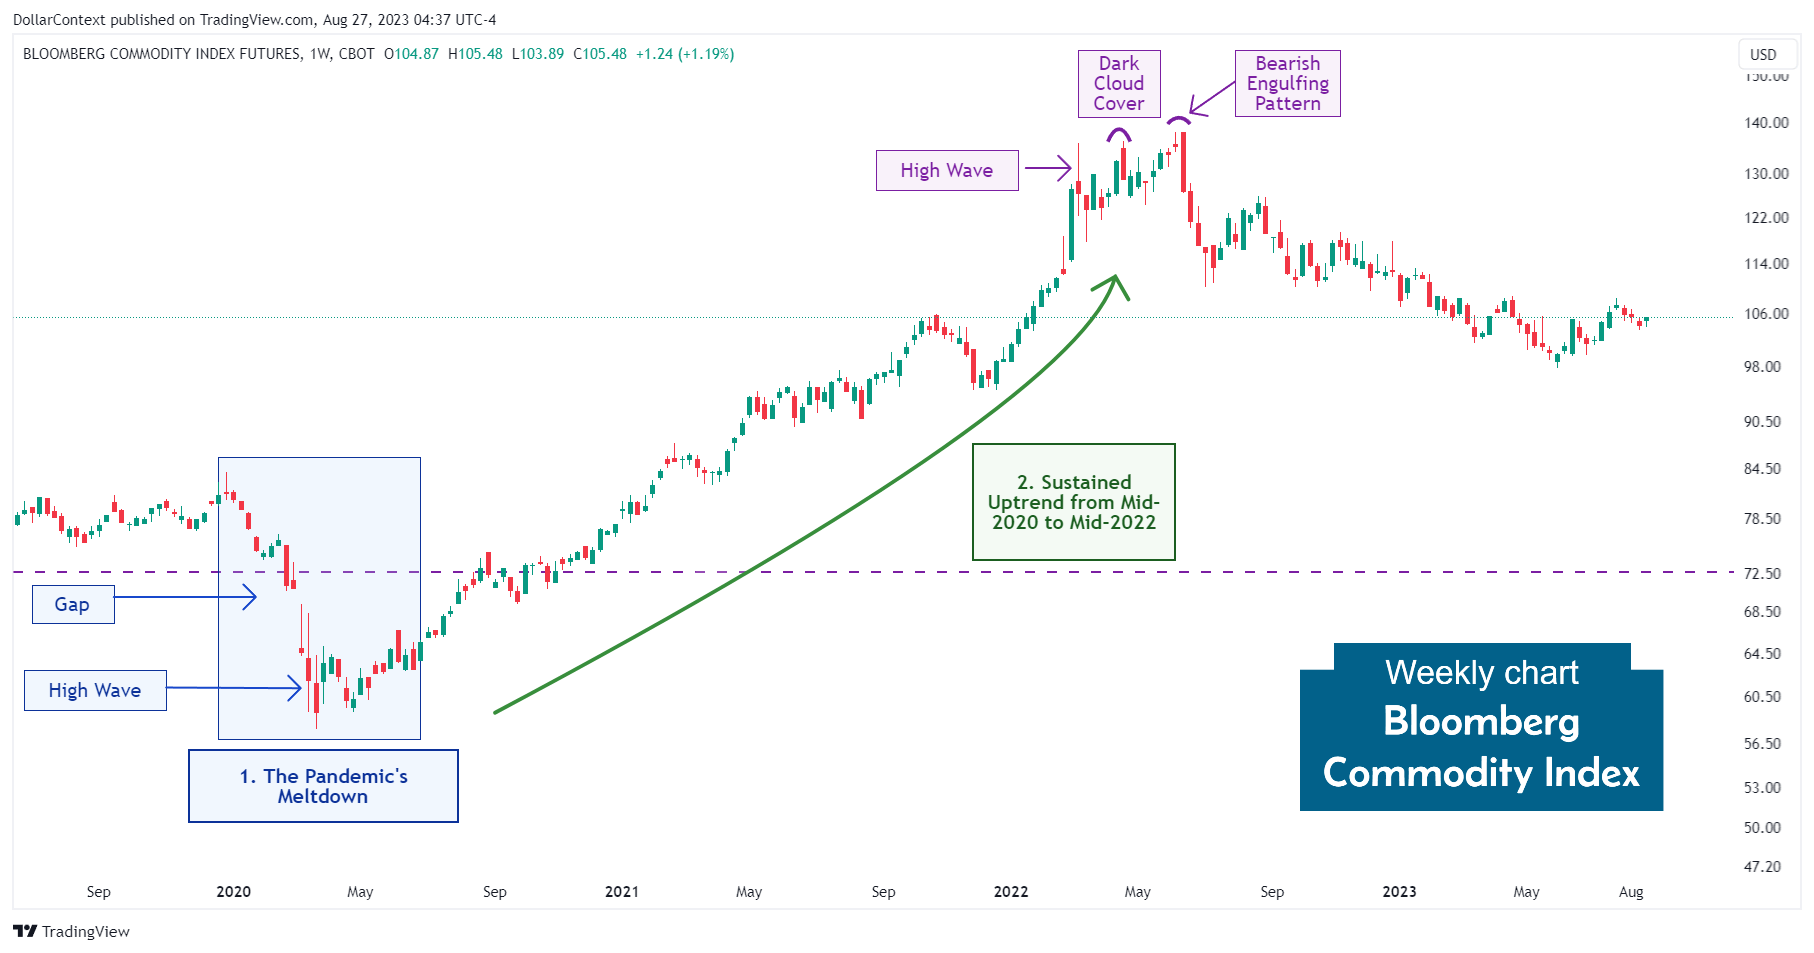
From a technical standpoint, several indicators surfaced in mid-2022 pointing to a probable upcoming reversal. Specifically, the presence of a high wave candle, a dark cloud cover, and the bearish engulfing pattern in June all signaled a potential correction on the horizon.
3. From Mid-2022 Onward: The Extended Correction
Driven by the tighter policies of major central banks to tackle inflation and ensure economic stability, and further influenced by the ensuing appreciation of the dollar, the commodity market embarked on a prolonged correction that persists to this day.
4. Outlook for the Commodity Market in 2023 and 2024
In forecasting commodity prices for 2023 and 2024, we deem it crucial to consider the following factors:
- The Supercycle Theory: Starting in 2020, the commodity market might have embarked on what's commonly termed a supercycle. These cycles typically last for more than eight years and are marked by significant surges in global commodity prices. Should this view prove accurate, we can anticipate a consistent upward trajectory for commodity prices in the medium term.
- The Recession Scenario: With the Federal Reserve's assertive stance on interest rate hikes and worrying signs from key indicators like the inverted yield curve, the chances of an economic downturn by 2024 seem to be growing. Traditionally, as a global recession takes shape, the commodity market faces downward price pressures.


