
Outlook for Soybean Prices
From 2020 onwards, the commodity market, encompassing soybeans and other agricultural products, might have embarked on a supercycle period.


In this post, we'll explore the trends and factors that have influenced the trajectory of soybean prices since 2020. As we wrap up, we'll offer our insights into the possible future direction of this market.
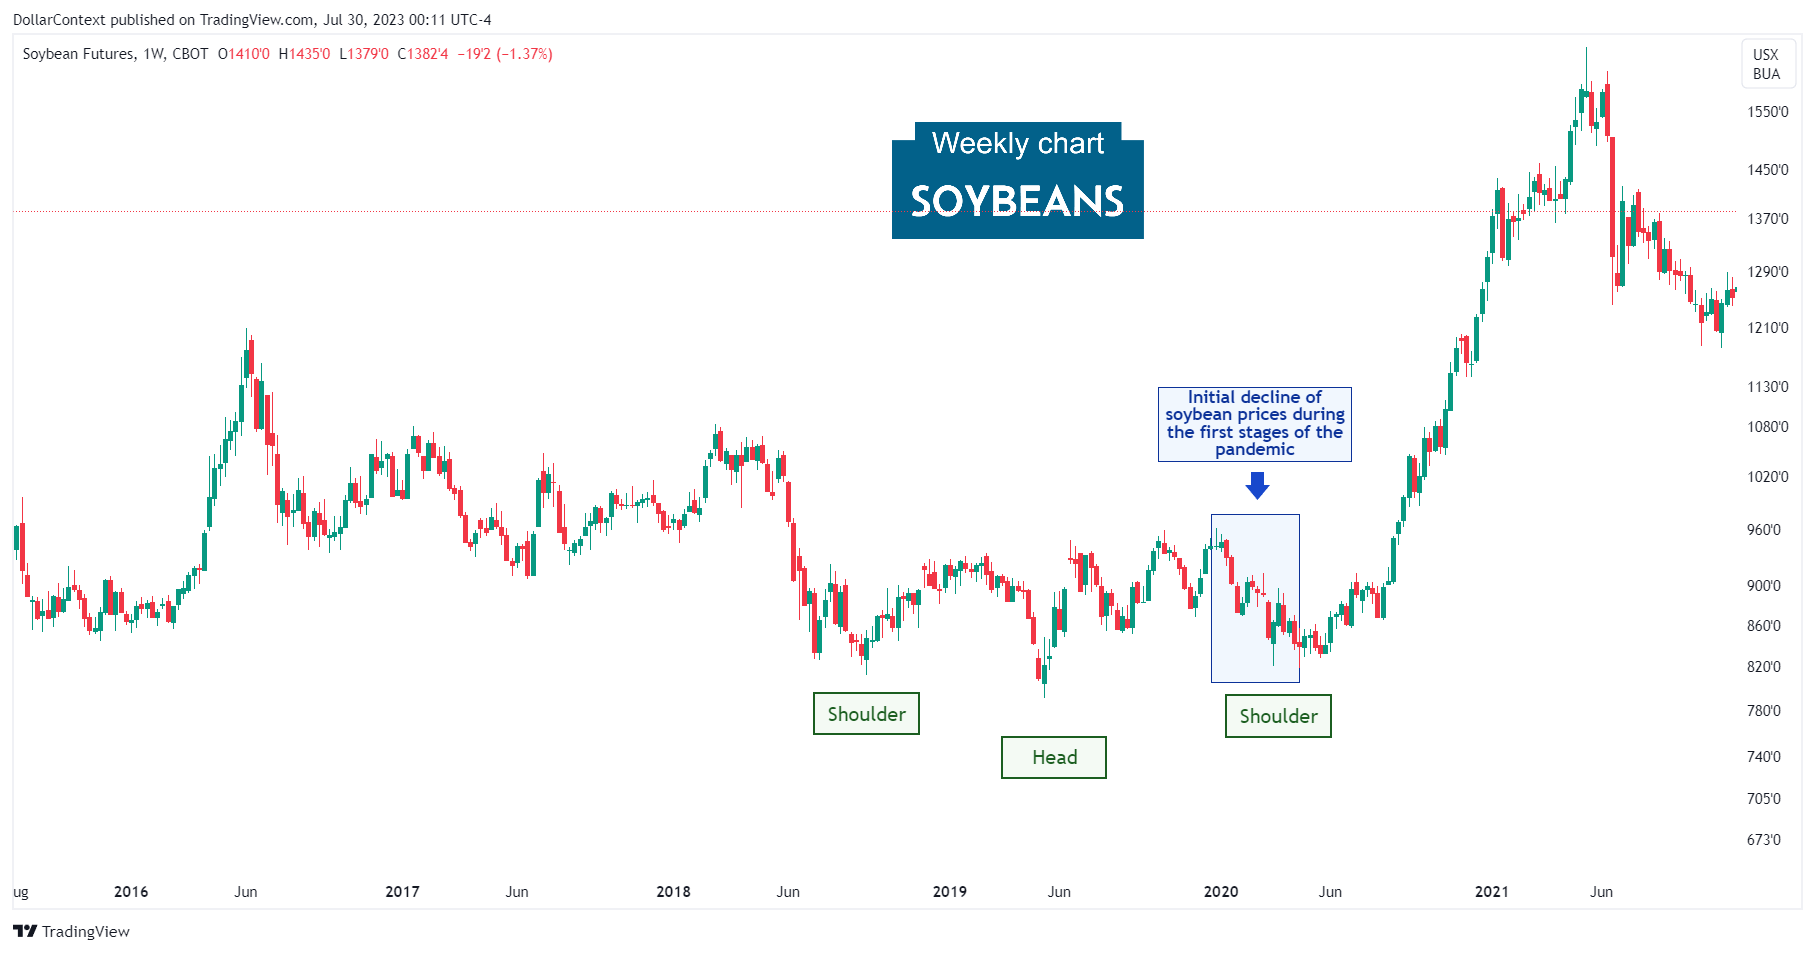
1. January 2020–April 2020: The Pandemic Impact
The initial stage of the pandemic had a profound impact on the soybean market. Due to the abrupt halt of economic activity, supply chains were significantly disrupted, leading to a considerable fluctuation in prices. The uncertainty created by the pandemic initially triggered a downward trend as both production and demand faced unexpected challenges.
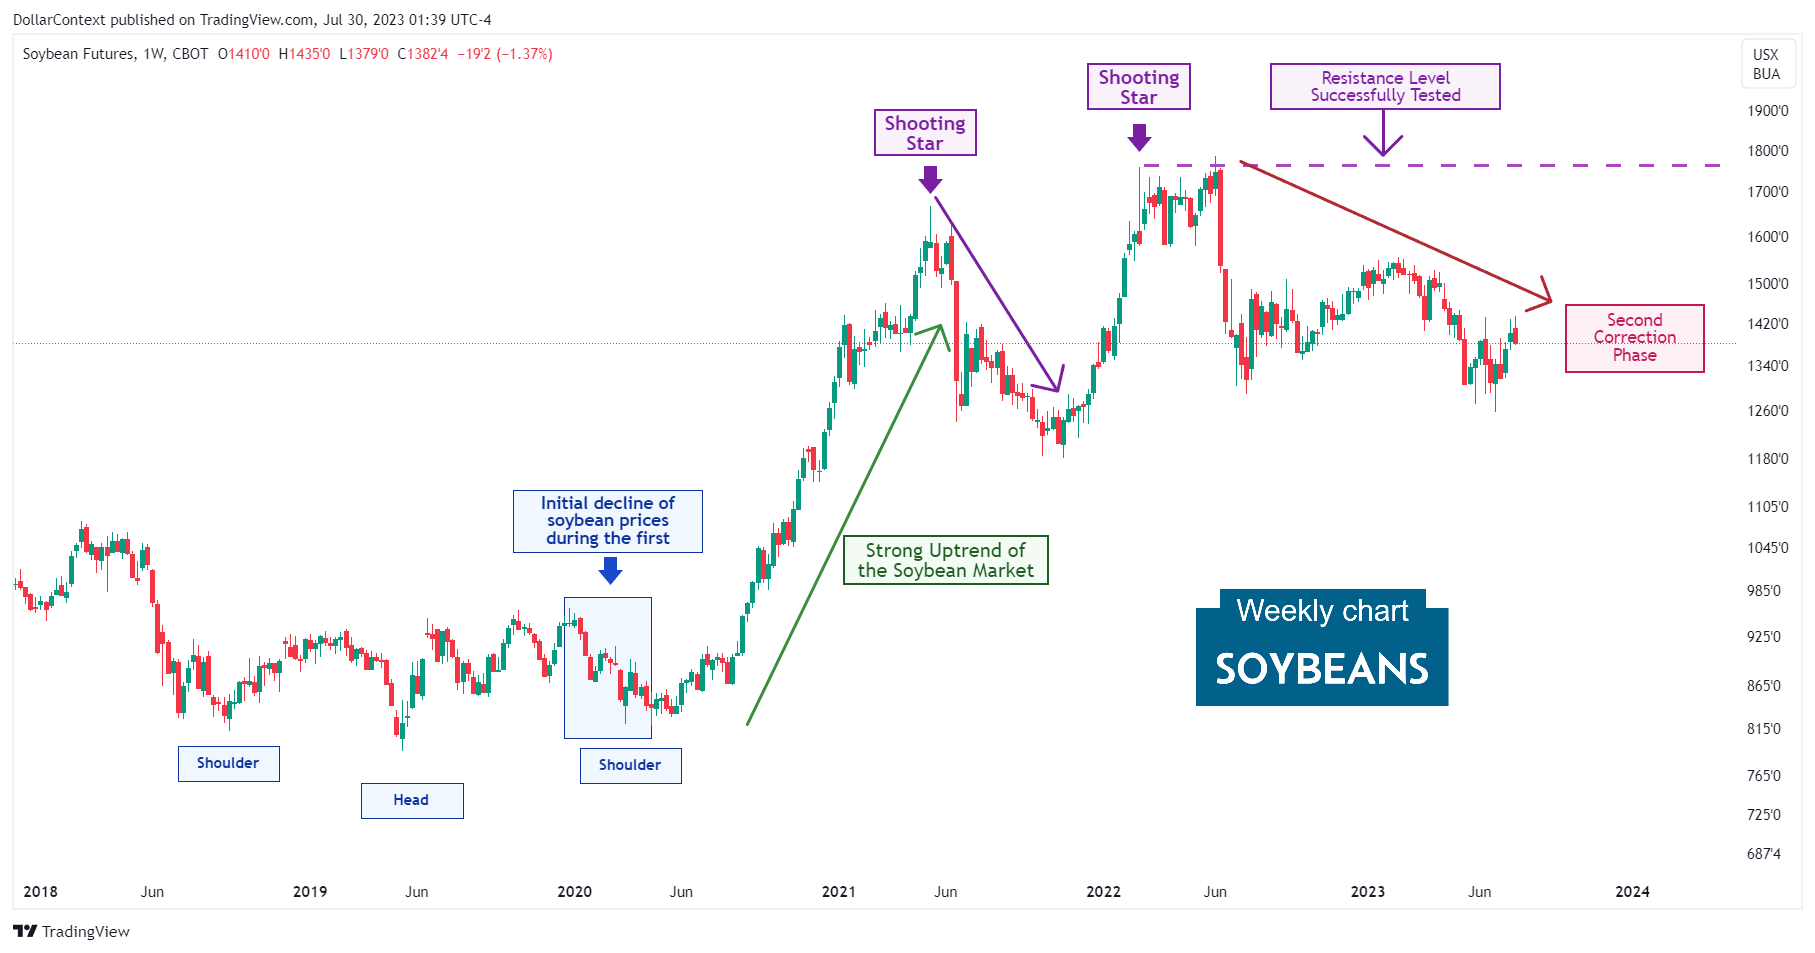
However, the decline in price, indicated by the blue shaded area on the graph, wasn't as extreme as seen in other non-agricultural commodities. Interestingly, the soybean price displayed a 'head and shoulders' pattern, which was subsequently validated.
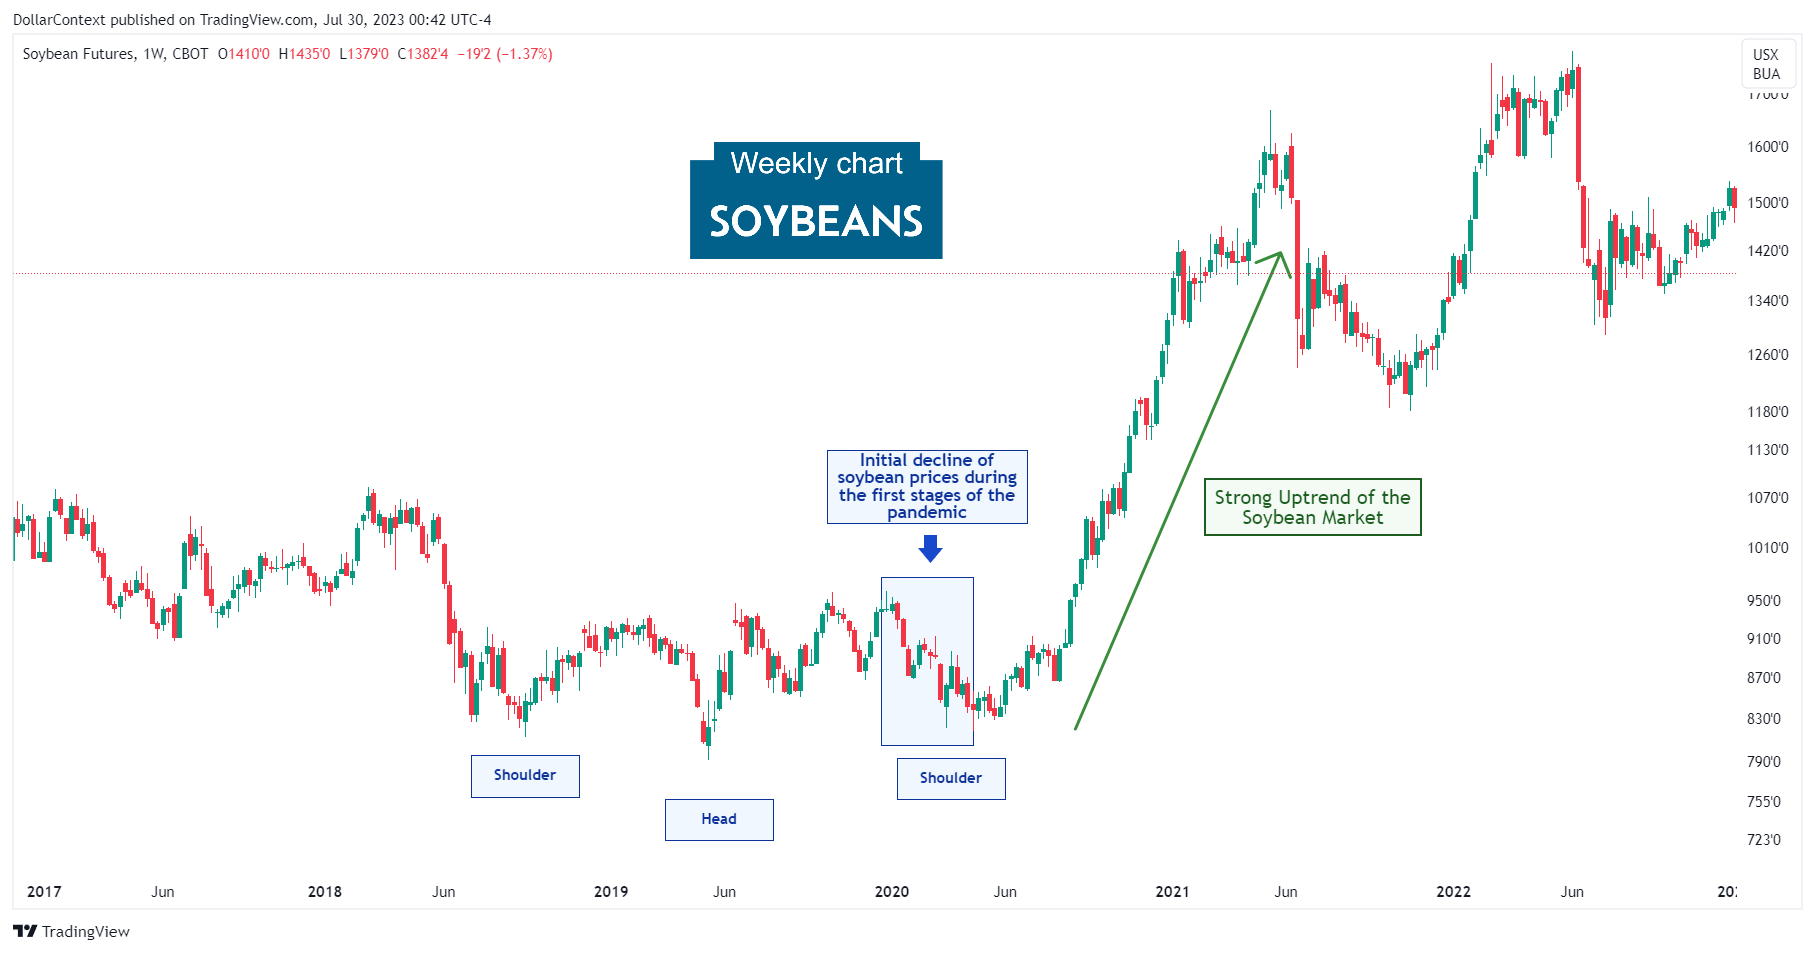
2. May 2020–May 2021: The Brisk and Continuous Surge
Several factors contributed to the rise in soybean prices from May 2020 to May 2021.
- Supply Chain Disruptions: The COVID-19 pandemic disrupted global supply chains, leading to a decrease in the availability of soybeans. This affected both the production and transport of the commodity.
- Increased Demand from China: During this period, China significantly increased its import of soybeans. As the world's largest consumer of the commodity, changes in Chinese demand significantly affect global prices.
- Weather Factors: Adverse weather conditions in key producing countries, such as the US and Brazil, had an impact on crop yields.
- USD Depreciation: The value of the US dollar declined during this period. Since commodities, like soybeans, are priced in dollars, a weaker dollar typically leads to higher prices.
3. May 2021–October 2021: The Correction
Observe that the initial peak of this upward trend was shaped by a conventional shooting star (candlestick technical analysis), indicative of a bearish candlestick signal. This was quickly followed by a significant drop. It's equally crucial to note that this pattern materialized at a pivotal resistance point established in 2008 (not depicted in the chart.)
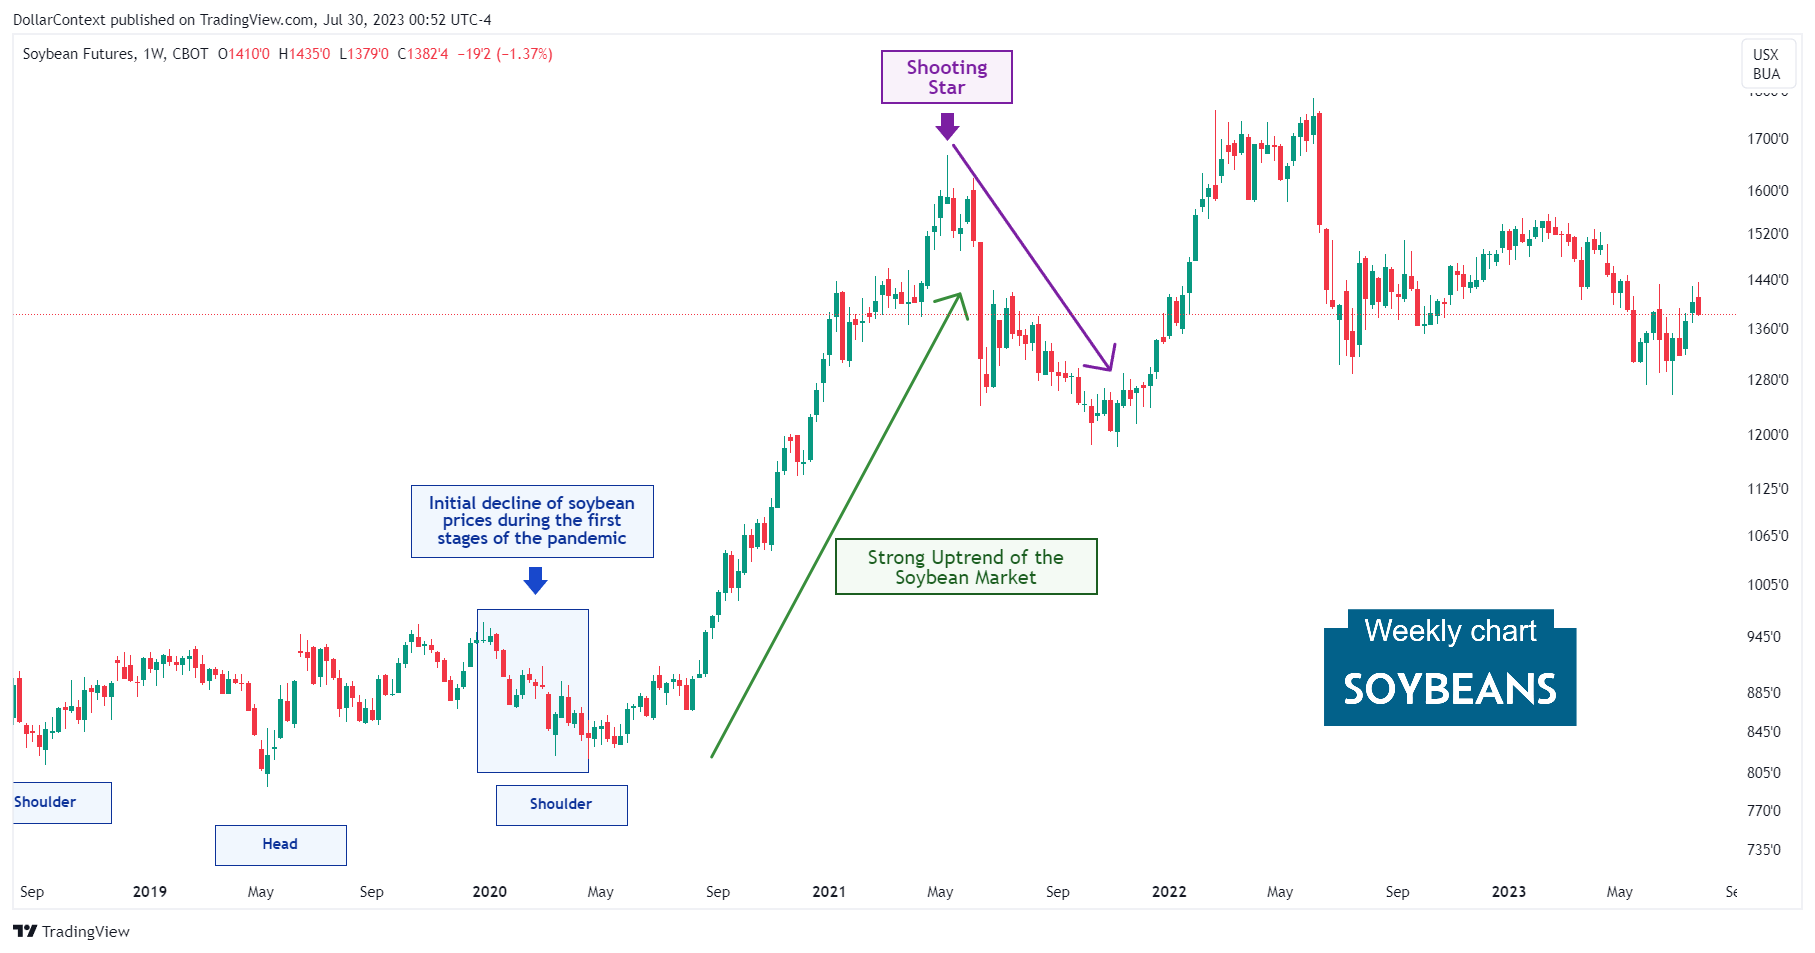
Fundamentally, a number of factors contributed to this correction, including:
- Improved Weather Conditions: After a period of unfavorable weather affecting crop yield, conditions may have improved in key soybean-producing countries, leading to increased production and a consequent easing of prices.
- Easing of Supply Chain Disruptions: As countries adapted to the COVID-19 pandemic, the earlier supply chain disruptions might have started to ease, improving the distribution and availability of soybeans.
- Fluctuation in Chinese Demand: China, as the major soybean consumer, reduced its import volume during this period due to any internal policy changes or demand fluctuations.
- Dollar Appreciation: The U.S. dollar strengthened during this period.
4. November 2021–June 2022: The Second Top
During this phase, the price exhibits a rally that, interestingly, halts after another shooting star formed just above the prior one. Once again, this takes place at a historically significant resistance zone previously established in 2008 and reaffirmed in 2012.
Note how the second shooting star created a resistance level that was successfully tested in June 2022.
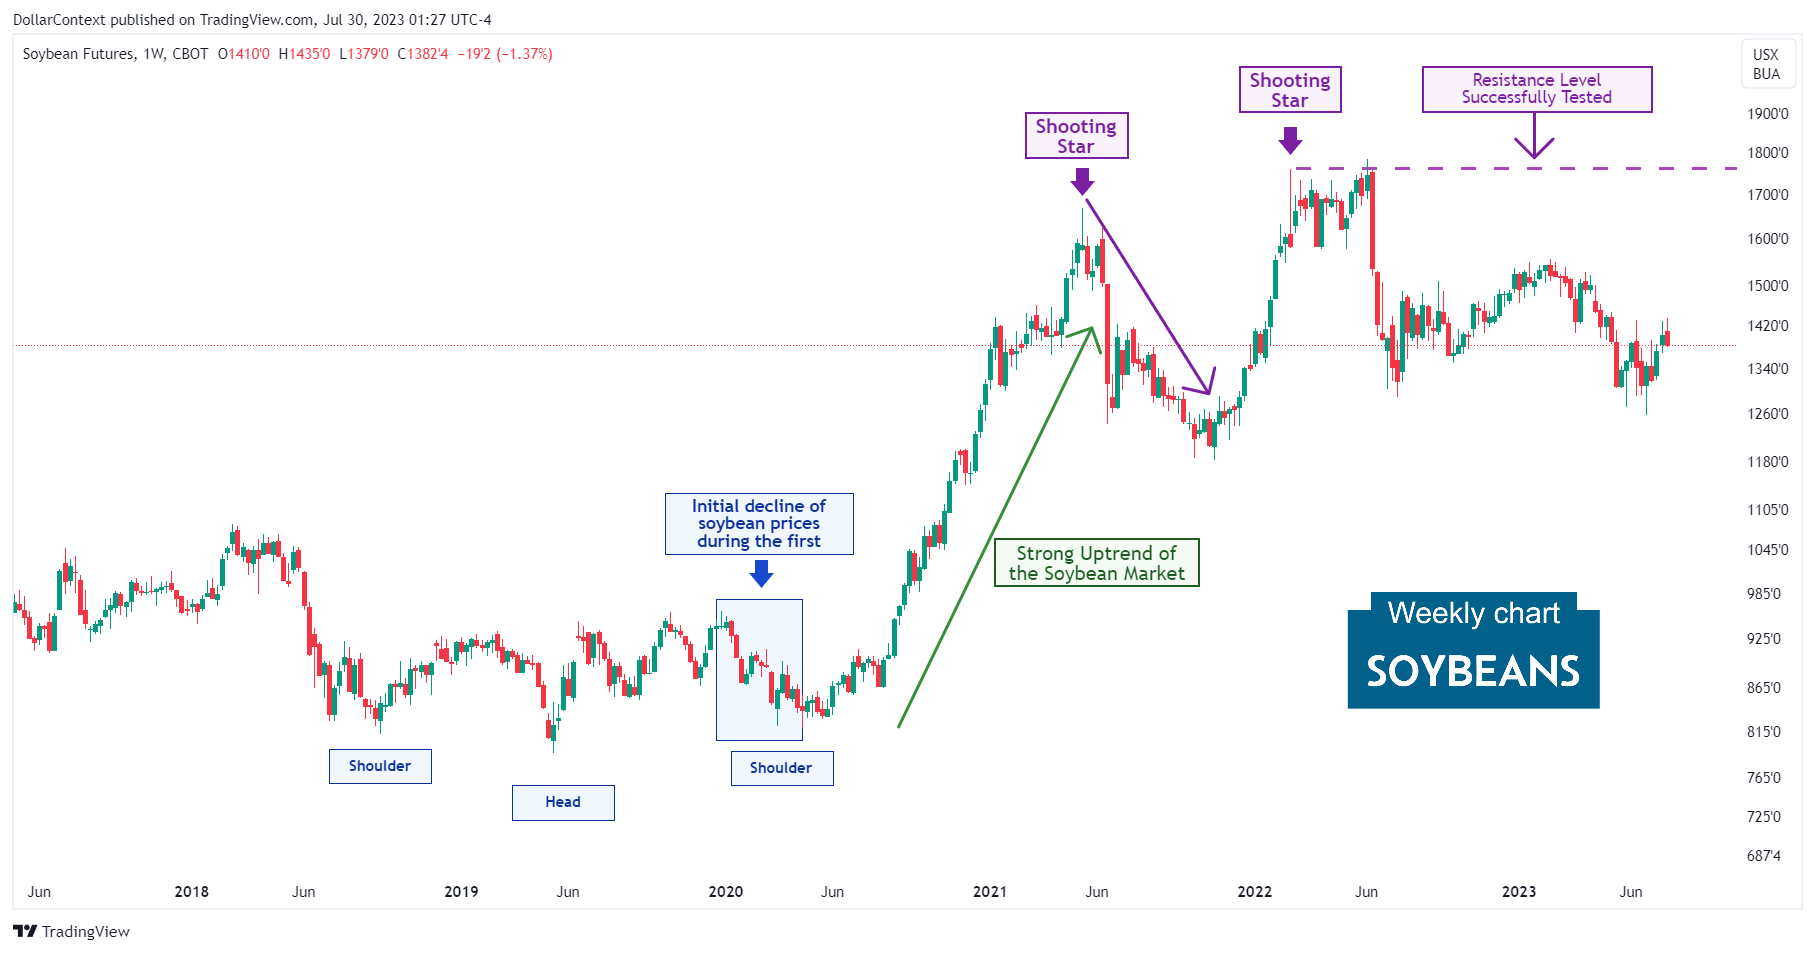
5. Since June 2022: The Second Correction
Like many other commodity prices, soybean prices have been undergoing an extended correction phase since June 2022 that has persisted until now. The appreciating dollar has been a significant driving force in this trend.
6. Forecast for Late 2023 Through 2024
From 2020 onwards, the commodity market, encompassing soybeans and other agricultural products, might have embarked on a supercycle period. A commodity supercycle typically extends beyond 8 years and features a broad scope, meaning it isn't restricted to a small assortment of commodity assets. If this hypothesis proves accurate, then the soybean market would have been in a correction phase since June 2022.
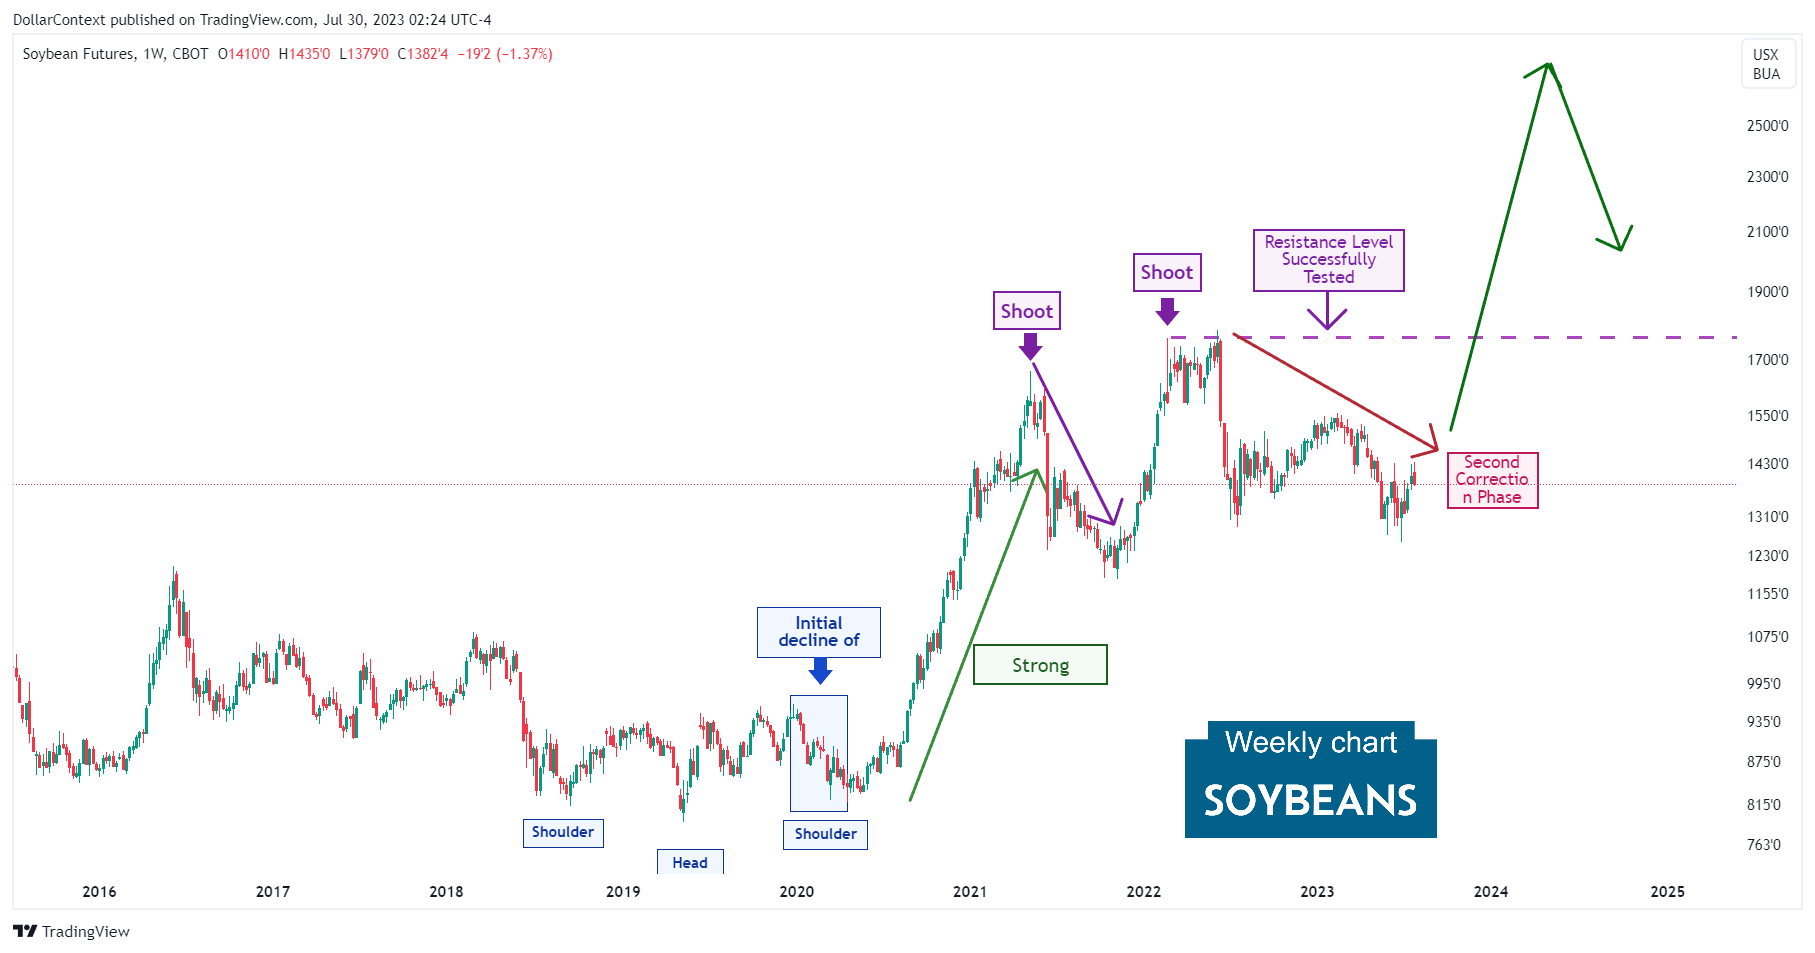
However, we contemplate a potential economic downturn around 2024, which could trigger a substantial correction in the overall commodity sector, including the soybean market. This chart illustrates the typical adverse effects of recessions, indicated by gray-shaded areas, on soybean prices.
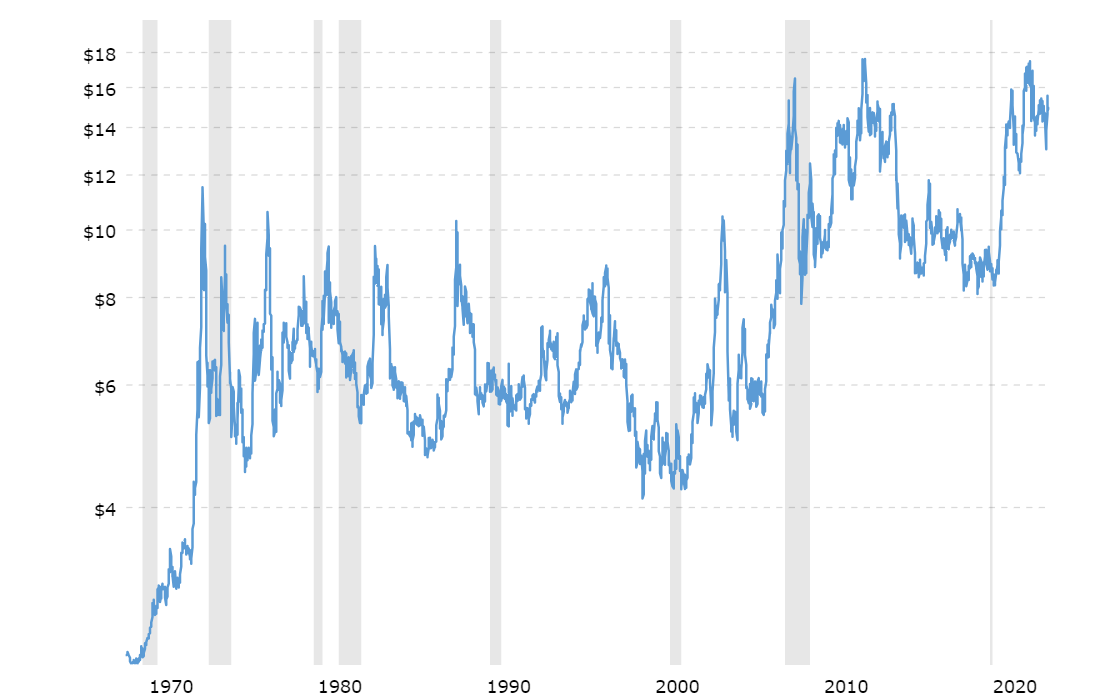
Source: Macrotrends


