
Sugar Prices: A Look Back and Ahead
We discuss the patterns that have shaped the trajectory of sugar prices since 2020 and provide our perspectives regarding the future of this market.


In this article, we'll discuss the shifts and patterns that have shaped the trajectory of sugar prices since 2020. To conclude, we'll provide our perspectives regarding the potential progression of this market in the future.
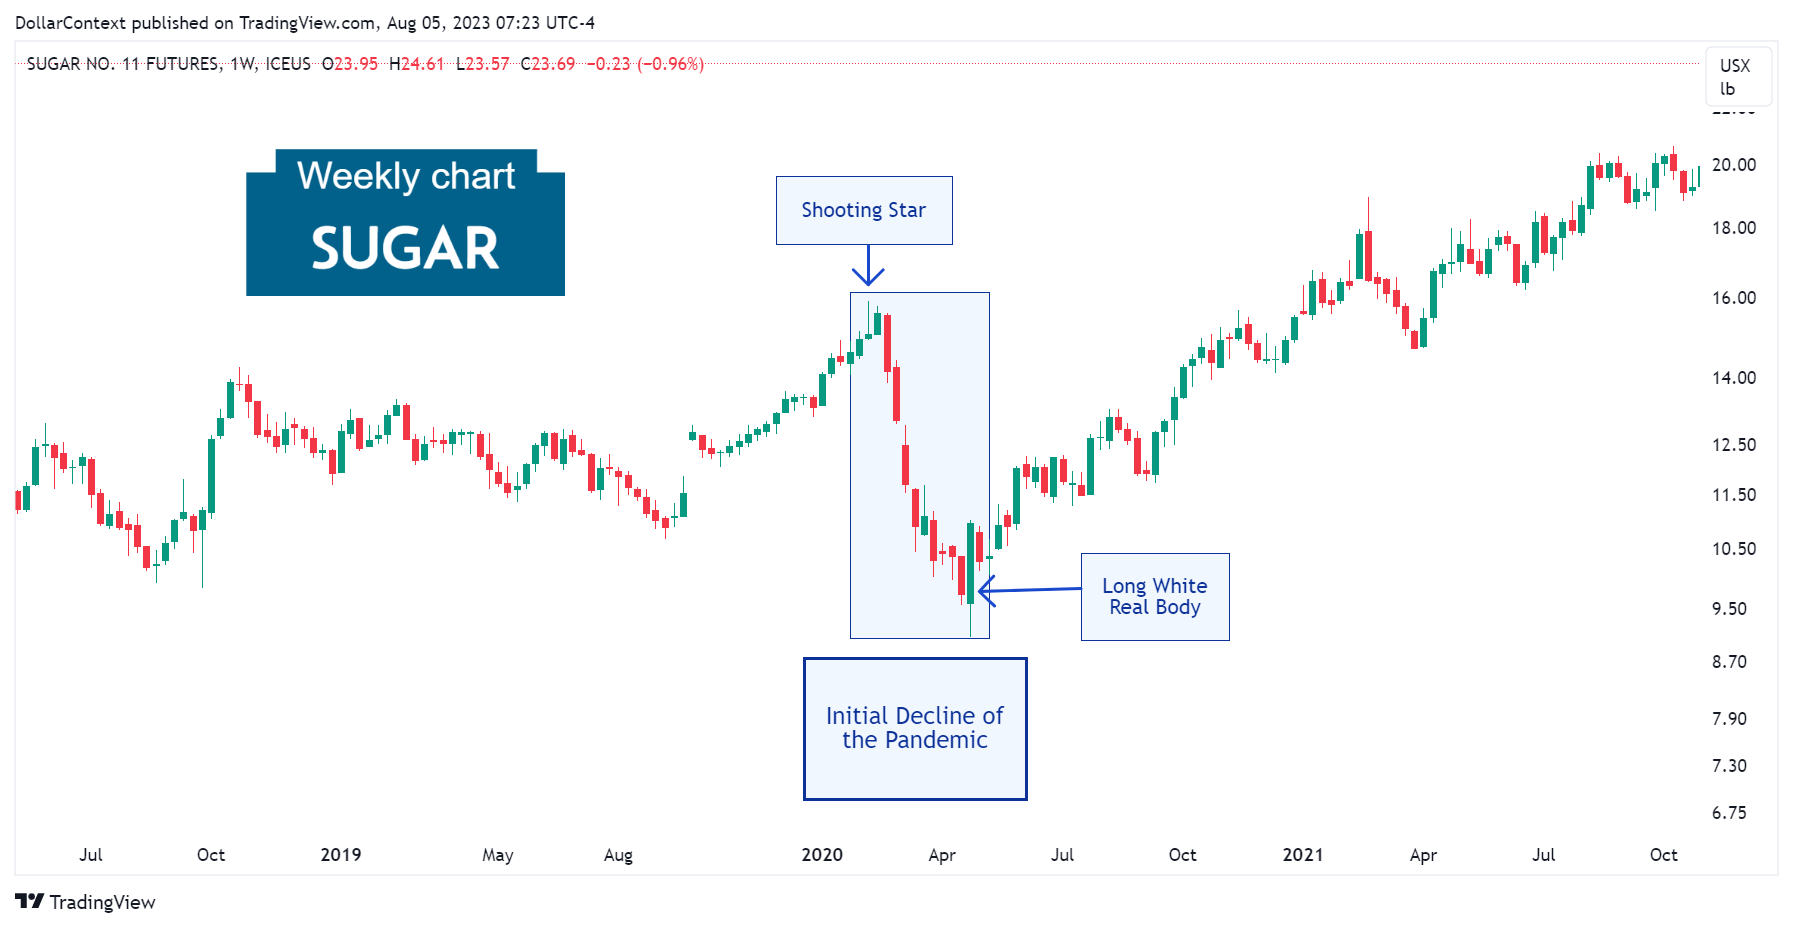
1. January 2020–April 2020: The Meltdown of the pandemic
A number of factors contributed to a significant fall in the sugar market during the first quarter of 2020, essentially:
- COVID-19 Pandemic: This unparalleled health emergency resulted in a deceleration of worldwide economic activity due to the enforcement of lockdowns and limitations. Additionally, the pandemic created disruptions in supply chains, leading to further instability, uncertainty, and unpredictability in the market.
- Strengthening of the Dollar: During this period, the flight to safer assets and the appreciation of the dollar played a role in driving down global commodity prices, including sugar, as these assets are denominated in the US currency.
Technically speaking, it's worth mentioning that the decline was triggered by a shooting star pattern (Japanese candlestick analysis), while the bottom of the downturn was signaled after the appearance of a long white real body session.
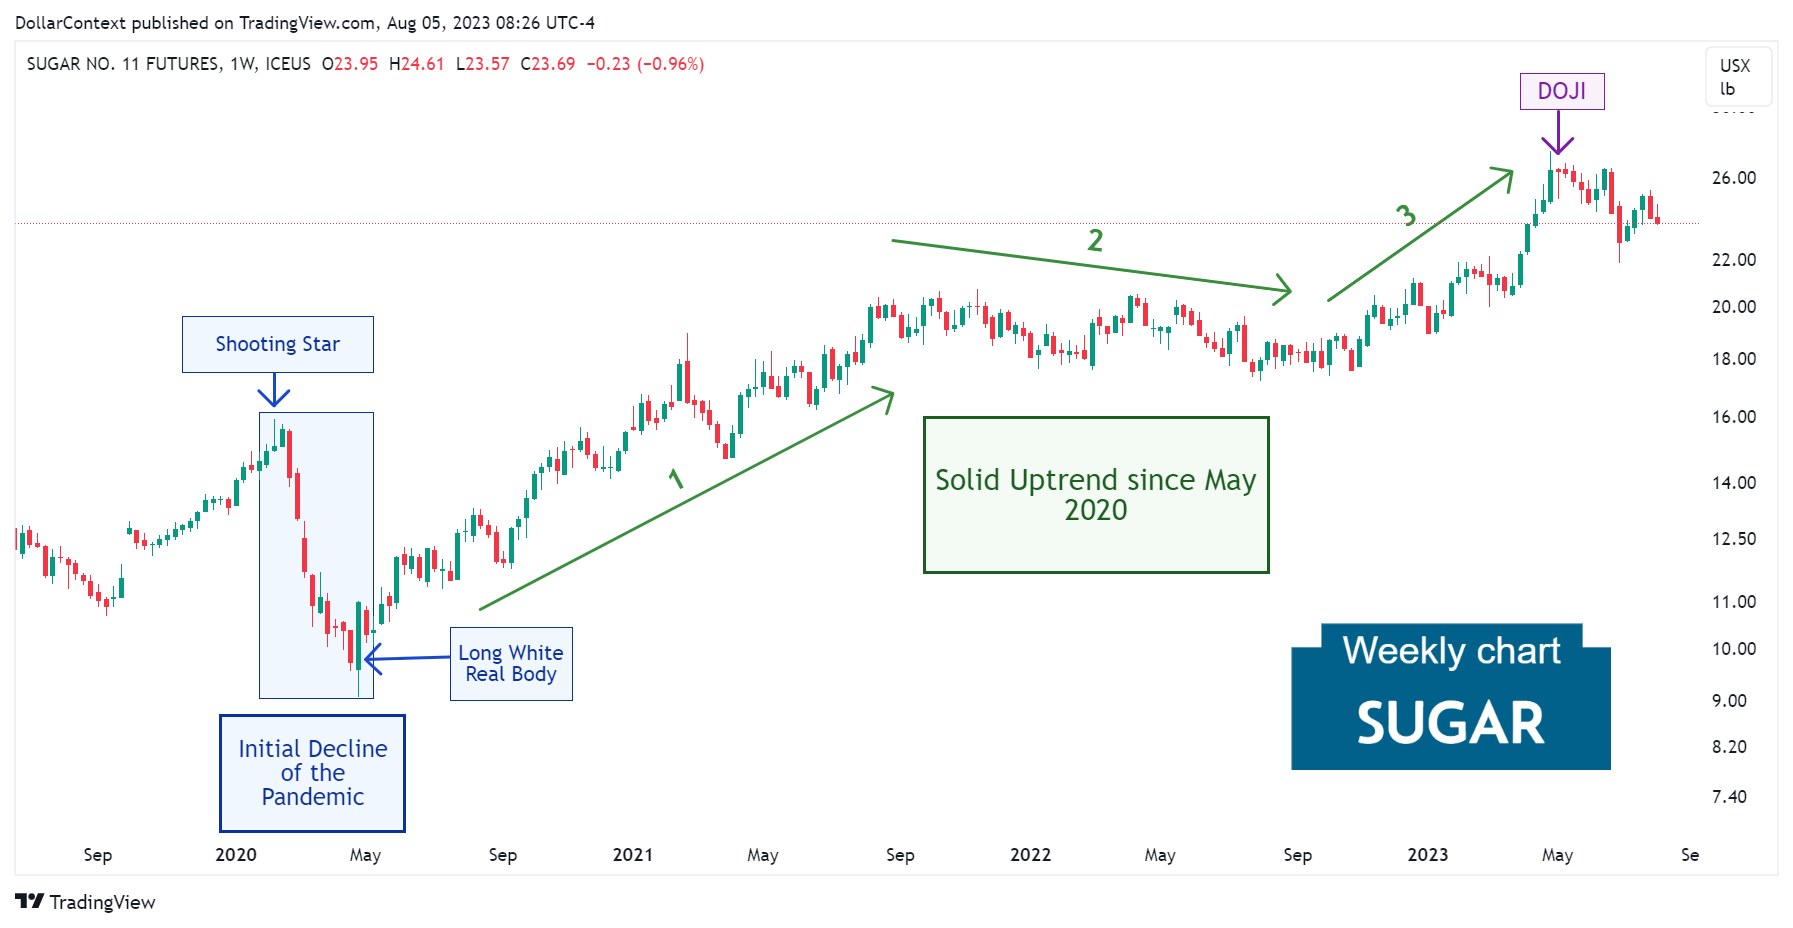
2. May 2020–July 2023: The Solid Uptrend
Following the emergence of the long white real body at the end of April 2020, the sugar market embarked on a bullish path that, apparently, remains in place.
We can distinguish three main phases within this extended upward move:
- Price Climbing Acceleration: This surge was largely driven by factors such as supply chain disruptions, government stimulus measures, the global economy's recovery, and a period of dollar weakness.
- Price Stabilization Period: This likely resulted from the aggressive rate-hiking cycle implemented by major central banks globally, coupled with a phase of dollar recovery.
- An additional uptick in sugar prices coincided with another retreat in the dollar index.
Observe that the correction that began in May 2023 was characterized by a doji, which followed a large white body candle.
3. Outlook for Late 2023 and 2024
From our perspective, two primary factors are expected to influence the trajectory of sugar prices throughout 2023 and 2024.
- Supercycle Hypothesis: Beginning in 2020, the commodity market might have set in motion a supercycle period. Commodity supercycles typically last for over eight years and trigger significant price increases across global commodity assets. Should this theory prove true, the sugar market would have embarked on a minor correction phase starting in May 2022, with the potential to resume its upward trajectory at some point.
- Economic Downturn Risks: The vigorous cycle of rate hikes implemented by the Federal Reserve, along with the analysis of key indicators such as the yield curve and the PMI, points to a considerable likelihood of an upcoming economic decline, which might unfold in 2024. As shown in the chart below, the initial phase of an economic contraction (highlighted by gray-shaded regions) usually, but not always, exerts downward pressure on sugar prices.
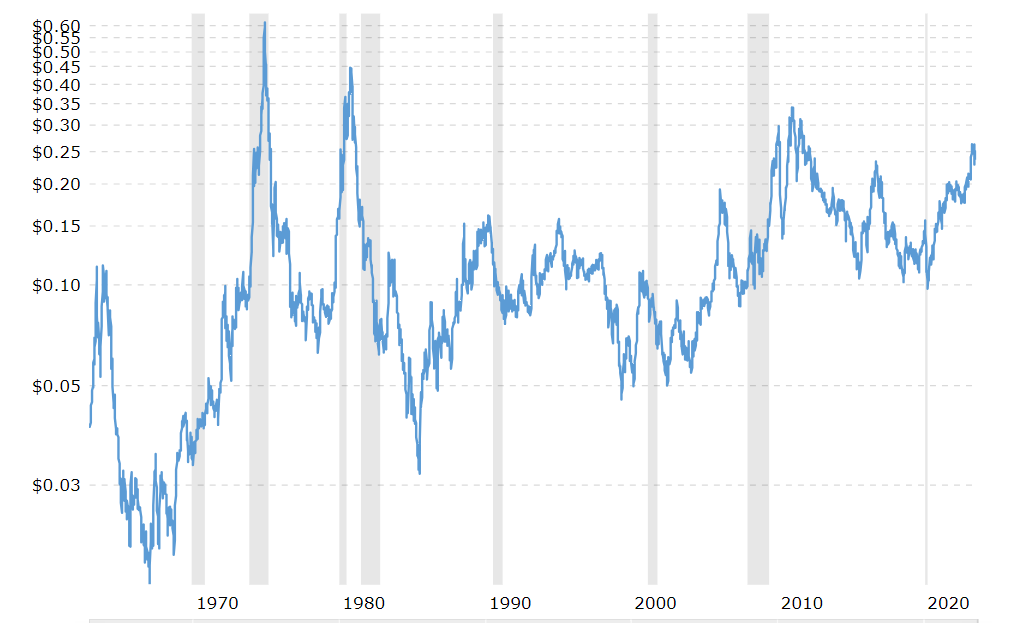
Source: Macrotrends


