Wheat Prices: A Look Back and Ahead
We delve into the key driving forces that have been shaping the wheat market since 2020. Then, we speculate on the potential trajectory this market might take.
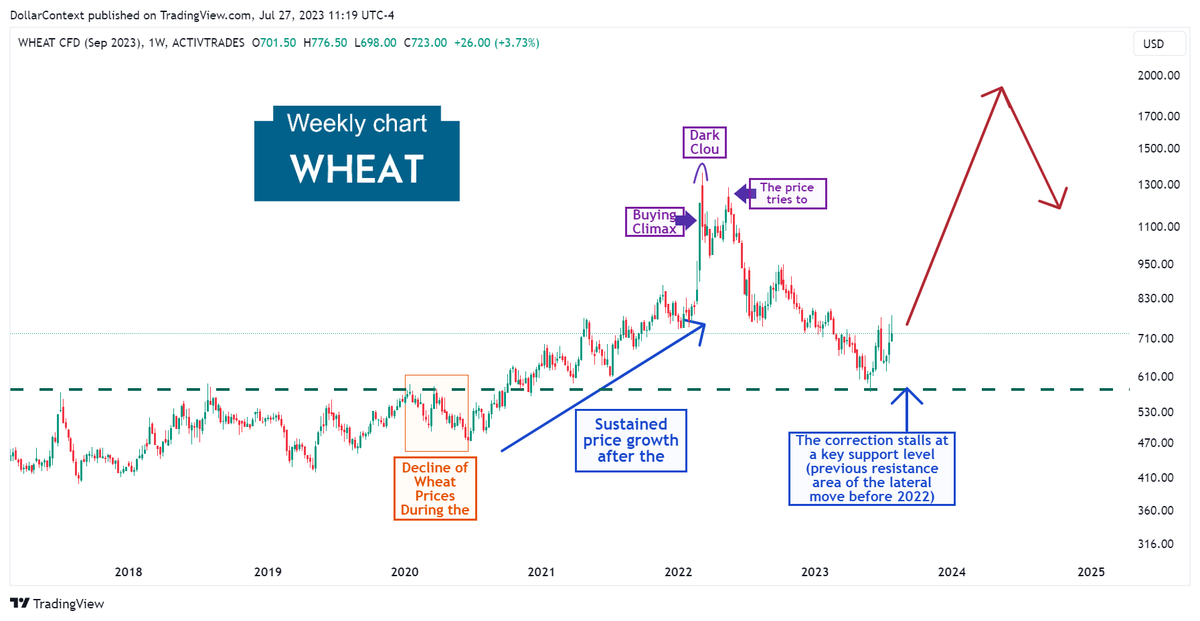
In this article, we'll delve into the technical patterns and key driving forces that have been shaping the course of the wheat market since 2020. As we wrap up, we'll speculate on the potential trajectory this market might take.
1. First half of 2020: The Pandemic Effect
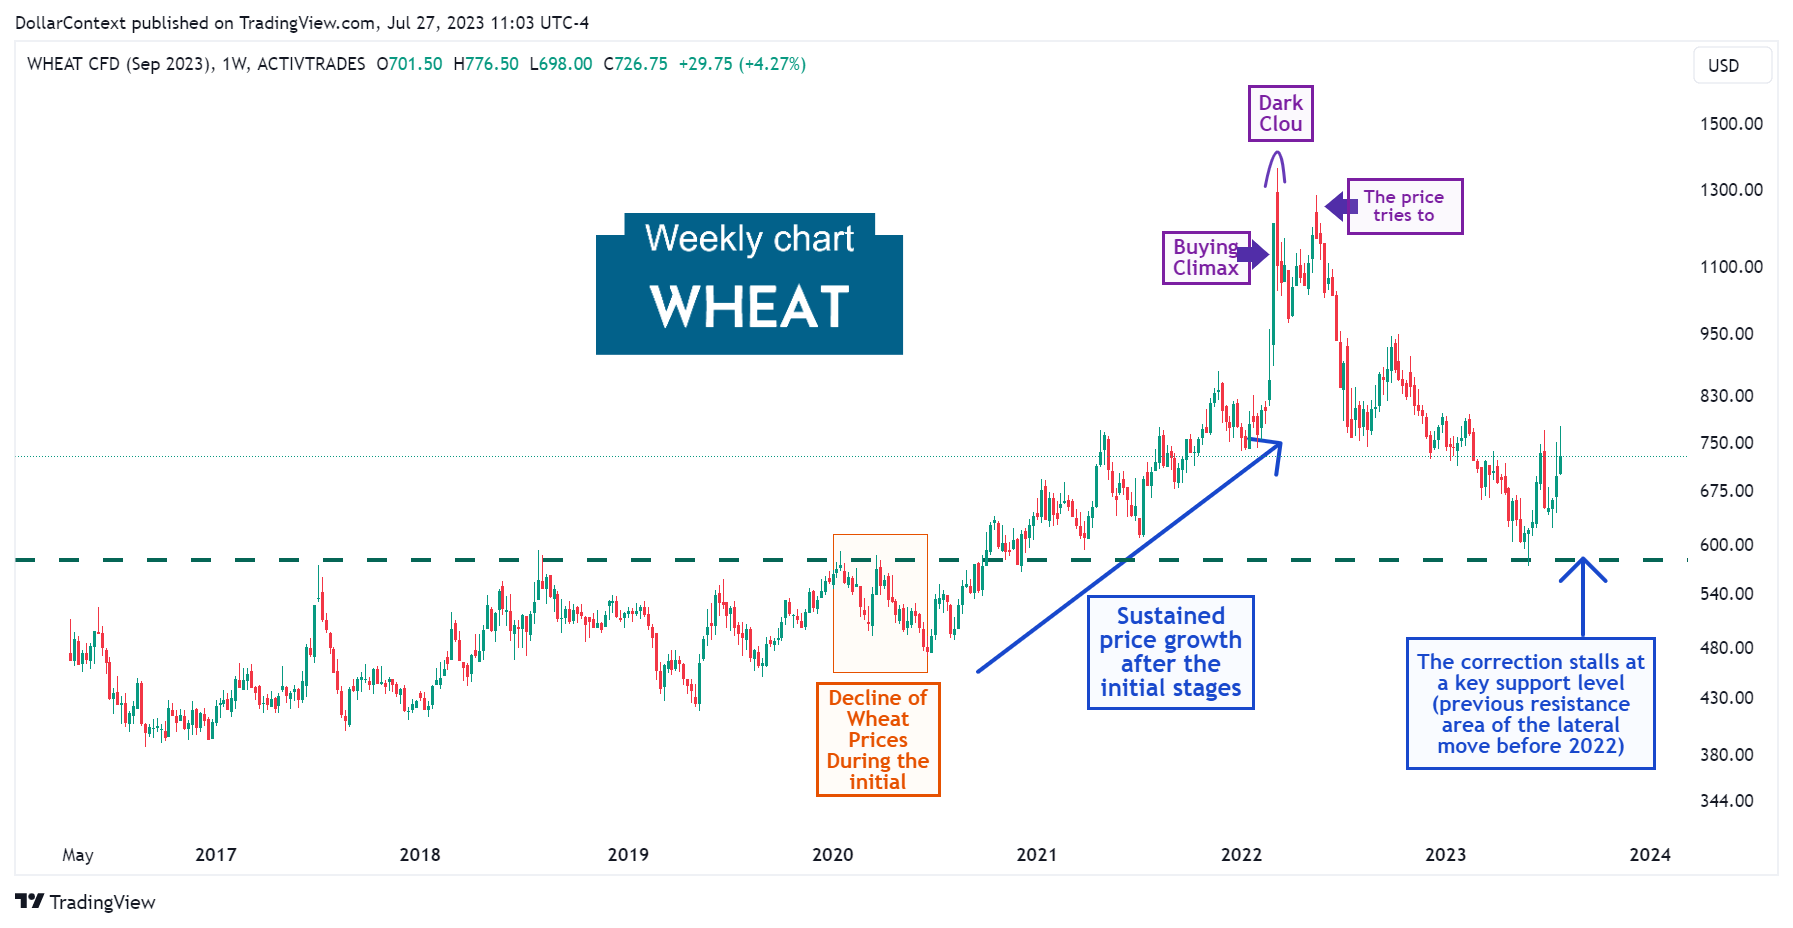
The influence of the COVID-19 pandemic on the 2020 wheat market presented a mixed picture. During the first half of the year, from January to June 2020, there was a worldwide reduction in wheat prices, yet this dip was not as abrupt as seen in other commodities, which experienced a dramatic collapse, albeit briefly, during the same period.
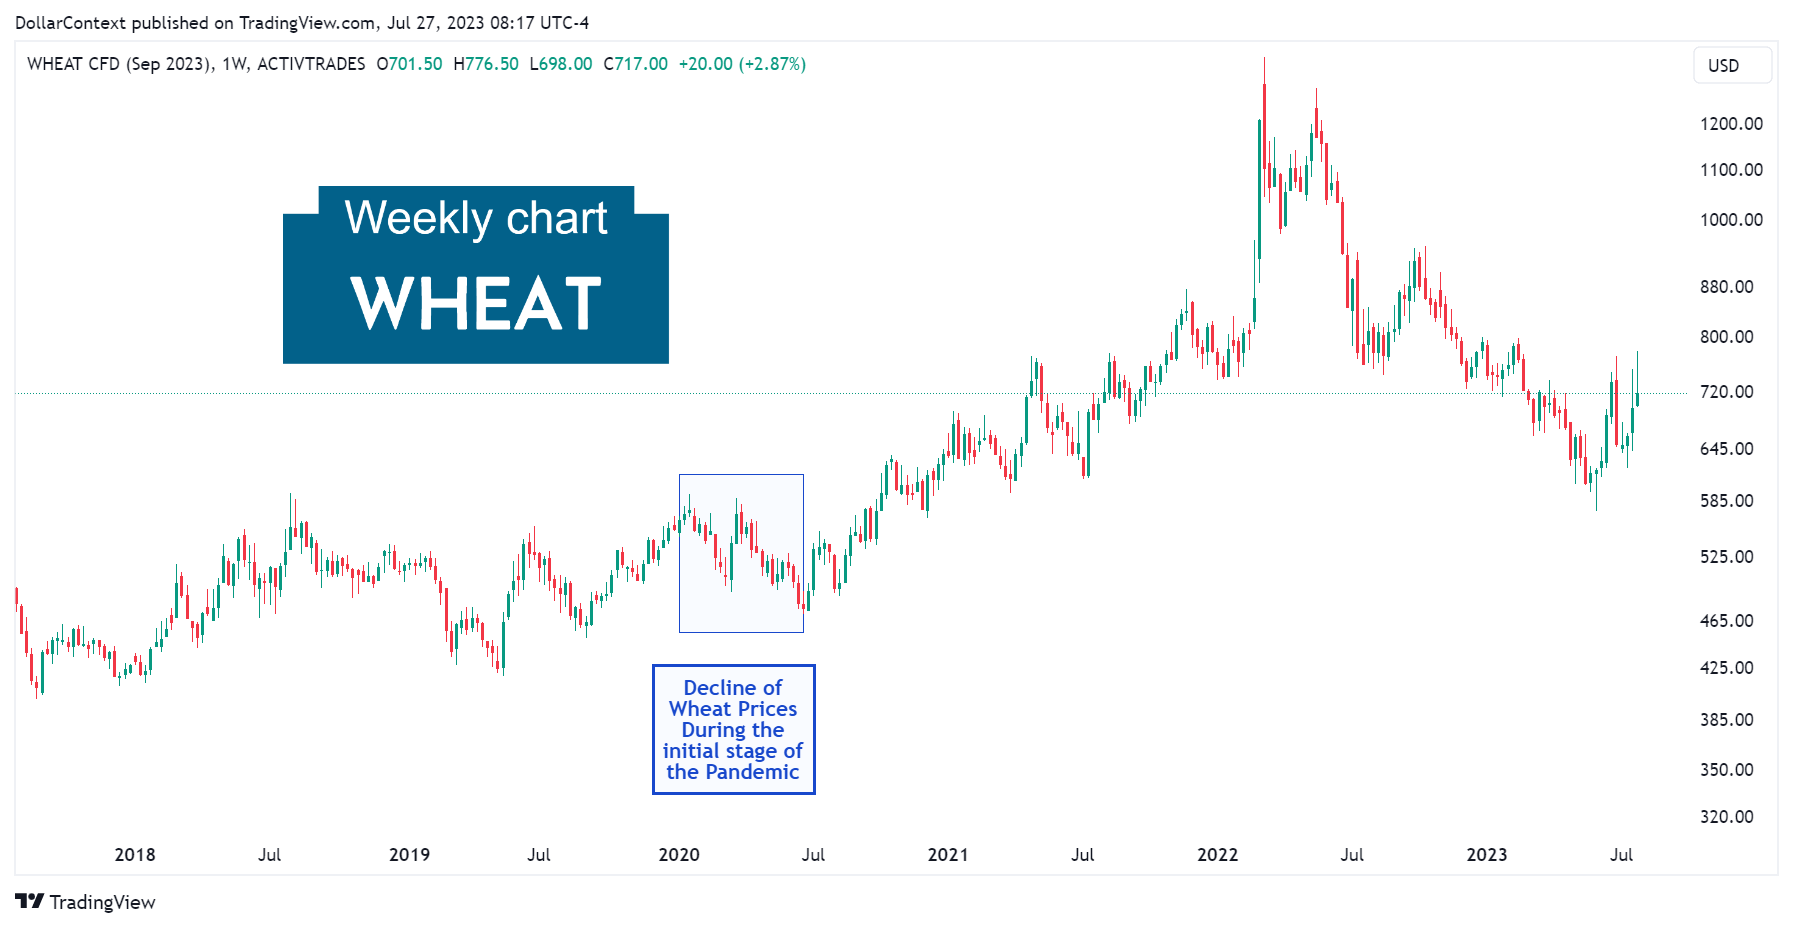
2. June 2020–February 2022. The Sustained Uptrend
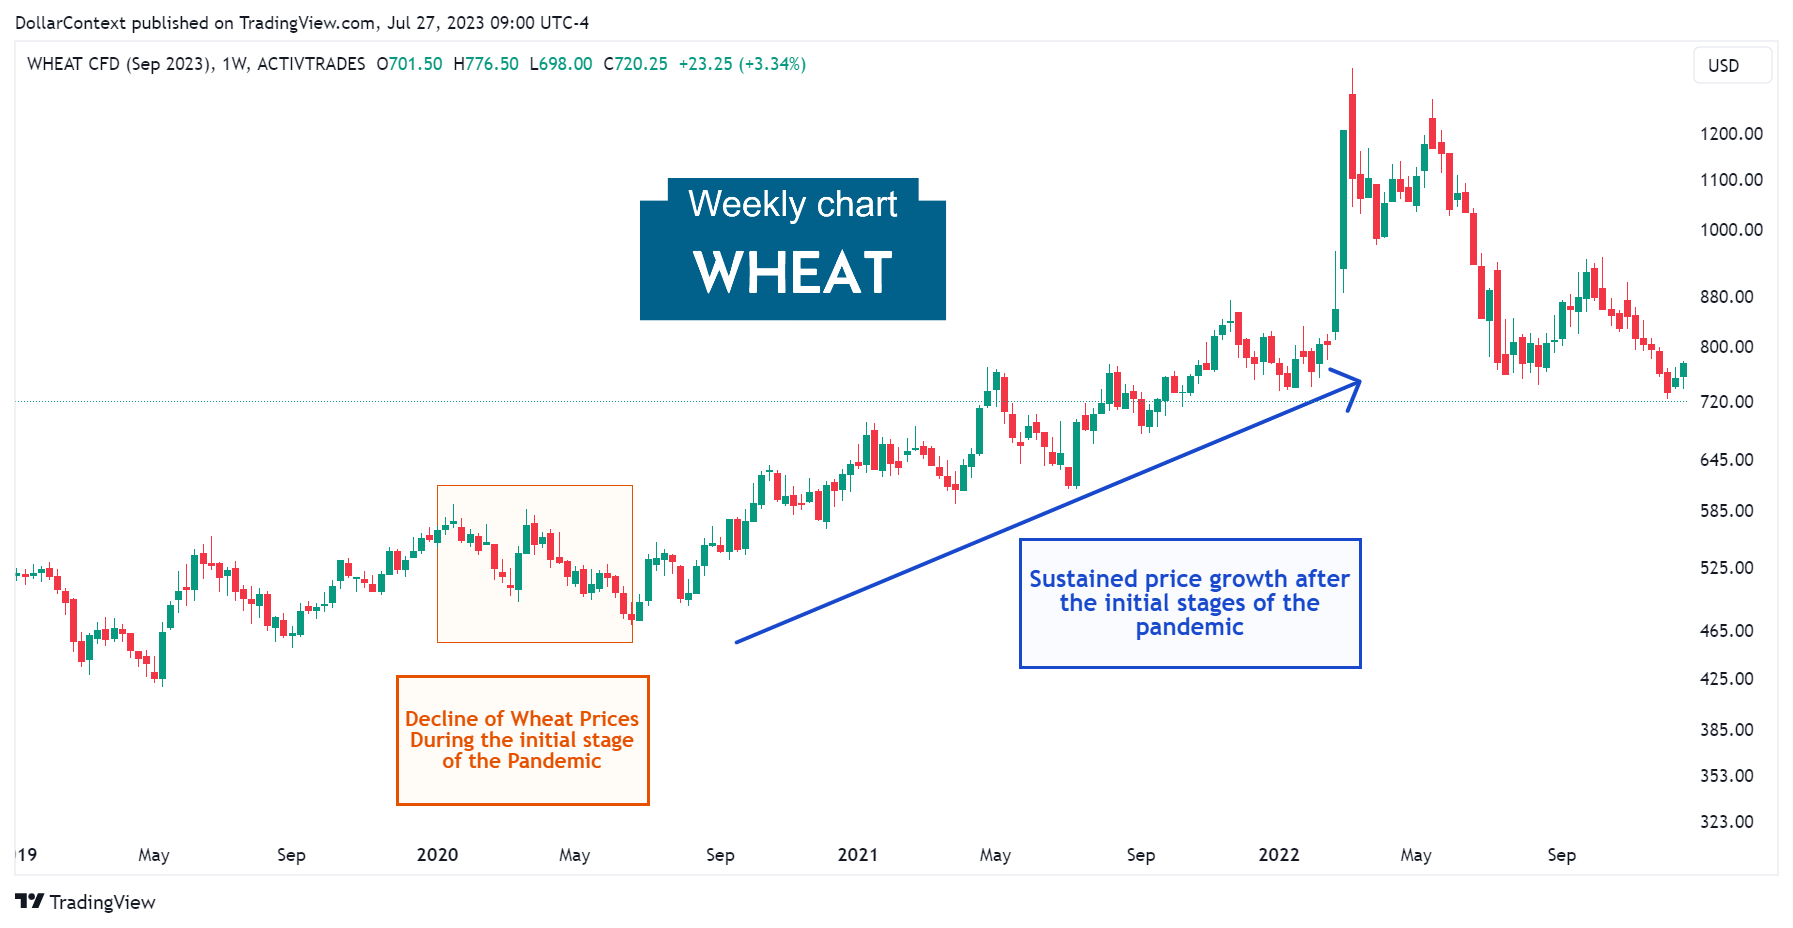
Between June 2020 and February 2022, a number of key drivers, detailed below, propelled wheat prices upwards over a span of nearly two years:
- Supply Chain Disruptions: The COVID-19 pandemic significantly disrupted global supply chains, pushing up prices.
- Global Economic Recovery: As countries around the world began to recover from the initial shock of the pandemic, demand for goods and services, including agricultural commodities, began to recover as well. This increased demand led to rising prices.
- Government Stimulus Programs: In response to the economic impact of the pandemic, many governments introduced substantial stimulus programs. These actions boosted purchasing power and demand for commodities, including wheat.
3. March 2022. The Climax
In the initial phase of Russia's military incursion into Ukraine, the wheat market chart displayed a remarkable long white candle. Typically, the presence of such an extensive white real body, following an extended uptrend, indicates a potential buying climax in the market.
A buying climax refers to a situation where there is a surge in buying activity, often driven by overly optimistic investor sentiment, which pushes the price of an asset to its peak before a reversal or a significant pullback.
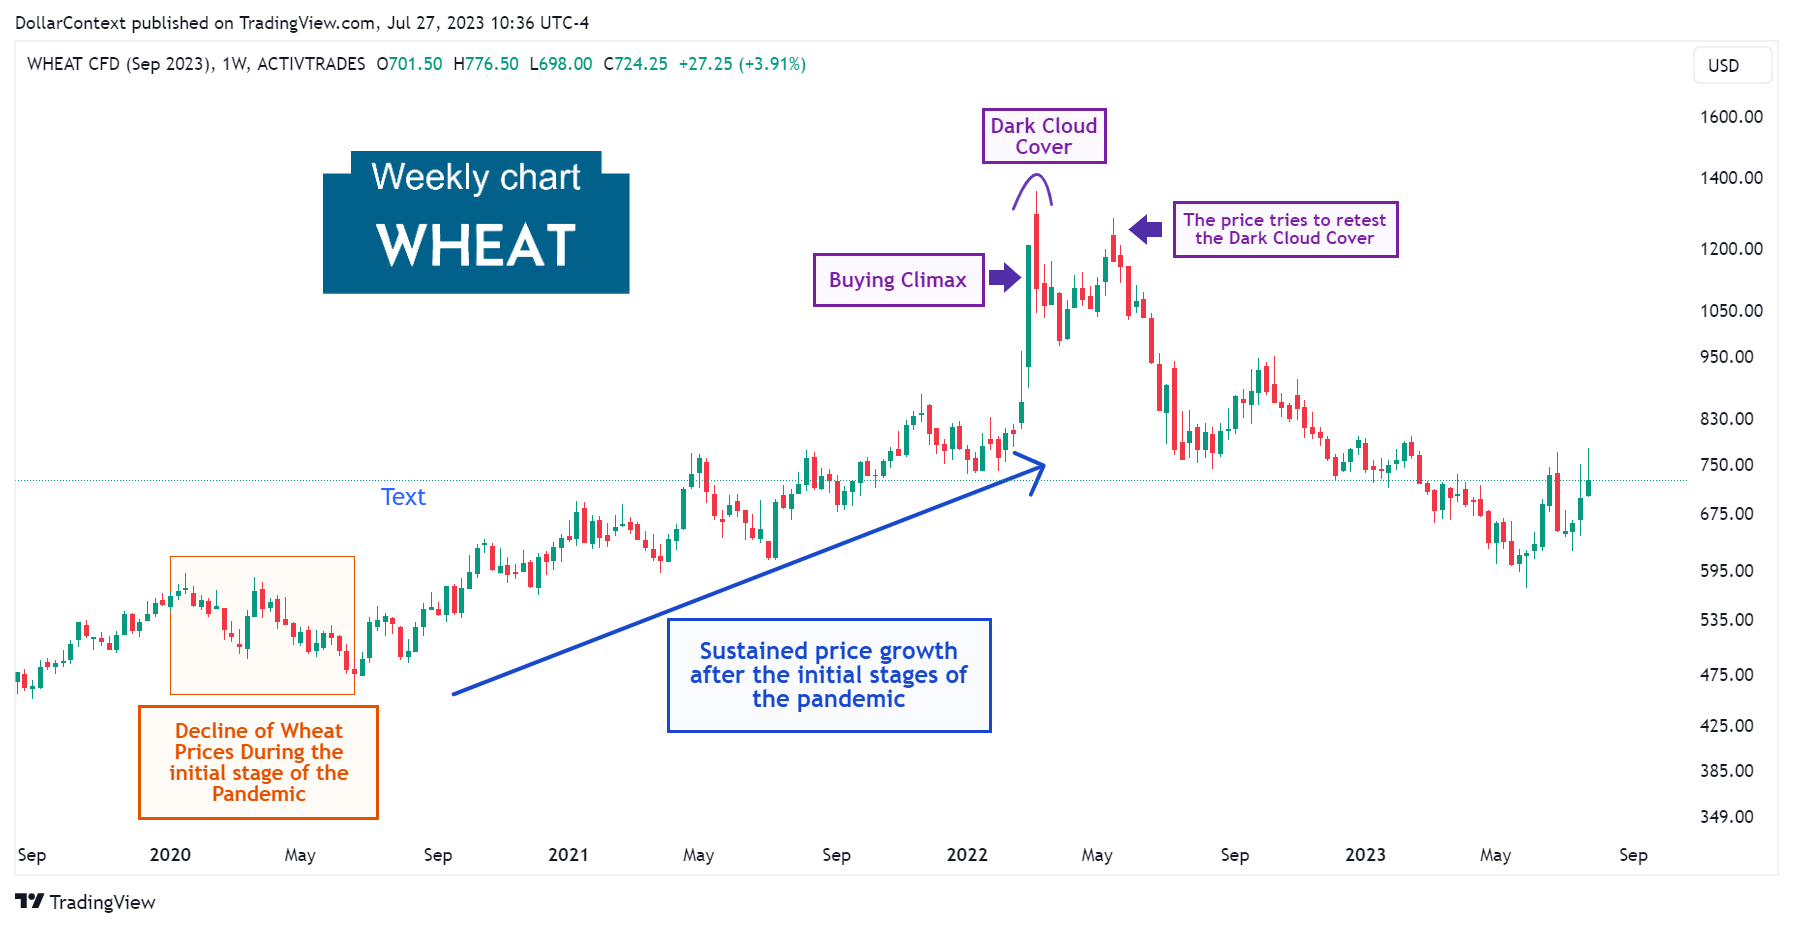
The reversal materializes via a dark cloud cover (Japanese candlestick analysis). In this pattern, the second session should ideally close below the midpoint of the preceding white or green candle. Although this specific condition wasn't met on our chart, the two-candle combination still warranted significant attention as a reversal indicator, given that:
- The first real body was an unusually large candle. As previously mentioned, this frequently indicates a strong likelihood of reaching a climax.
- At the start of the second session, prices climbed to a level significantly higher than the closing price of the first session. However, the bears successfully managed to pull the prices back down into the range of the first session's real body.
Notice how the wheat market attempts to retest the peak levels of the dark cloud cover before confirming the reversal, but it fails to achieve this.
4. Since June 2022
Beginning in June 2022, the market has been undergoing a persistent correction that has continued until now.
Observe that the downturn pauses at a crucial support level: the prior resistance level formed by the extended sideways movement before 2022.
5. Forecast for Late 2023 through 2024
Starting in 2020, the commodity market, which includes wheat and other agricultural products, could have initiated a supercycle period. Commodity supercycles often span over 8 years and are broad-based; that is, they are not concentrated on a limited number of commodity assets. If this theory turns out to be true, then wheat would have been experiencing a correction since June 2022.
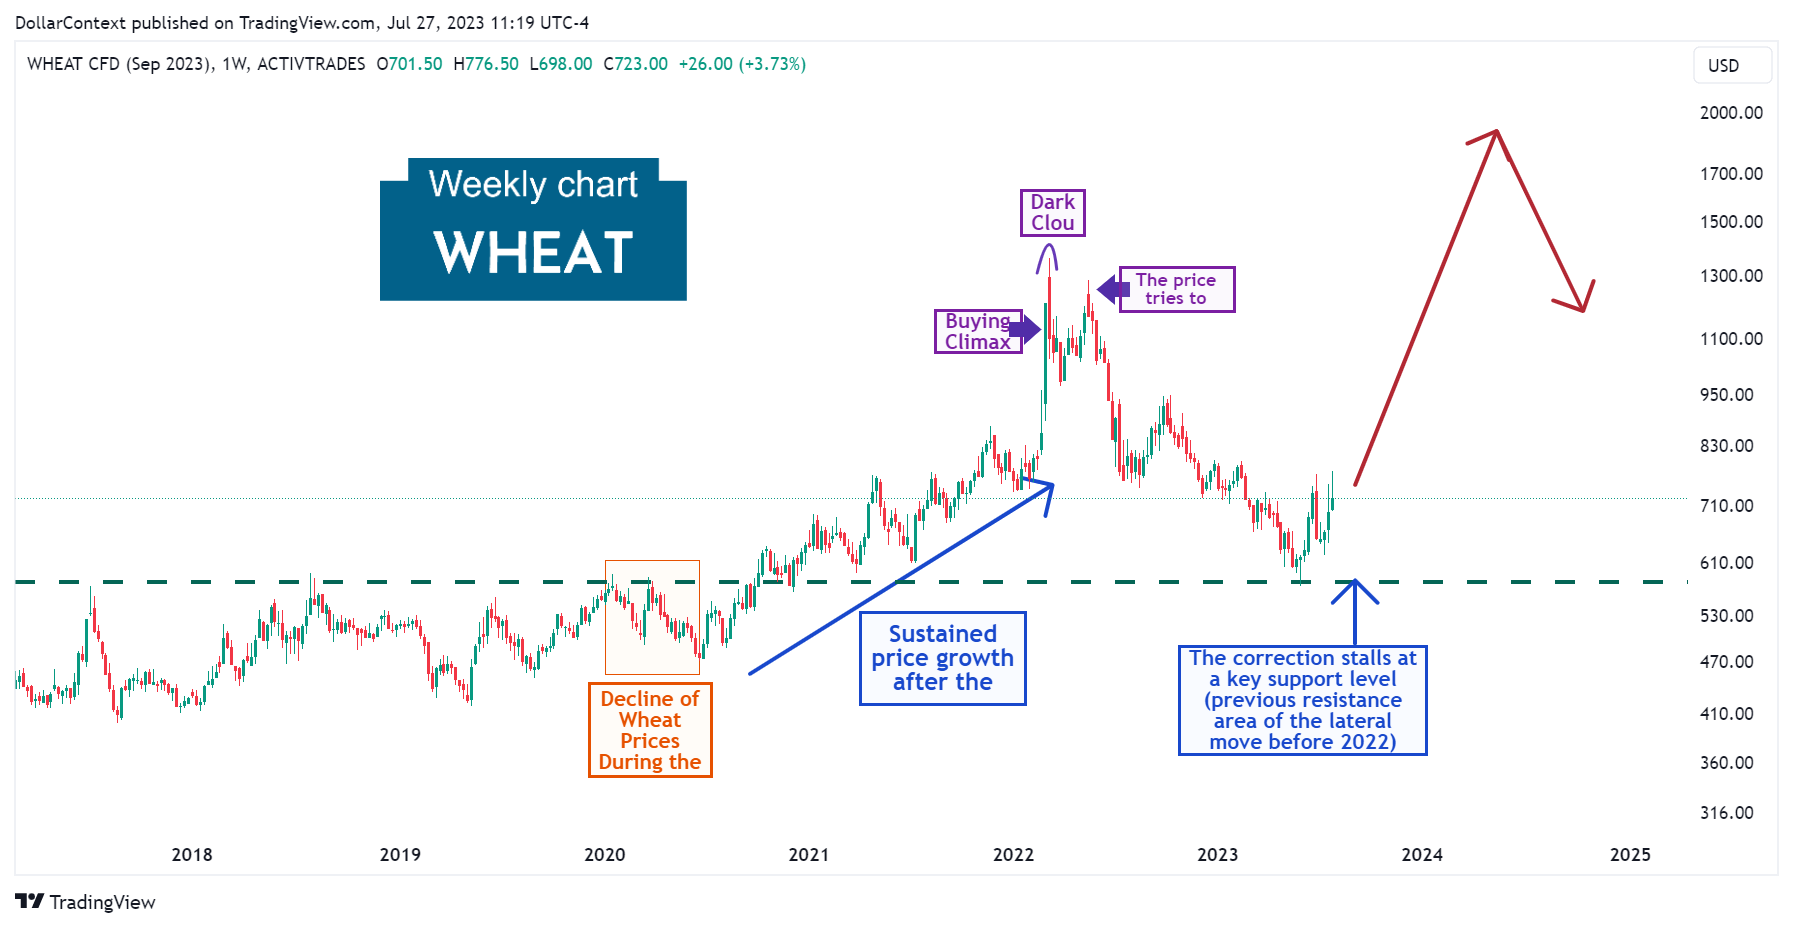
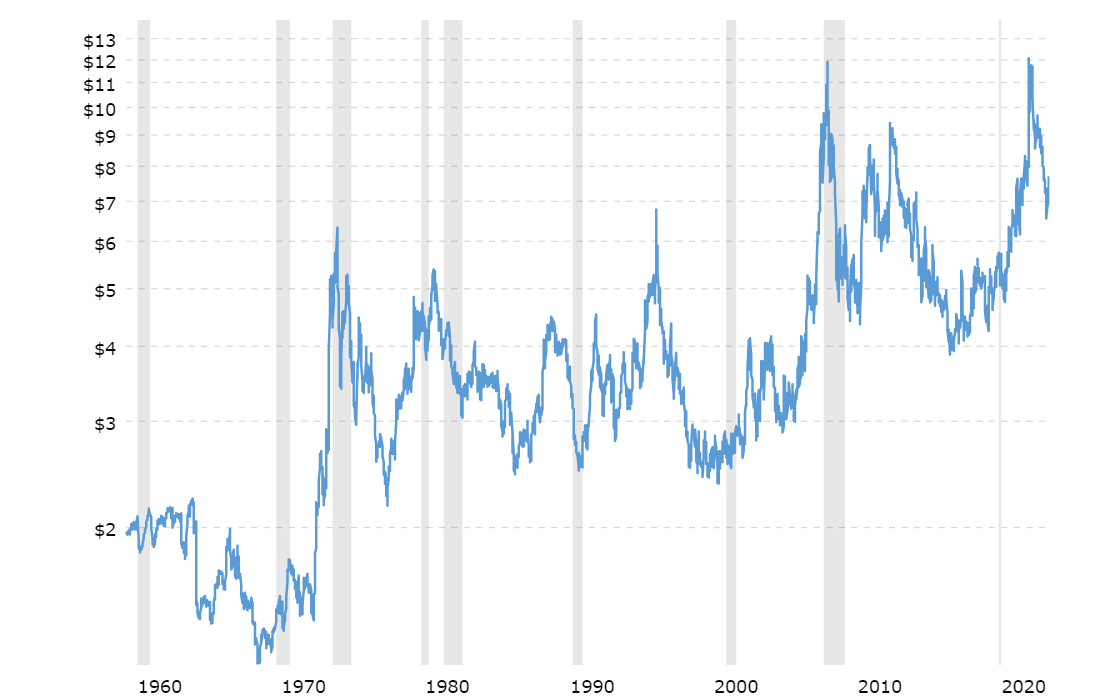
Nevertheless, considering our forecast of an economic downturn in the upcoming year, a drastic correction might occur in 2024, potentially leading to a significant recalibration in the price of wheat. Observe the trend of wheat undergoing significant drops during periods of economic downturn, as highlighted by the gray-colored areas in the chart below.
Source: Macrotrends


