U.S. Dollar Index (DXY): Evolution and Outlook
We examine the key factors that have shaped the course of the U.S. Dollar Index (DXY) starting from 2020.

This analysis reflects market conditions and information available at the time of publication (October 2023). It is provided for educational and historical context.
In this piece, we'll examine the key factors that have shaped the course of the U.S. Dollar Index (DXY) starting from 2020. We will wrap up by discussing potential influences that may affect the index's future fluctuations.
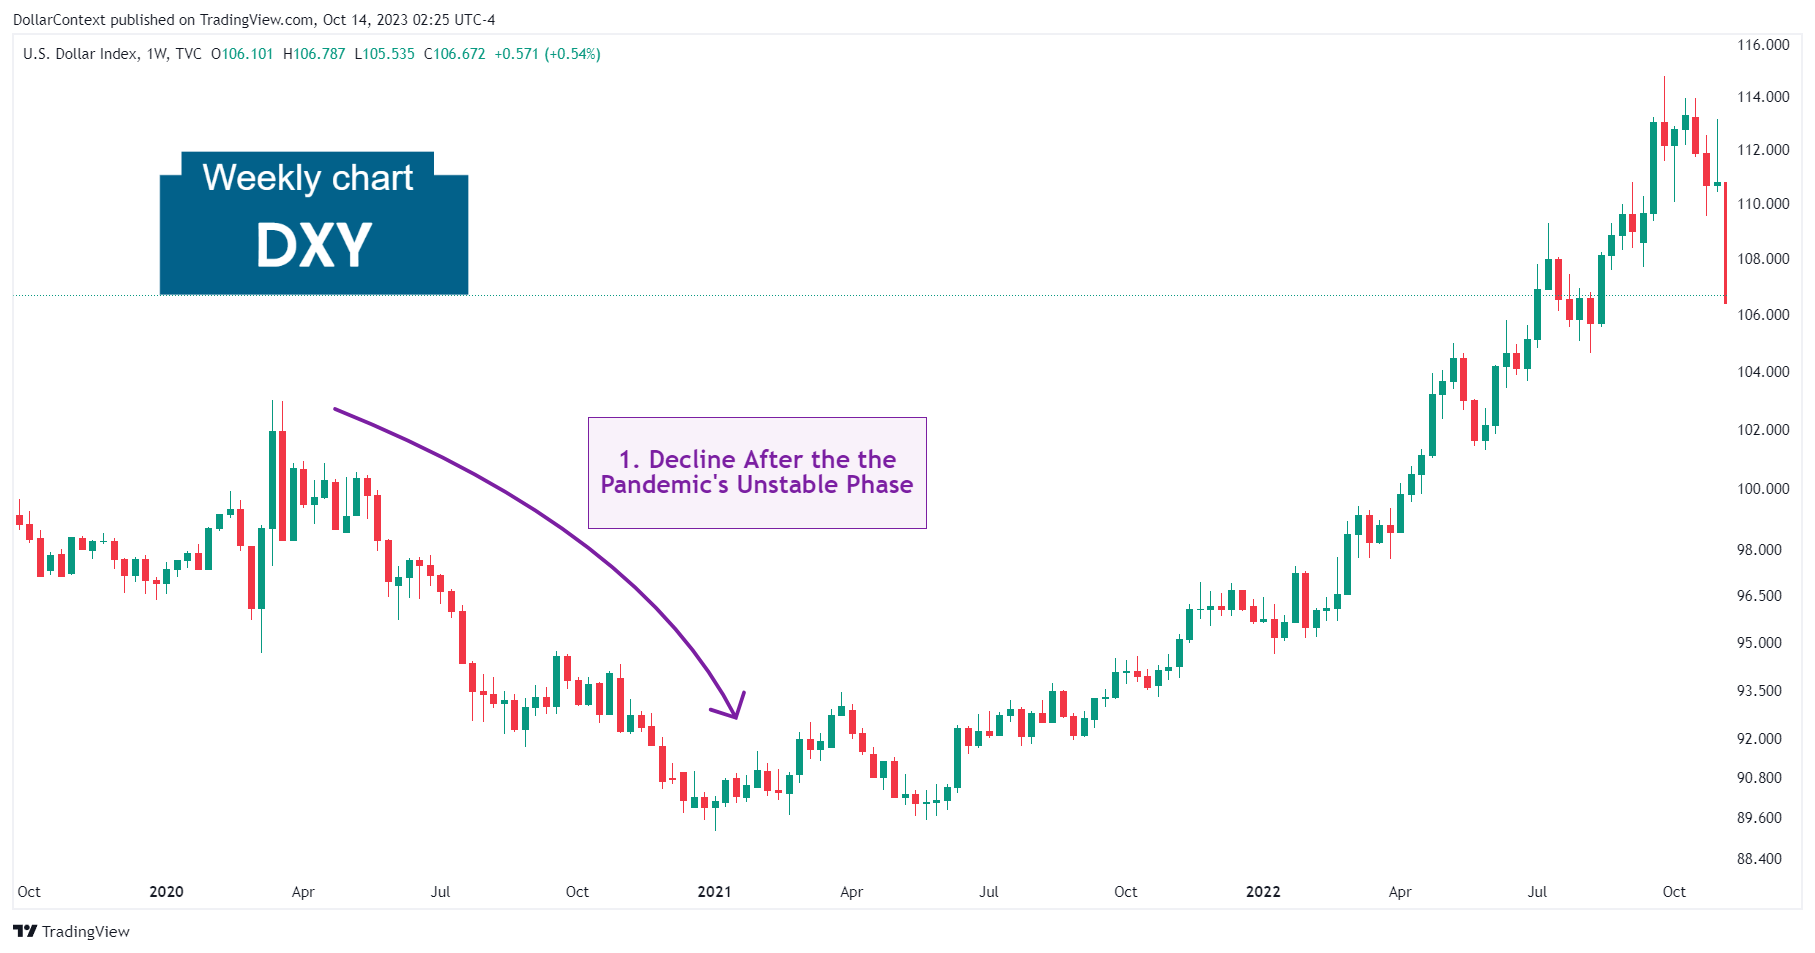
1. January 2020–May 2021: Steep Drop After the Pandemic's Unstable Phase
The trajectory of the U.S. Dollar Index (DXY) during 2020 and the first half of 2021 was marked by significant volatility, largely influenced by the global impact of the COVID-19 pandemic and various economic and geopolitical factors.
With the onset of the COVID-19 pandemic in March 2020, there was a flight to safety that initially boosted the dollar as investors sought the stability of U.S. Treasury assets.
In mid-2020, as the Federal Reserve implemented aggressive monetary policies, including rate cuts and asset purchases to support the economy, the dollar weakened considerably. The passing of large government stimulus packages also put downward pressure on the dollar, as increased money supply typically devalues a currency.
In late 2020 and the first half of 2021, the dollar saw some stabilization, although it remained comparatively weak against a basket of other major currencies.
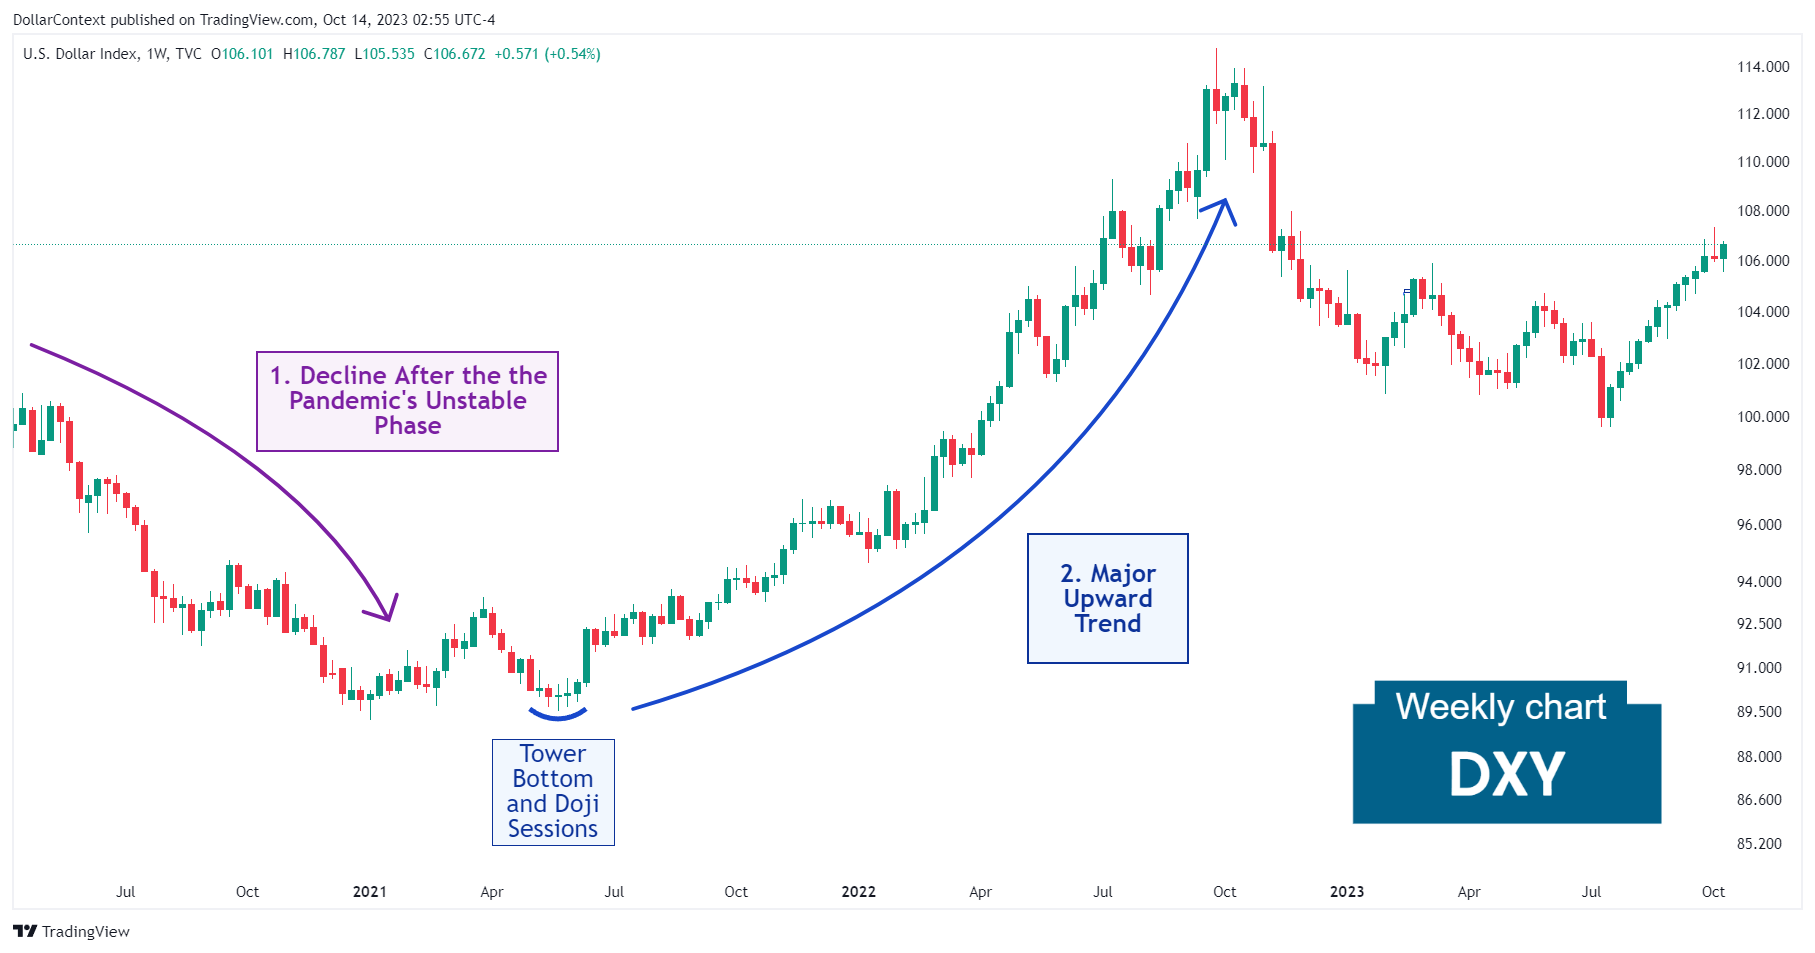
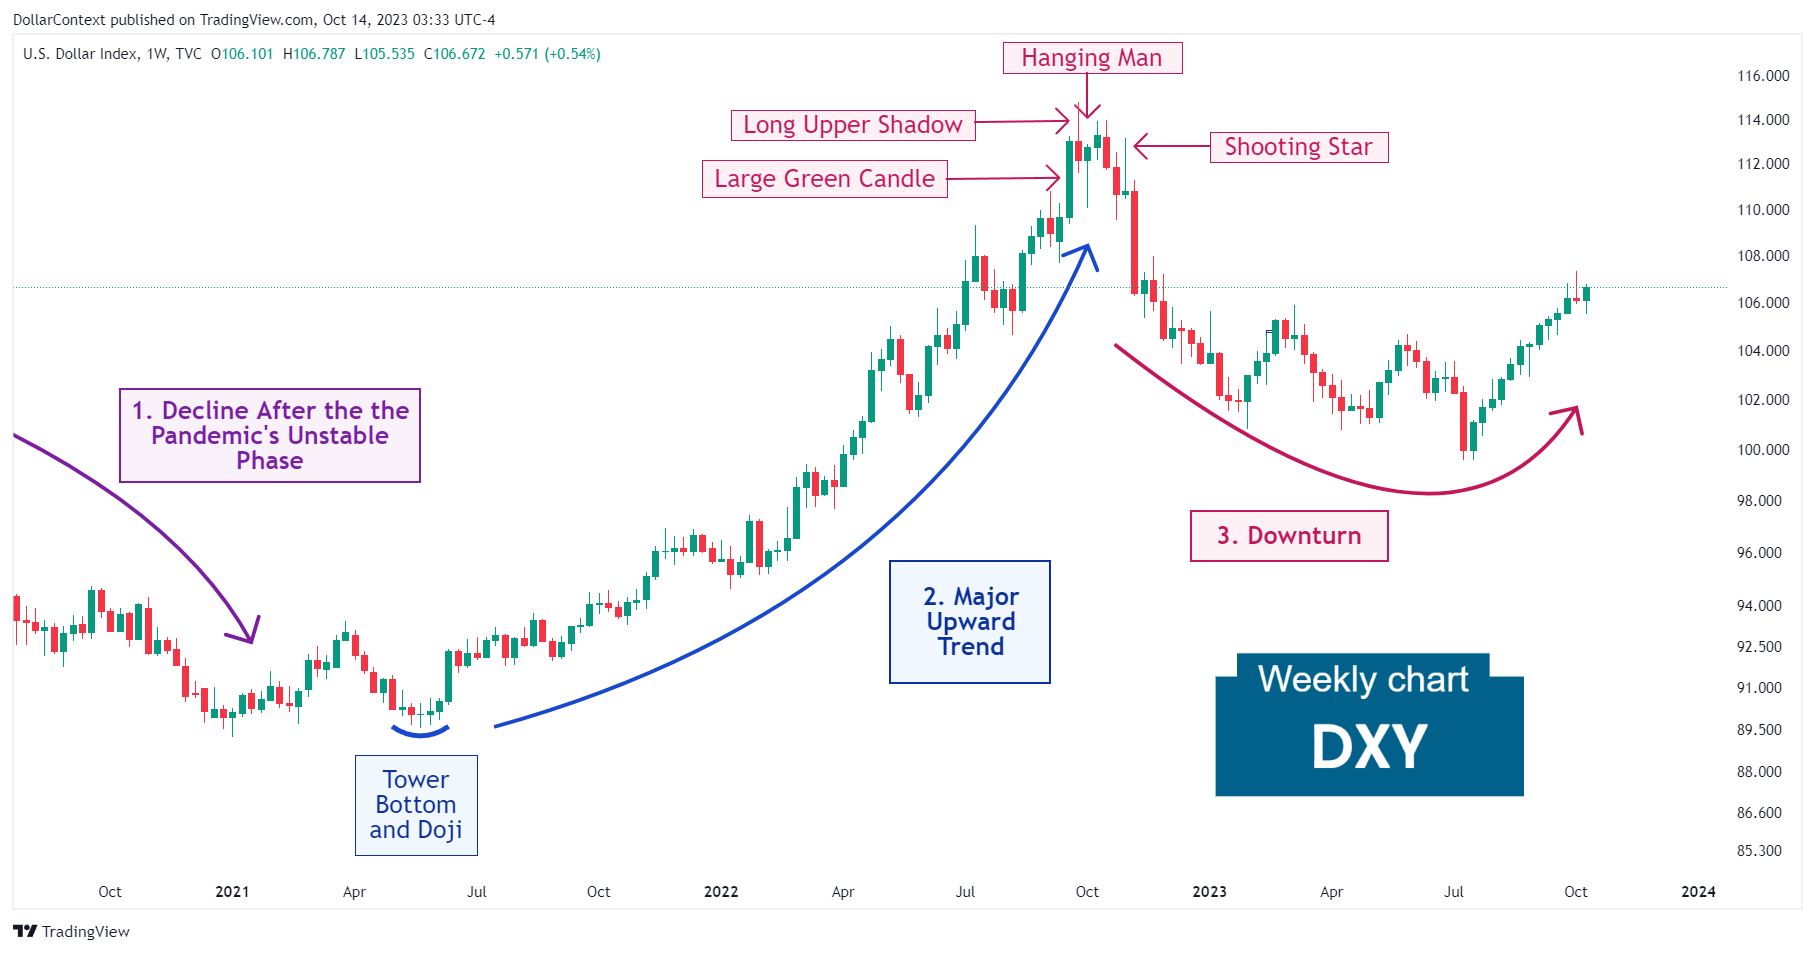
2. June 2021–September 2022: The Remarkable Bullish Trend
Fueled by the Federal Reserve's hiking cycle to combat inflation, the DXY staged a notable uptrend between June 2021 and September 2022.
Technically speaking, the significant bullish momentum started with a tower bottom pattern, which included a series of doji sessions and spinning tops.
3. October 2022–September 2023: The Top and the Ensuing Downturn
A series of candlestick signals suggested a potential market peak near the 113-114 range. These patterns included a long upper shadow candlestick, a hanging man, and a shooting star. Note how this sequence was preceded by a large green candle, suggesting a potential buying climax environment in the market.
4. Outlook for Late 2023 and Throughout 2024
The following perspective reflects expectations based on information and policy signals available at the time of writing.
Although the immediate path of the U.S. Dollar Index remains uncertain, several critical elements could steer its course:
- Impact of AI on Market Sentiment: Advances in Artificial Intelligence technology might sway market mood, possibly diminishing the allure of the U.S. dollar as a riskier asset.
- Concerns of Economic Downturn: Factors such as aggressive rate hikes by the Federal Reserve and red flags like an inverted yield curve suggest the possibility of a global economic slowdown in 2024. In such unstable times, investors commonly seek refuge in the U.S. dollar.
- Growing National Debt: Increasing apprehensions about the widening federal budget deficit may affect the USD's value in both the short and medium term.


