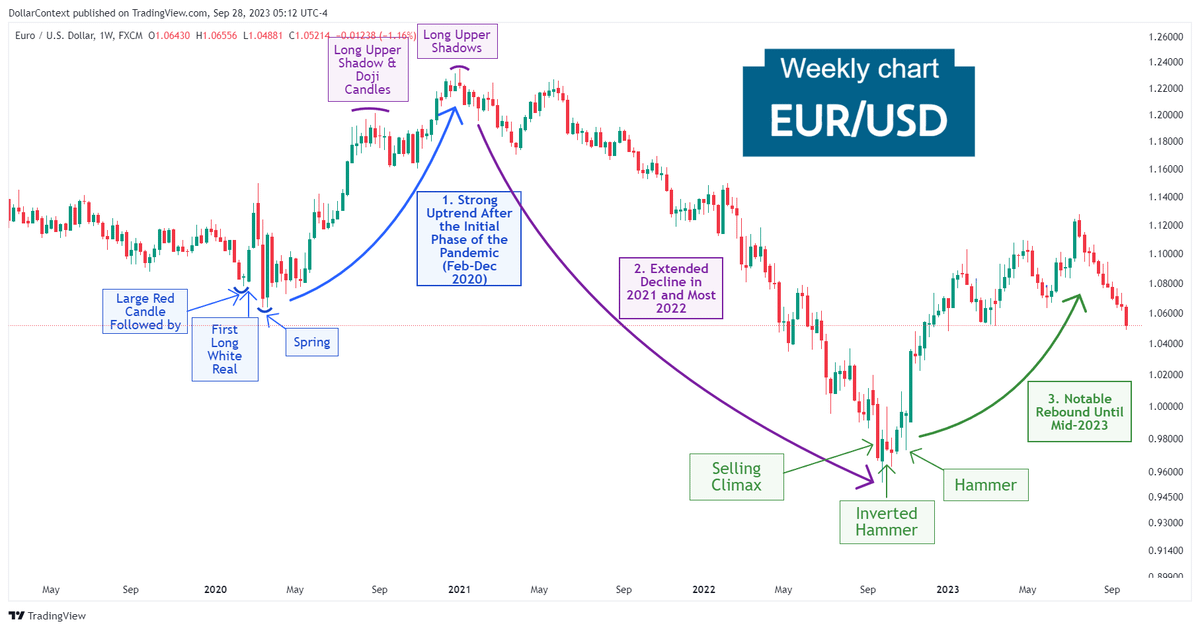
EUR/USD: Evolution and Outlook
We'll examine the drivers that have shaped the EUR/USD pair since 2020 and wrap up by discussing the pair's future movements.
This analysis reflects market conditions and information available at the time of publication (October 2023). It is provided for educational and historical context.
In this article, we'll examine the main drivers that have shaped the direction of the EUR/USD pair from 2020 onward. We'll wrap up by discussing potential elements that might guide the pair's future movements.
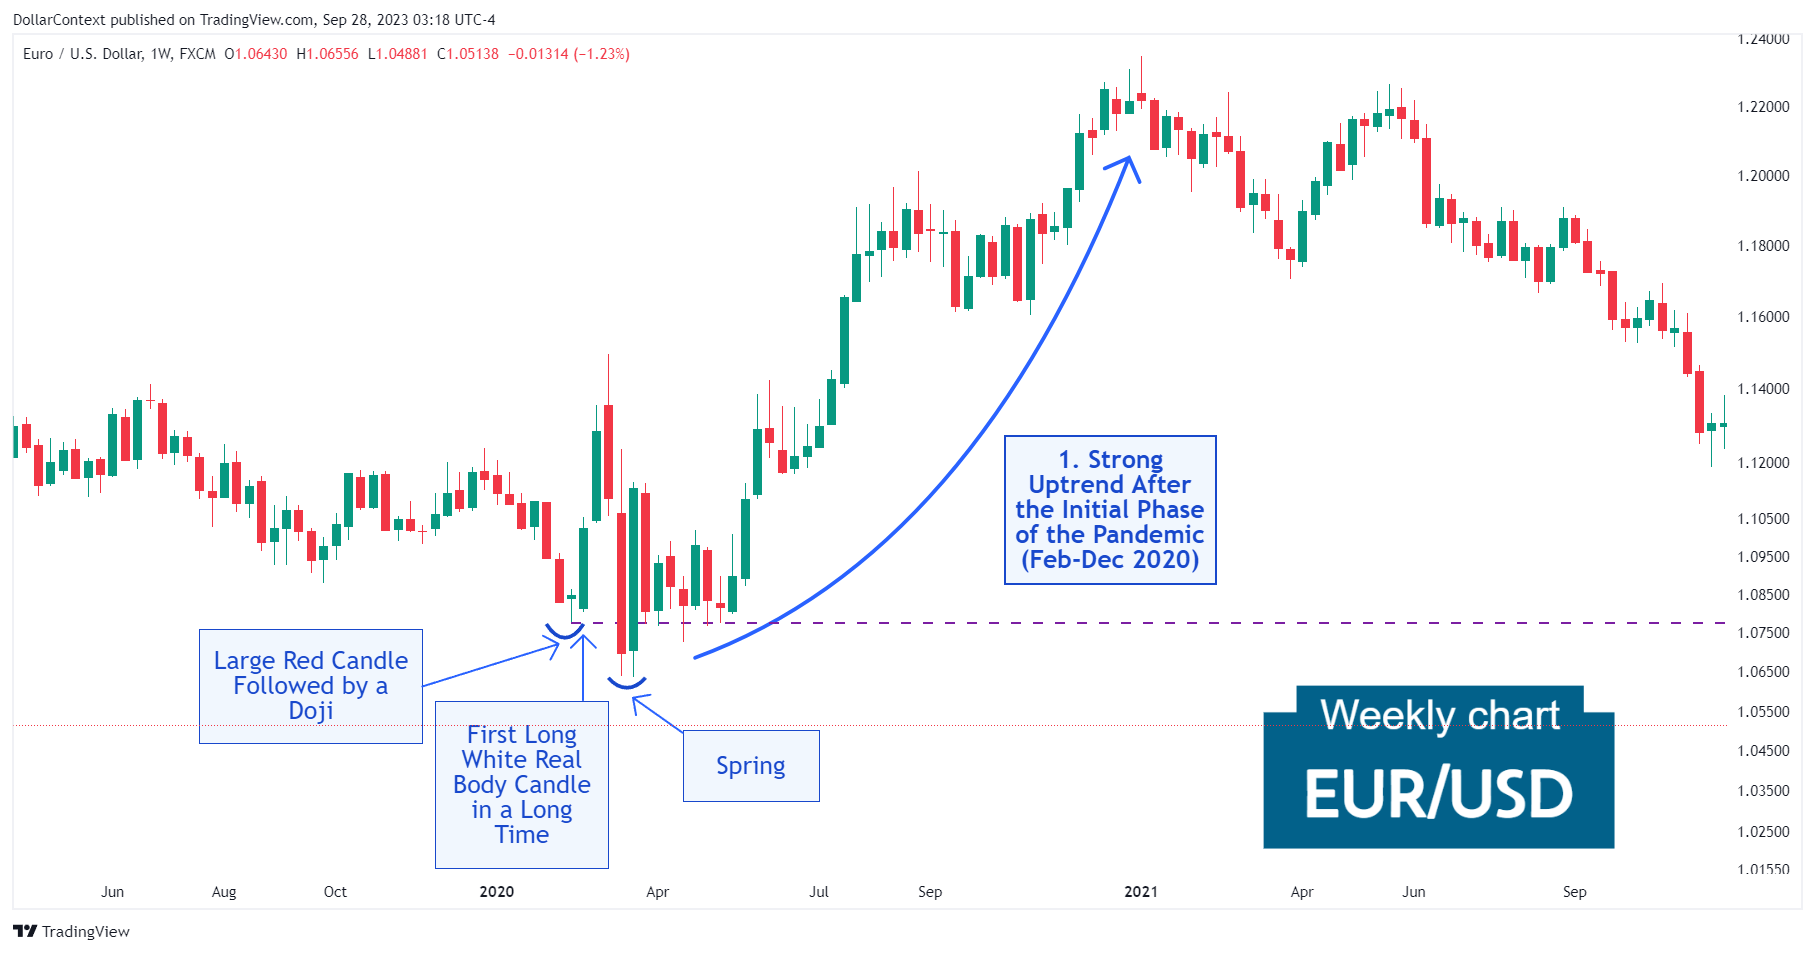
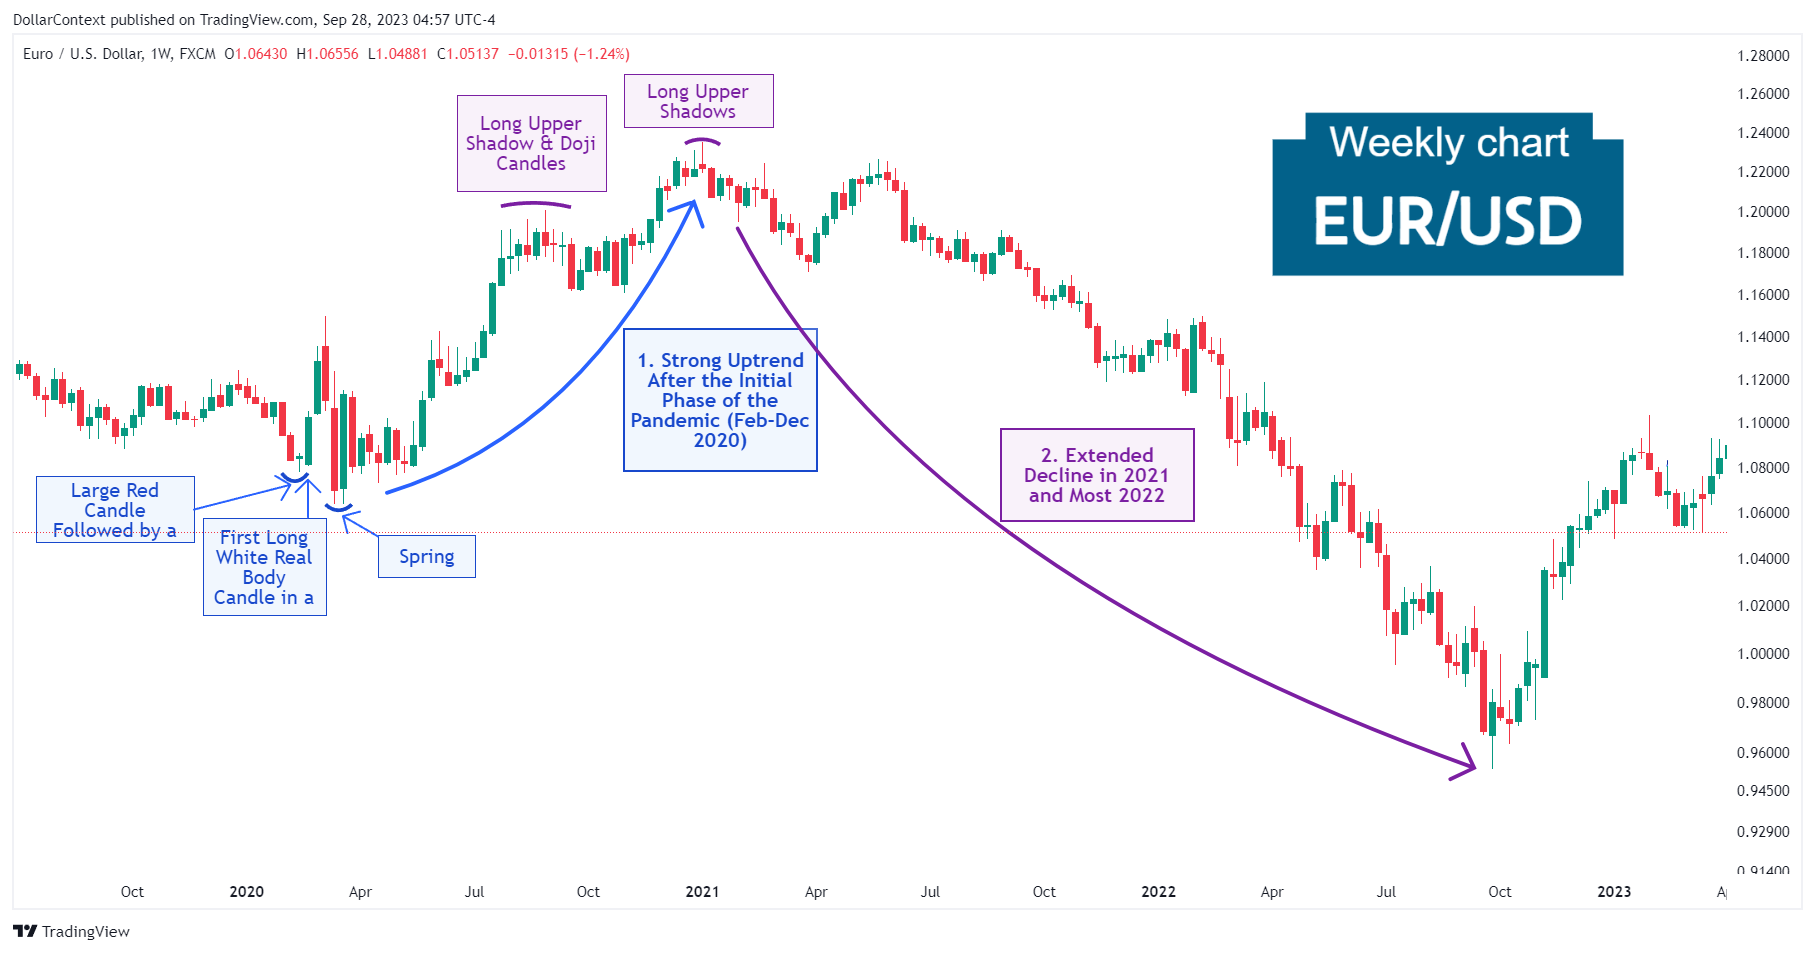
1. February 2020–December 2020: Strong Uptrend After the Initial Phase of the Pandemic
Influenced by the early stages of the pandemic in Europe and the U.S., the EUR/USD experienced pronounced market volatility in early 2020.
From February to March 2020, a sequence of candlestick formations detailed below suggested the potential end of the previous downtrend:
- Large Red Candle Followed by a doji in the first half of February 2020
- Long White Real Body: It's worth noting that this candle was the first tall white (or green) candle in the EUR/USD in a long time.
- Spring: Initially, the pair dipped below the support level set by the doji, but then quickly reversed and moved back above that level, indicating potential strength in the EUR/USD.
2. 2021 and Most 2022: Sustained Downtrend
Throughout 2021, monetary authorities maintained a policy of low-interest rates. However, as inflation figures continued to rise, both the Fed and the ECB initiated a vigorous rate-hiking cycle that remains in effect to this day.
A group of long upper shadow and doji sessions in mid-2020 signaled that the previous trend could be in danger. Instead of reversing, the market staged a brief sideways trend before resuming the last move upward, which concluded with another series of long upper shadows.
3. Late 2022–Mid-2023: Notable Rebound
An unusually tall long red candle in the fourth week of September 2022, which can also be viewed as a selling climax, suggested that the previous decline could be bottoming. A few weeks later, an inverted hammer and a hammer pattern reinforced the bullish reversal hypothesis. This is what unfolded as the EUR/USD displayed a notable recovery from those levels.

4. Outlook for Late 2023 and Throughout 2024
The following perspective reflects expectations based on information and policy signals available at the time of writing.
While the immediate trajectory of the EUR/USD pair remains uncertain, several pivotal elements could shape its forthcoming course:
- AI-Driven Market Sentiment: The rise of artificial intelligence may sway market sentiment, favoring more speculative assets, and therefore the EUR/USD.
- Economic Downturn Concerns: Aggressive interest rate hikes by the Federal Reserve, alongside alarming indicators like the inverted yield curve and other forward-looking economic signals, suggest a potential global economic slump in 2024. The U.S. dollar is often seen as a "safe-haven" currency, especially against the euro. In times of global economic uncertainty or geopolitical tensions, investors might buy dollars.
- Surging Public Debt: A marked uptick in the federal government's deficit prompts worries about mounting national debt. This development might influence the USD's valuation in the upcoming years.