
USD/JPY: Evolution and Outlook
We cover the primary forces that have influenced the trajectory of the USD/JPY since 2009 and conclude by delving into potential factors that could steer the future of this market.

In this article, we'll explore the primary forces that could have influenced the trajectory of the USD/JPY pair since 2009. We'll conclude by delving into potential factors that could steer the future of this market.
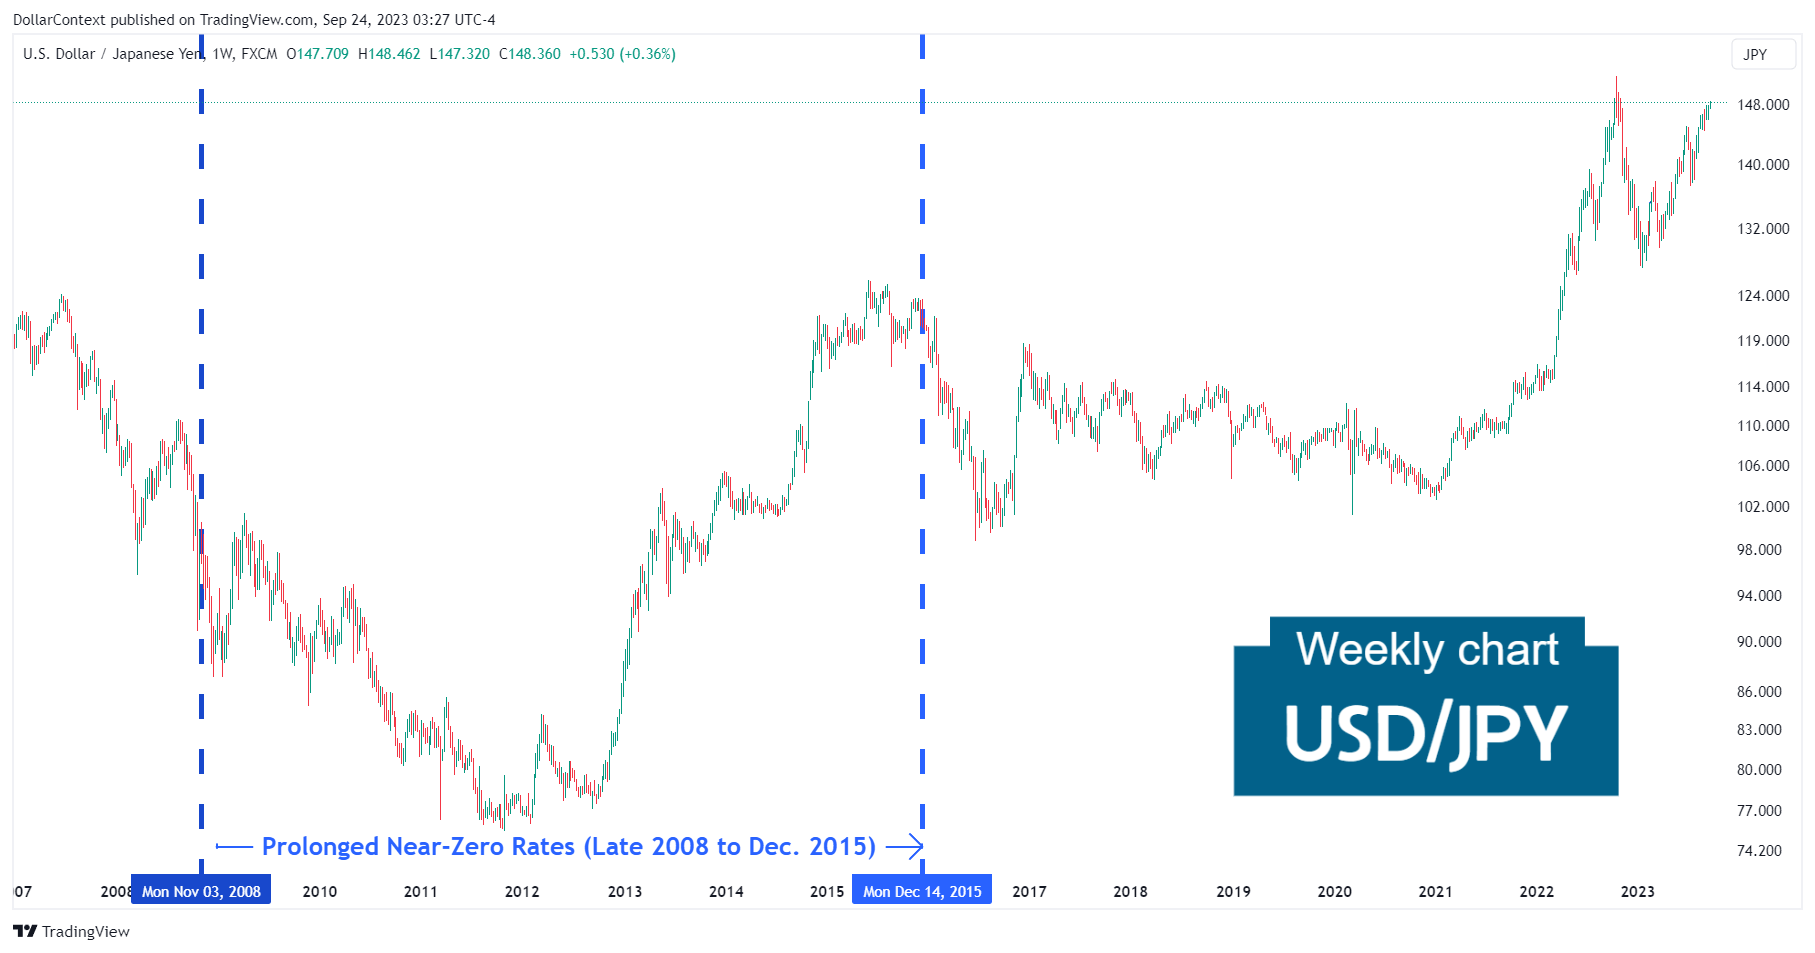
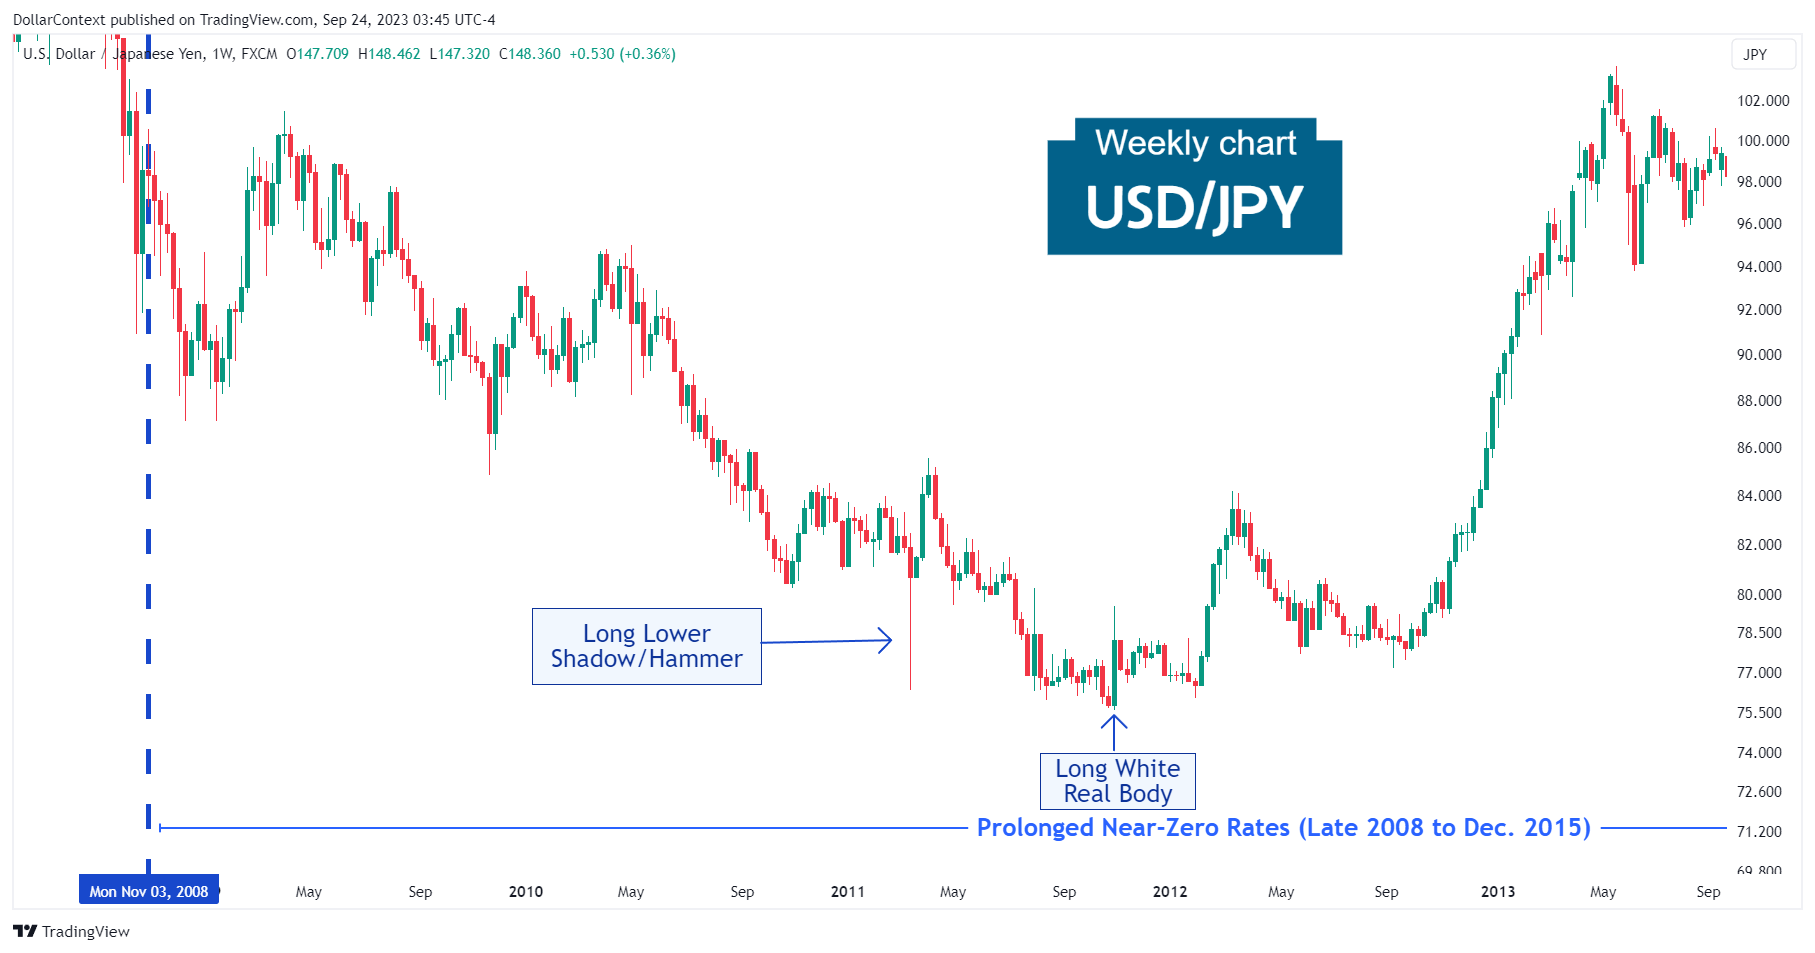
1. Late 2008–December 2015: Prolonged Near Zero-Rates
Federal Reserve: During this period, the Federal Funds rate remained in the range of 0% to 0.25%. This extended span of near-zero interest rates was a response to the 2008 financial crisis. The Fed aimed to stimulate borrowing, investment, and consumption to support the U.S. economy's recovery.
Bank of Japan: As Japan grappled with deflationary challenges and economic stagnation, the Bank of Japan (BoJ) also maintained its policy rate near 0% during this period.
The yen is often seen as a "safe-haven" currency. In times of global economic uncertainty or geopolitical tensions, investors tend to buy yen, leading to appreciation. Conversely, in times of global economic growth, the yen might depreciate as investors seek higher returns elsewhere.
The USD/JPY dipped during roughly the initial half of this period and surged notably in the latter half.
A closer examination of the chart below illustrates that an important long lower shadow, which can also be viewed as a hammer pattern, signaled a possible conclusion of the preceding downtrend. Observe how the pair subsequently made a classic retracement to test the support established by this long lower shadow.
The long white real body in the first week of November 2011 bolstered the case for a reversal. This is what unfolded as prices soared from these levels.
2. January 2016–December 2018: The Federal Reserve's Gradual Rate Hikes
In early 2016, the Fed began a series of nine rate hikes, taking the Federal Funds rate from the 0%-0.25% range to a range of 2.25%-2.50% by December 2018.
In a surprising move, the BoJ introduced a negative interest rate policy (January 2016), setting the rate at -0.1% for certain excess reserves held by financial institutions at the central bank.
Within this framework, the USD/JPY displayed an initial decline that bottomed in July 2016 with a long white real body.
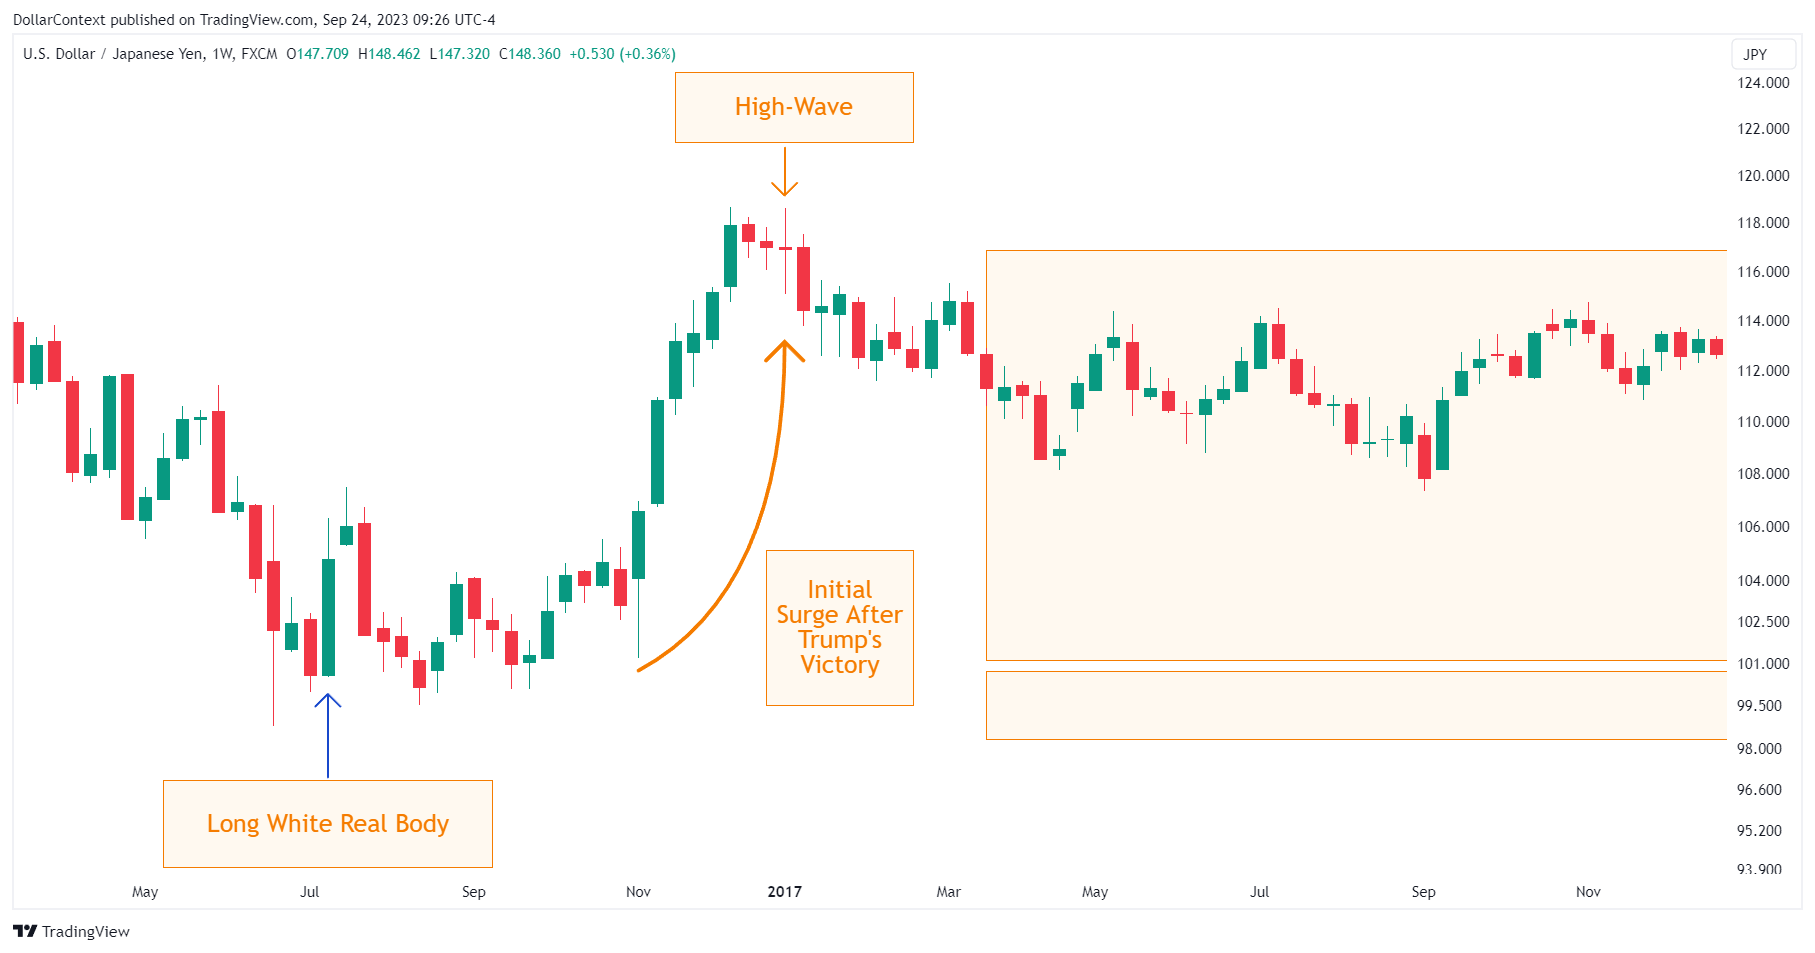
The catalyst for the next market's surge came from the results of the US presidential elections in November 2016. Contrary to the majority of market predictions and polls, which anticipated a Hillary Clinton victory and a significant dollar drop if Donald Trump triumphed, the actual outcome was quite the opposite. Donald Trump clinched the win, and the dollar soared. Then, after a six-week rally, the market entered a broad sideways range that lasted for over five years.
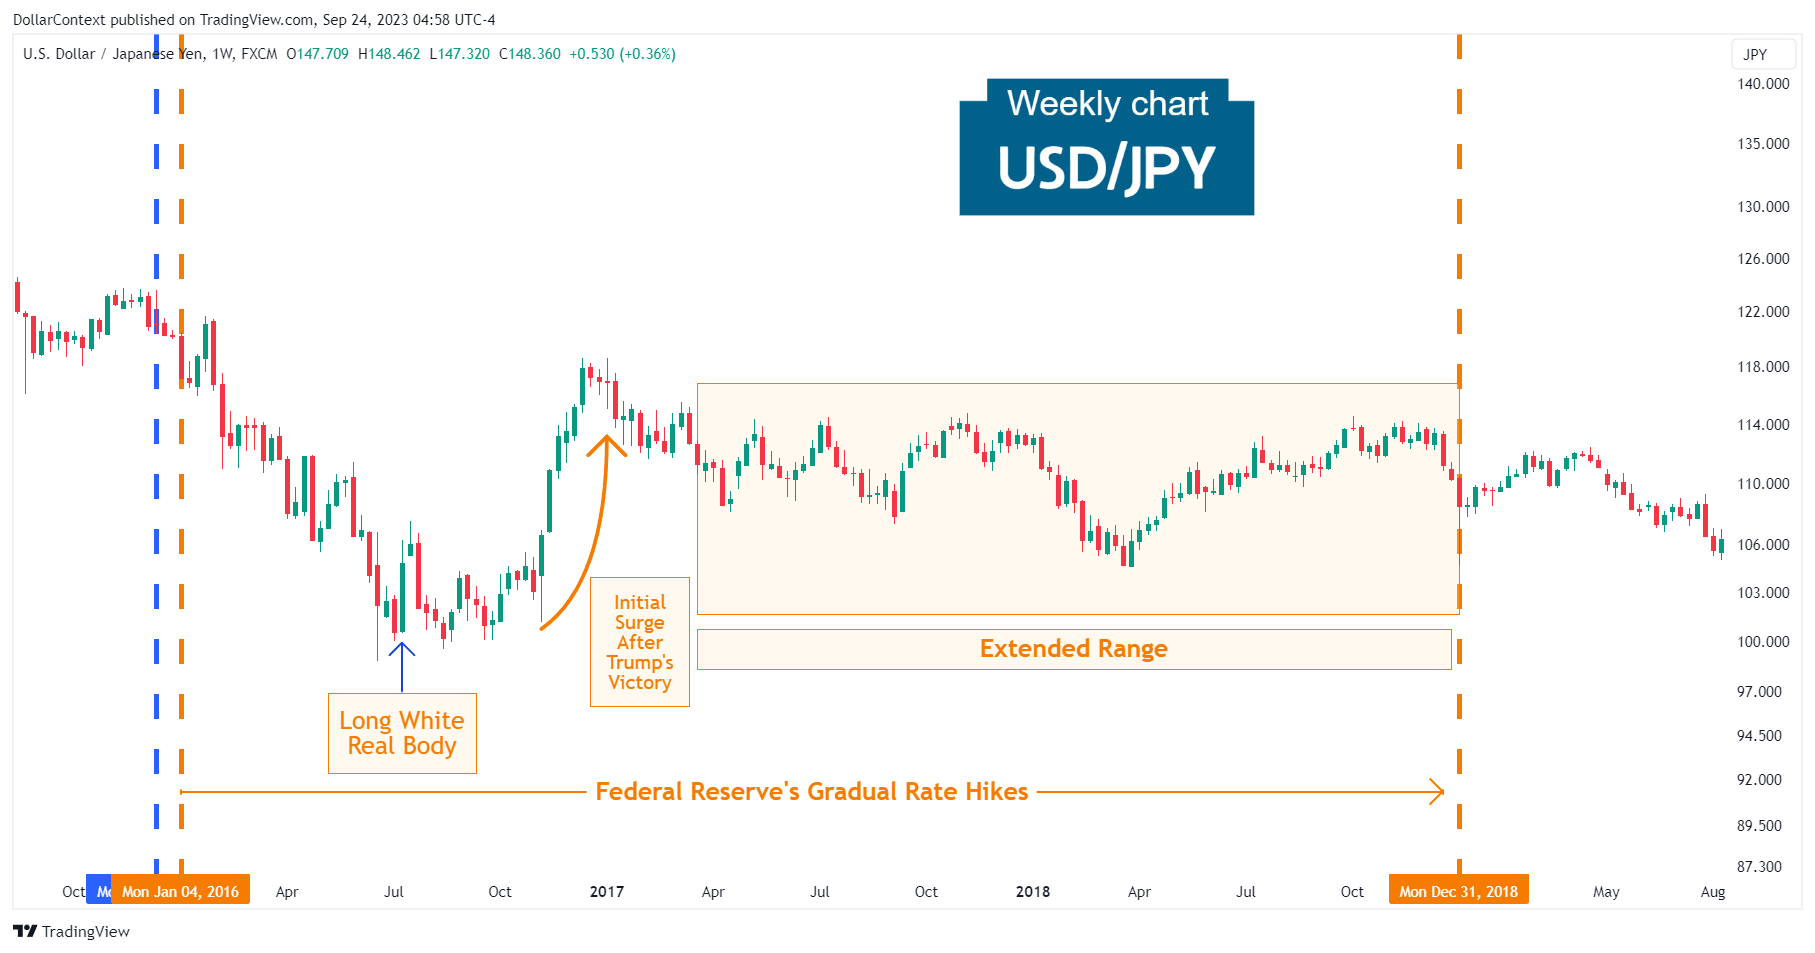
A closer look at the chart above shows that the steep upward move culminated in a high-wave candle.
3. January 2019–March 2022: Rate Reductions and Emergency Measures During the Pandemic
In 2019, the Fed reversed course and implemented three rate cuts, bringing the Federal Funds rate to a range of 1.50%-1.75% by October 2019. The primary factors behind this new policy included:
- Global Economic Slowdown: Slowing global growth, exacerbated by trade tensions (especially between the U.S. and China), prompted the Fed to adopt a more accommodative stance.
- Muted Inflation: Despite a tight labor market, inflation remained below the Fed's 2% target for extended periods.
- Financial Market Volatility: The Fed responded to significant financial market volatility and concerns about the global economic outlook.
Despite these aggressive measures implemented by the BoJ, Japan continued to grapple with low growth and inflation rates. The challenges posed by an aging population, high public debt, and structural issues in the economy made it difficult for monetary policy alone to achieve the desired outcomes.
In response to the economic threat posed by the COVID-19 pandemic, the Fed made two emergency rate cuts in March 2020, bringing the Federal Funds rate back down to the range of 0%-0.25%.
The USD/JPY pair extended its sideways range until 2021.
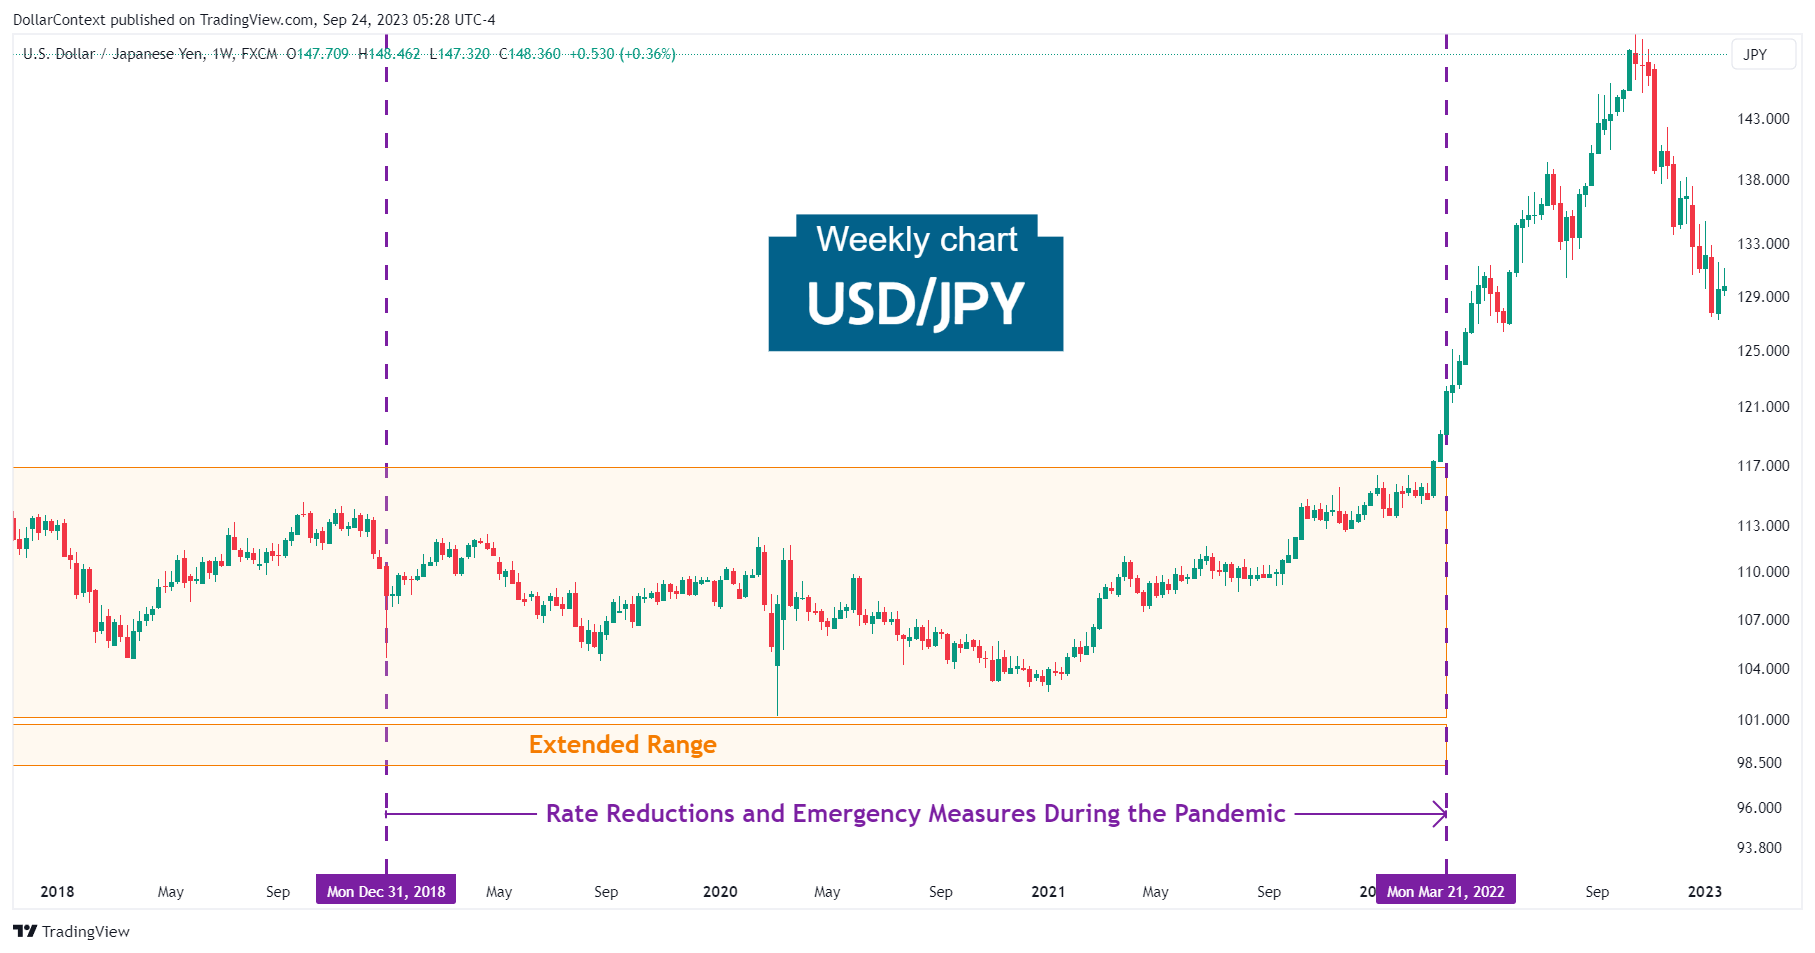
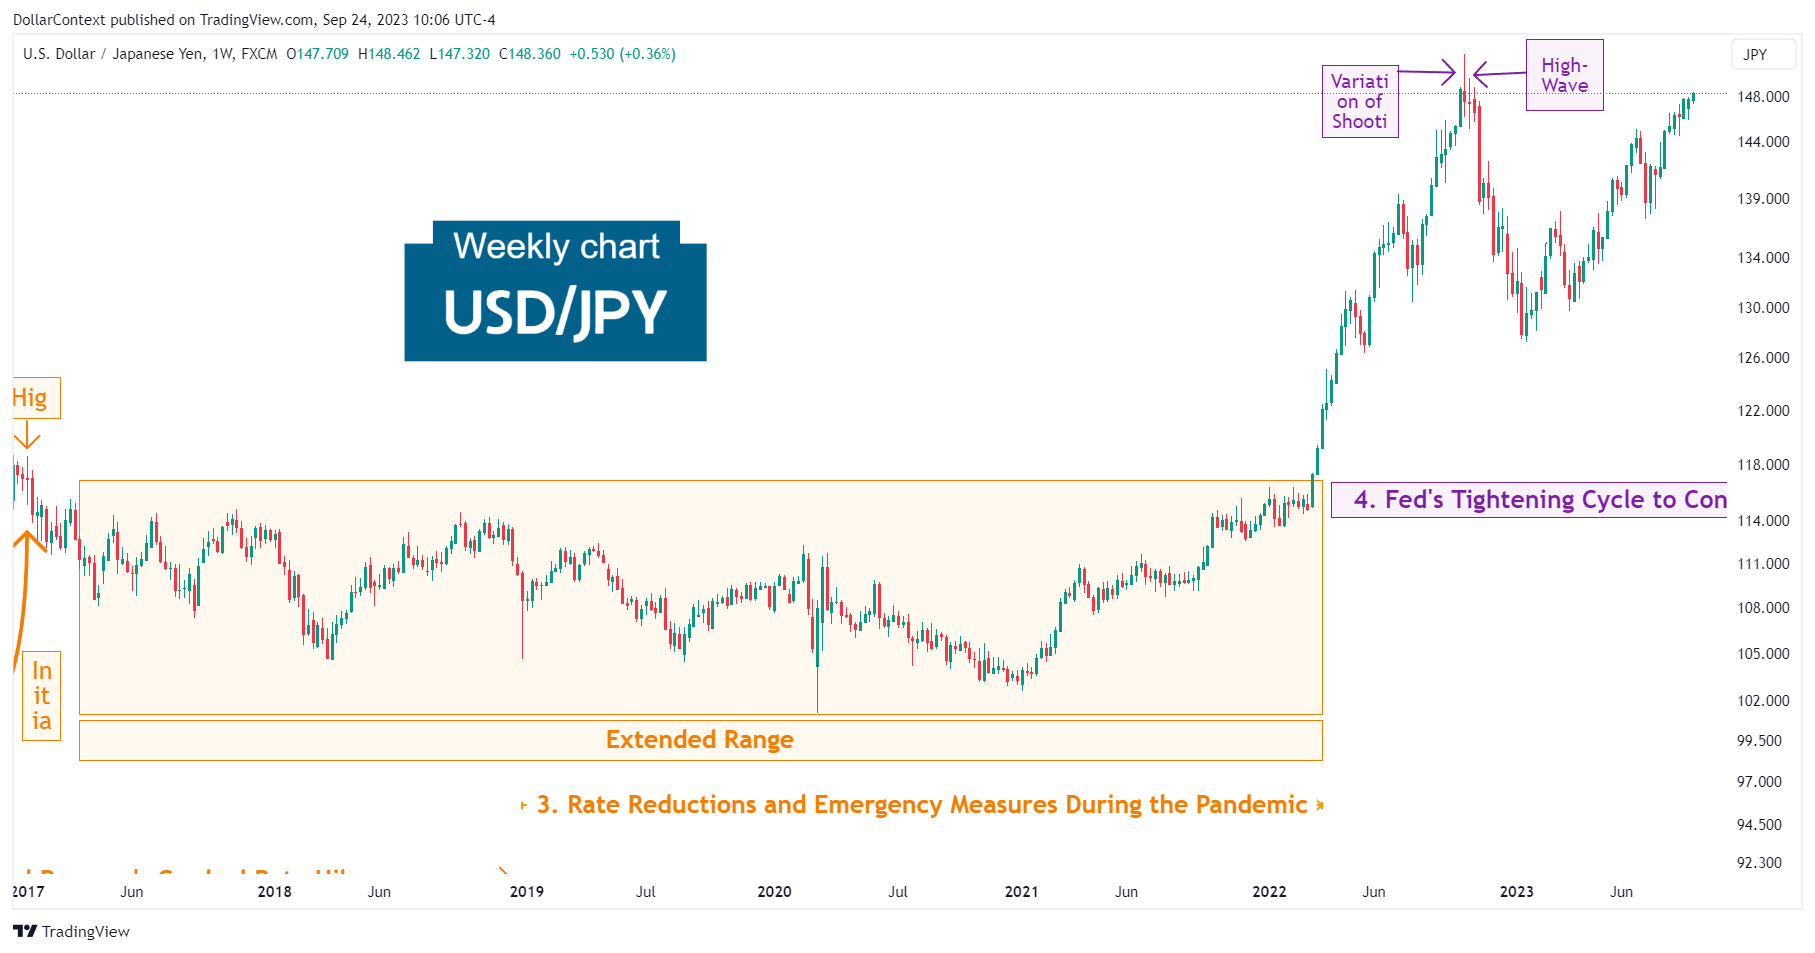
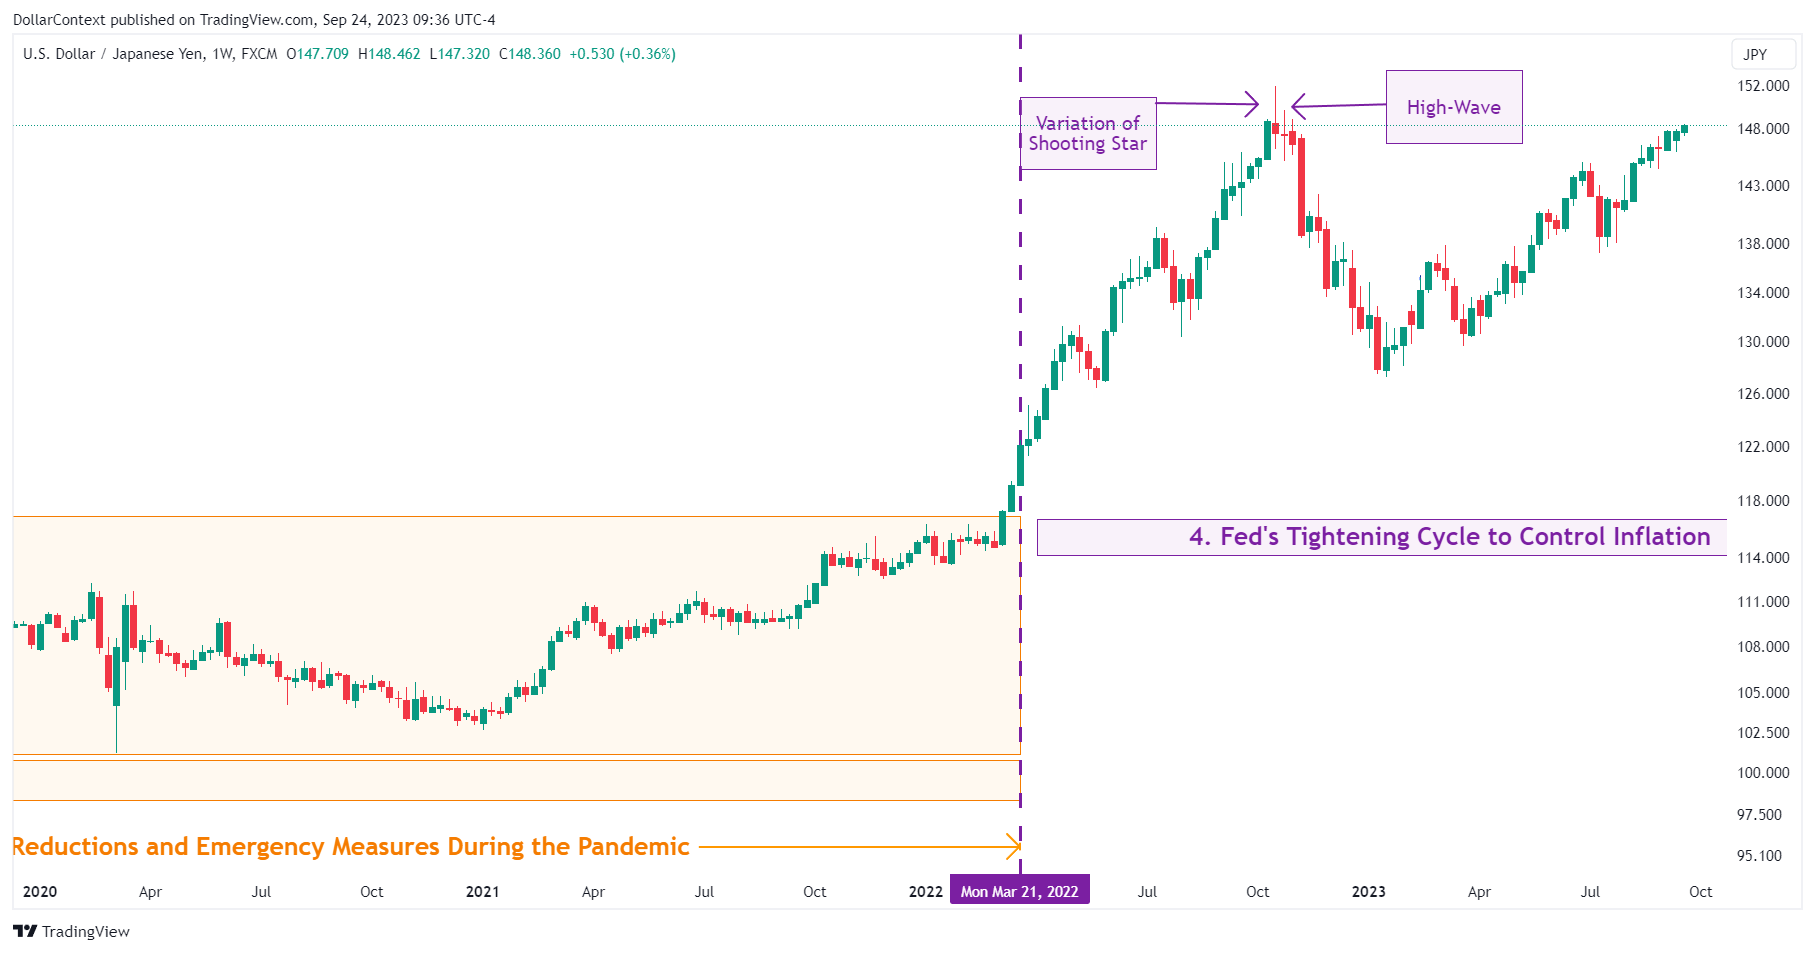
4. April 2022–September 2023: The Central Bank's Move Towards Monetary Tightening
Escalating worries about inflation prompted the Federal Reserve to undertake a rapid succession of steep interest rate increases, taking rates from nearly 0% to over 5% within approximately 18 months. Their objective was to curb inflation and moderate economic expansion. This shift toward a stricter monetary policy spurred bullish momentum in the USD. Consequently, the USD/JPY departed from its lateral trajectory, hitting the 151.65 mark in October 2022.
Negative market sentiment toward a potential recession: The swift series of rate increases executed by the Fed, combined with the bearish signals from key recession indicators such as the yield curve and the PMI, led to a notable pullback in the USD/JPY from October to mid-January 2022. A variation of a shooting star followed by a high-wave candle marked the top of the upward move.
In January 2023, the pair experienced a robust resurgence to near the previous highs, probably fueled by a heightened risk appetite and the beginning of the new AI-driven era.
5. Outlook for Late 2023 and Throughout 2024
Although the short-term direction of the USD/JPY pair remains unclear, various key factors might influence its future path:
- AI and Productivity Boost: The emergence of the AI revolution might have influenced market sentiment, tilting it towards a preference for riskier assets.
- Worries of Economic Downturn: Steep interest rate increases by the Federal Reserve, combined with worrisome indicators such as the inverted yield curve and other predictive economic signs, hint at a potential economic downturn in 2024 and a subsequent decline in the dollar's value.
- Growing Public Debt: The federal government's deficit has seen a significant increase, a trend that inevitably raises concerns regarding the nation's escalating debt levels. This could potentially impact the valuation of the USD in the foreseeable future.


