
DJIA: Evolution and Outlook
We explore the drivers that have shaped the trajectory of the DJIA since 2020 and provide our insights on the potential factors that might influence this market moving forward.

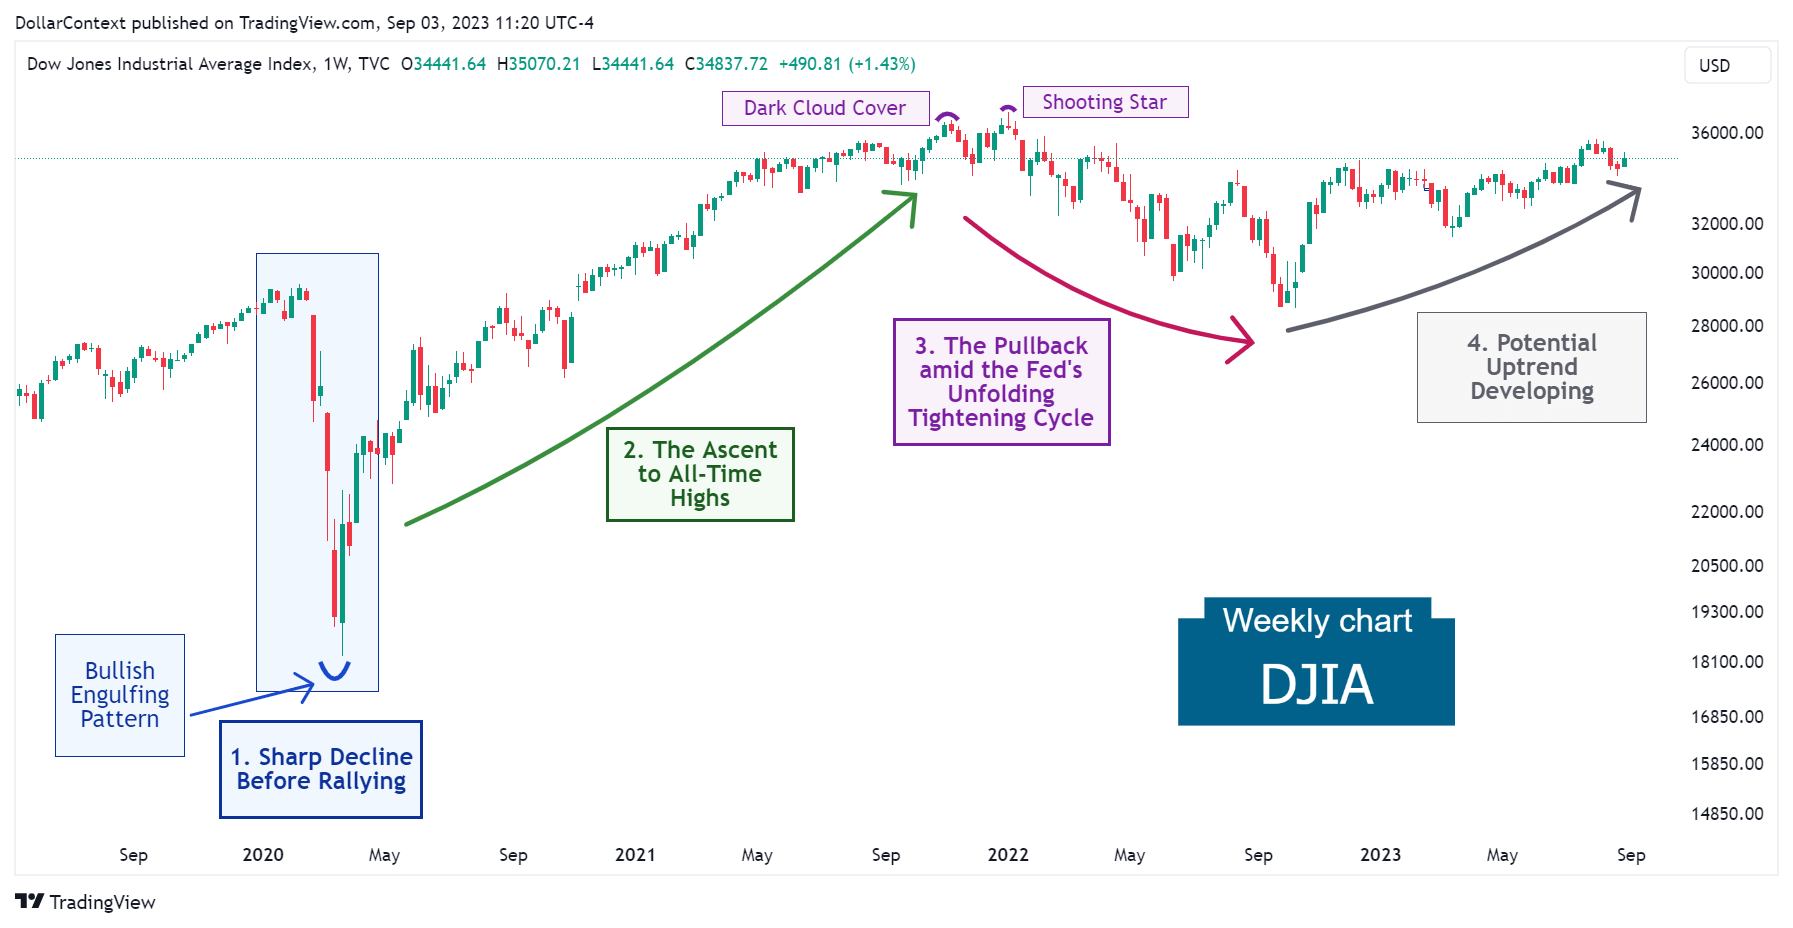
In this post, we'll explore the dynamics and drivers that have shaped the trajectory of the Dow Jones Industrial Average index since 2020. We'll wrap up with our insights on the potential factors that might influence this market moving forward.
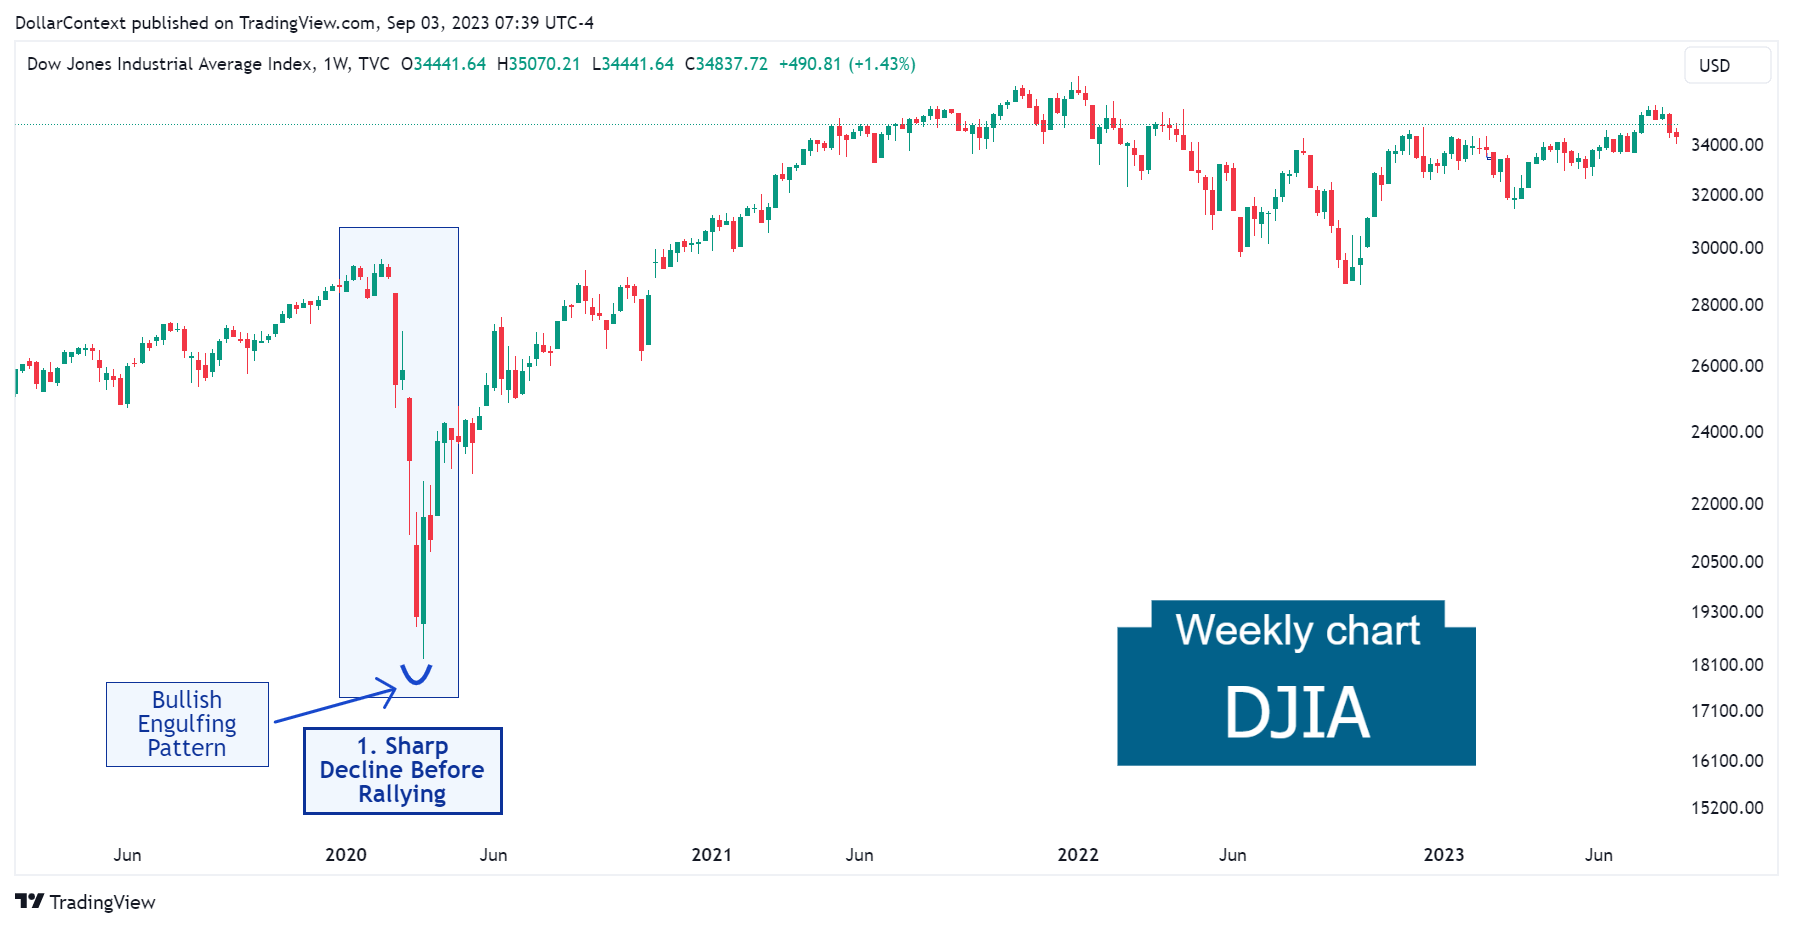
1. January 2020–April 2020: The Turbulent Times of the Pandemic
The initial months of 2020 saw considerable market volatility in U.S. stock indexes. The DJIA benchmark, in particular, was swayed by a mix of health, economic, and financial considerations.
- COVID-19 Pandemic: The onset of the COVID-19 pandemic was the major disruptor in 2020. As the virus spread globally and lockdown measures were enforced, there was extreme uncertainty about its potential economic impact. This led to a sharp market sell-off in March, with indexes like the DJIA, S&P 500, Nasdaq-100, and NASDAQ Composite experiencing rapid declines.
- Monetary Policy: In response to the economic threat posed by the pandemic, the U.S. Federal Reserve implemented aggressive monetary policies. This included slashing interest rates to near-zero and the launch of extensive quantitative easing programs. These actions, aimed at bolstering the economy, also provided liquidity to the financial markets, contributing to the swift recovery of the DJIA index after the initial collapse.
- Economic Data: Throughout the year, economic data releases played a role in market movements. The unpredictability of employment numbers, GDP growth rates, and other economic indicators due to the pandemic’s impact often led to the DJIA swings during this period.
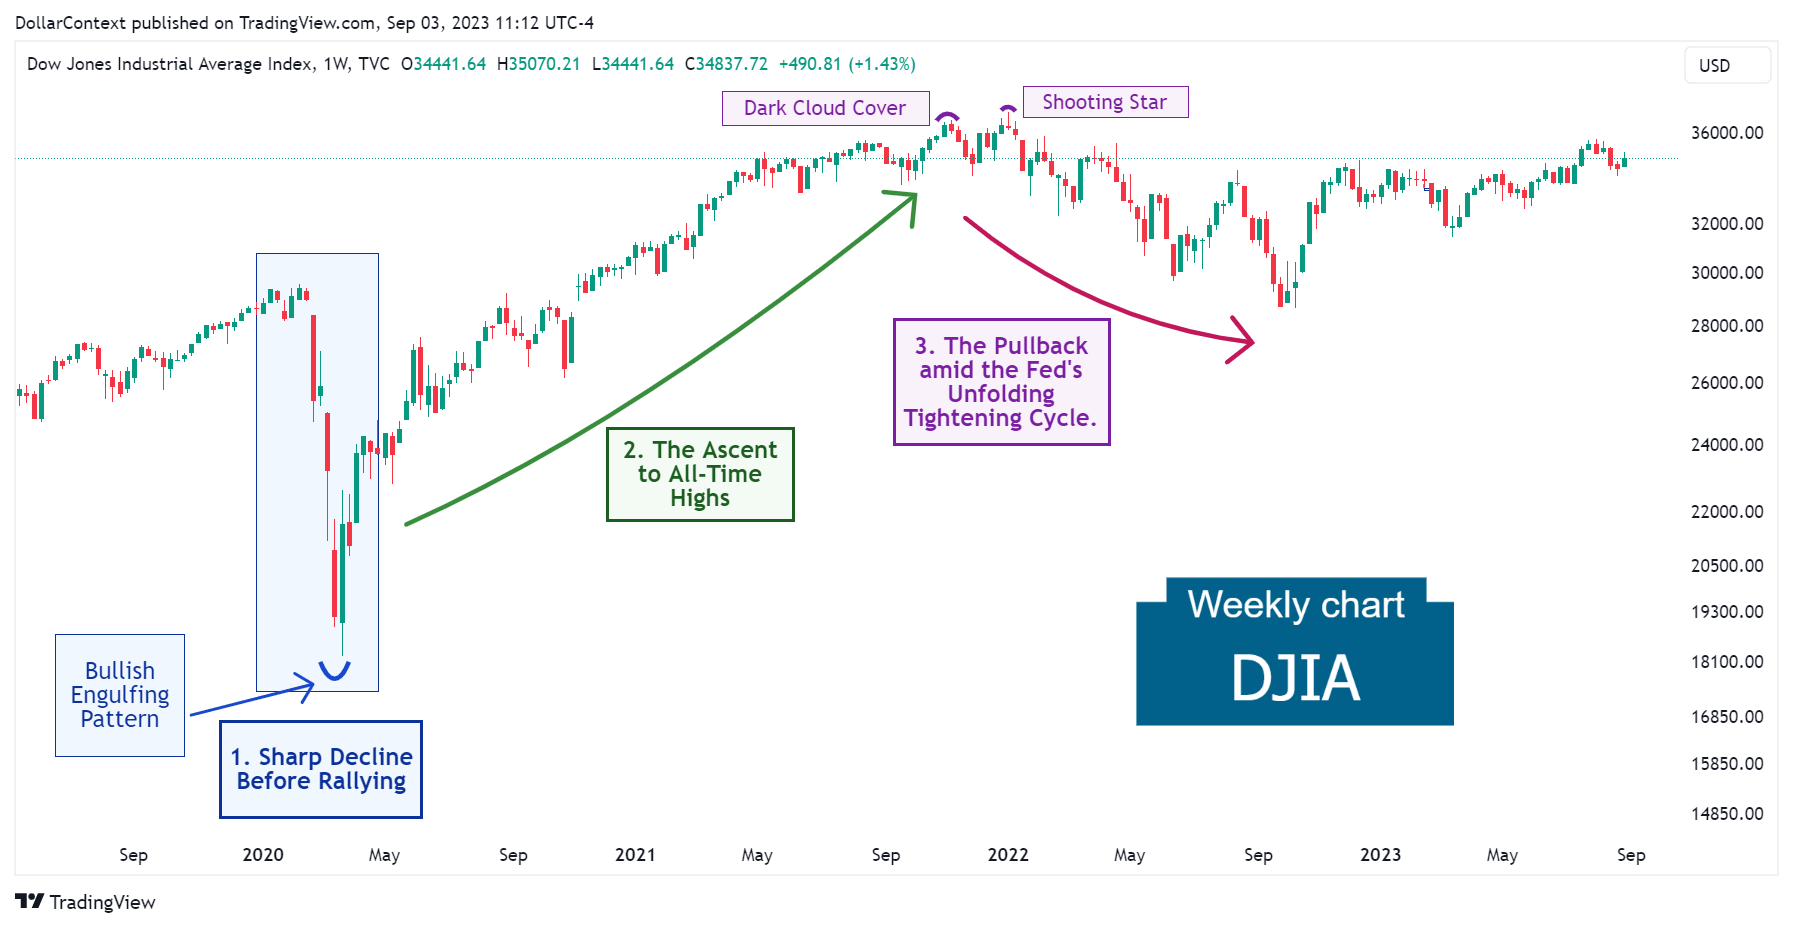
From a candlestick analysis perspective, note how the meltdown in March 2000 concluded with a bullish engulfing pattern. This candle formation also signaled the onset of an imminent uptrend.
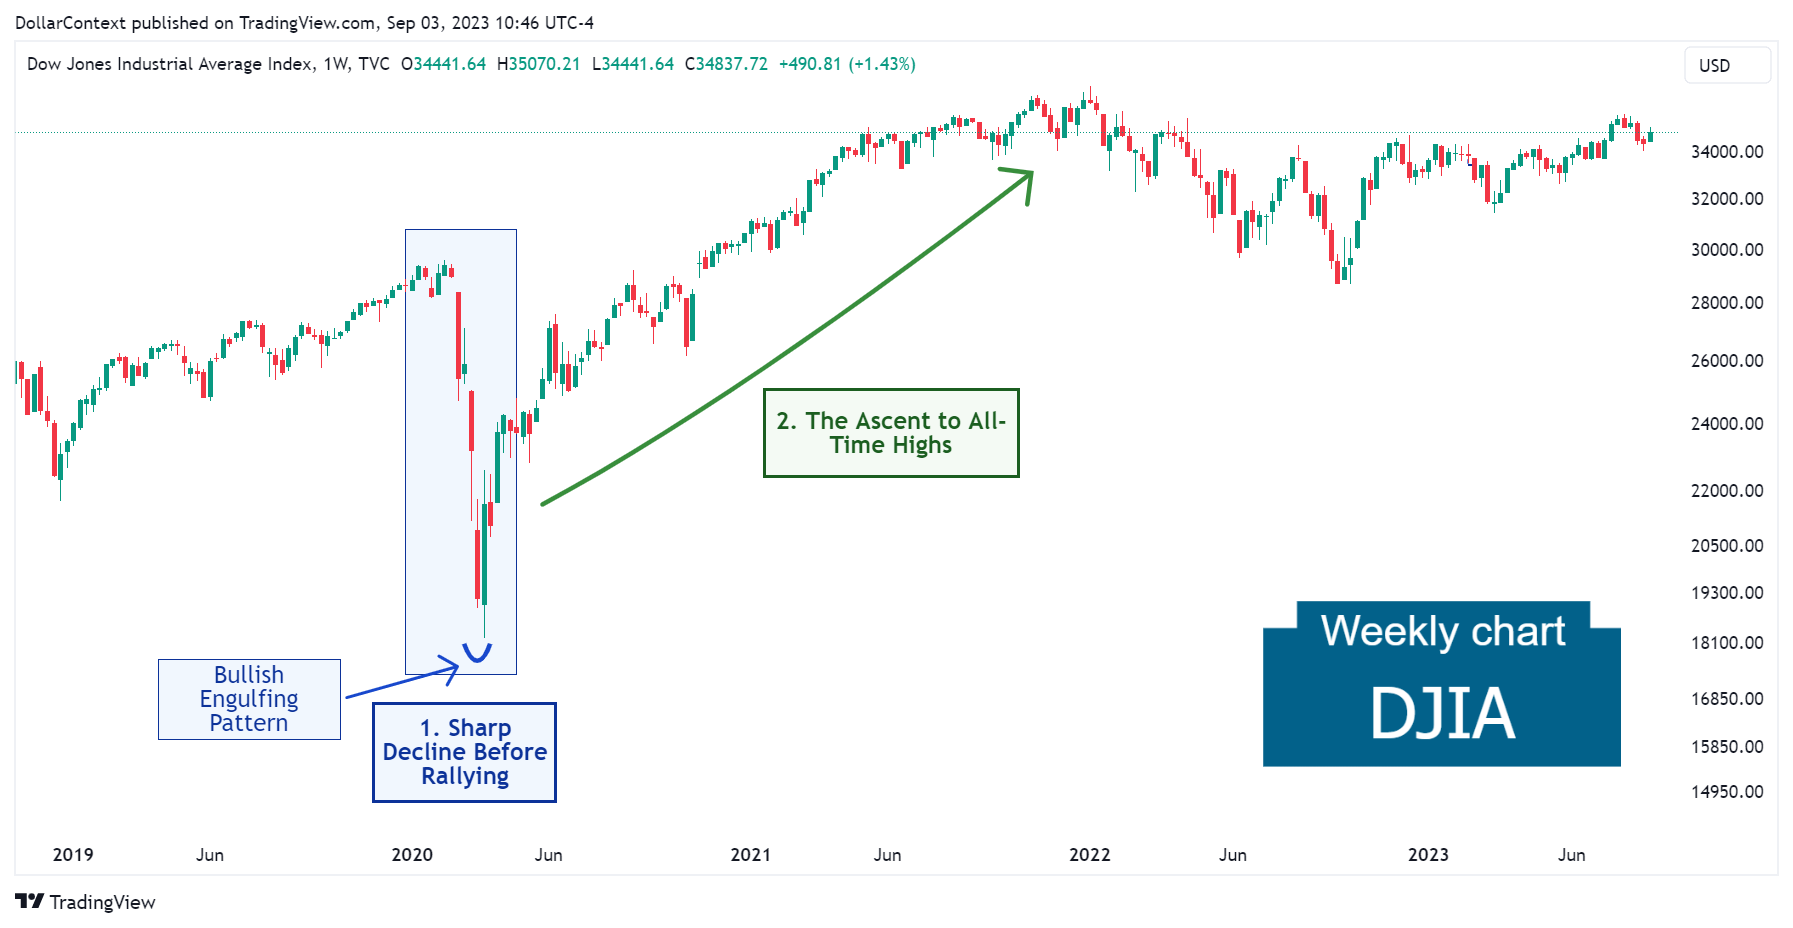
2. May 2020–January 2022: The Ascent to All-Time Highs
In the latter part of 2020, a ray of optimism emerged as the market found stability and a rapid recovery of the DJIA index was set in motion. The following factors contributed to this upward trend:
- Tech Stock Rally: While many sectors suffered due to the pandemic, technology companies, especially the big names like Apple and Microsoft, saw a surge in their stock prices. The reliance on technology during lockdowns, the acceleration of trends like remote working, and the growth in e-commerce contributed to this rally.
- Vaccine Optimism: Towards the end of 2020, positive news regarding the development and potential approval of COVID-19 vaccines provided optimism. The prospect of a return to normalcy with vaccine rollouts led to positive market sentiment.
- Liquidity Injections and Fiscal Stimulus: In the latter half of 2020, the Federal Reserve undertook substantial liquidity injections into the financial system. These interventions involved the central bank purchasing government securities and mortgage-backed securities, injecting fresh capital into the markets. The primary aim was to enhance market stability, support lending activities, and mitigate the economic impact of the ongoing pandemic. By providing ample liquidity, the Federal Reserve aimed to ensure that financial institutions could function smoothly and facilitate economic recovery.
With the global economy displaying indications of stabilization and gradual recovery throughout 2021, the Dow Jones Industrial Average continued its upward trend.
From a candlestick analysis perspective, a more detailed look at the chart shows that the initial peak of the trade was marked by a dark cloud cover in November 2021. Then in January 2022, the appearance of a shooting star pattern reinforced the resistance area set by the dark cloud cover while increasing the probability of an imminent reversal.
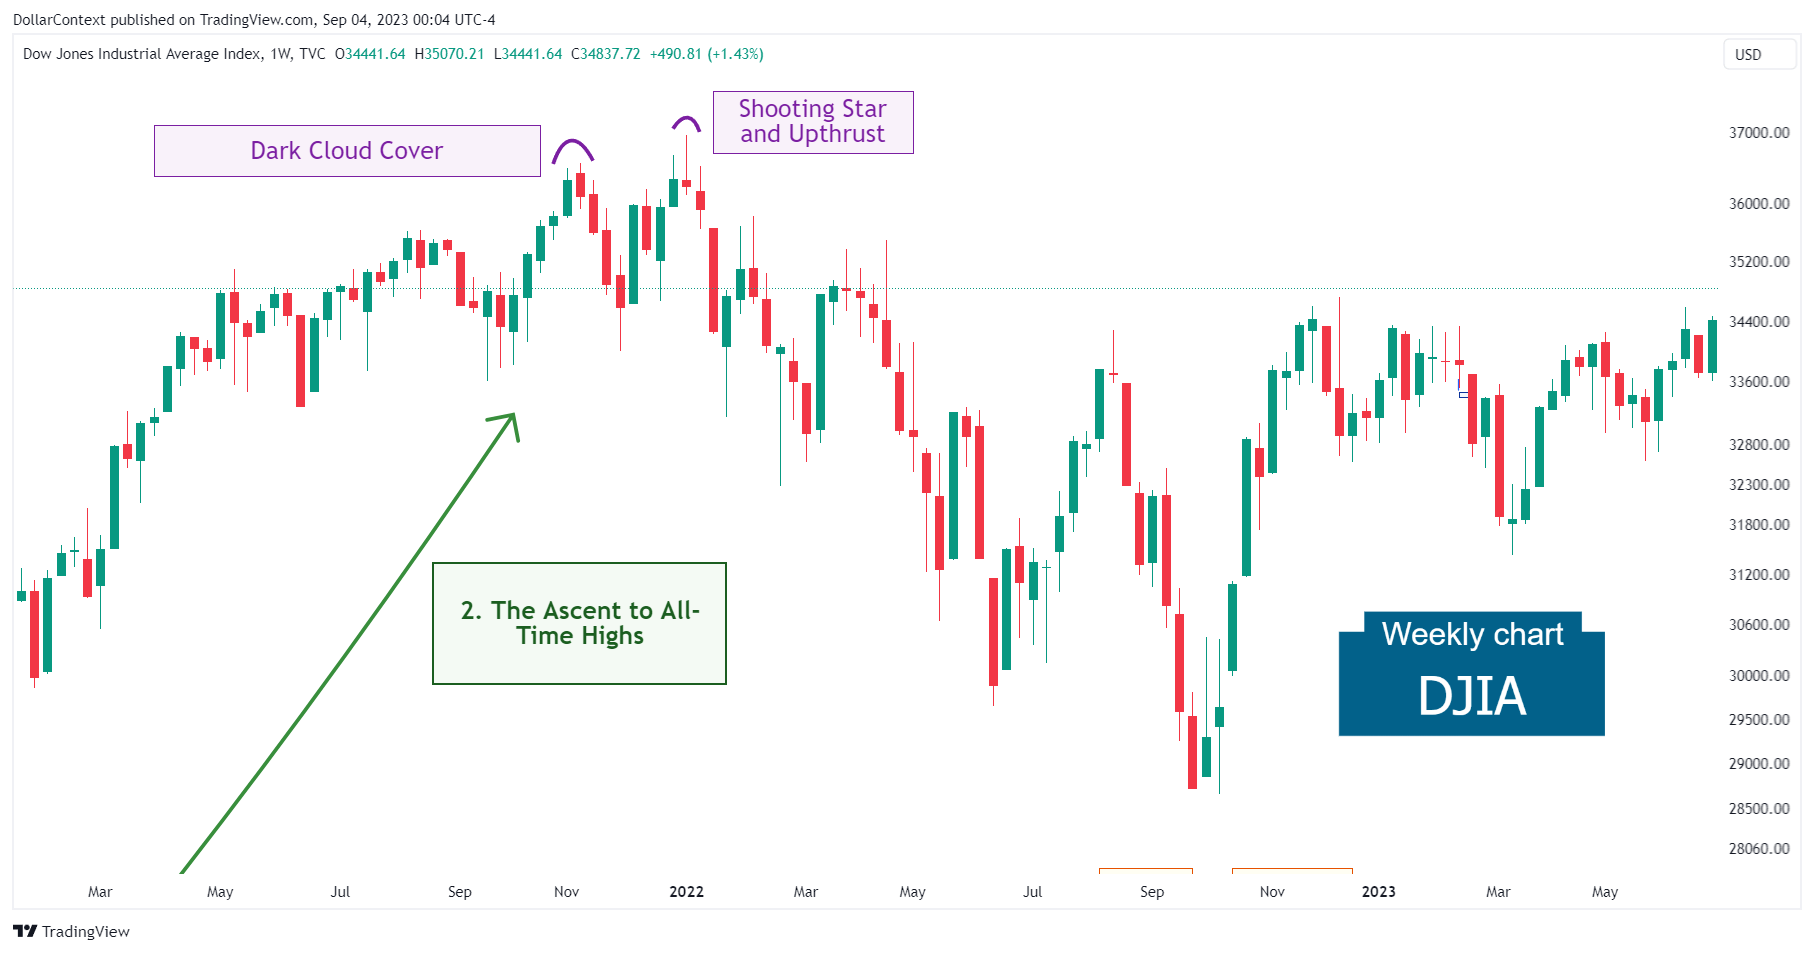
3. February 2022–September 2022: The Correction
Surging inflation indicators led the Federal Reserve to embark on an aggressive cycle of interest rate hikes, aimed at countering inflation and moderating economic activity.
The U.S. Central Bank's shift towards tightening contributed to a pessimistic outlook in the equity market. This sentiment was subsequently manifested through a substantial correction.
Technically, the downward move ended with an inverted hammer and a high-wave candle in October 2022.
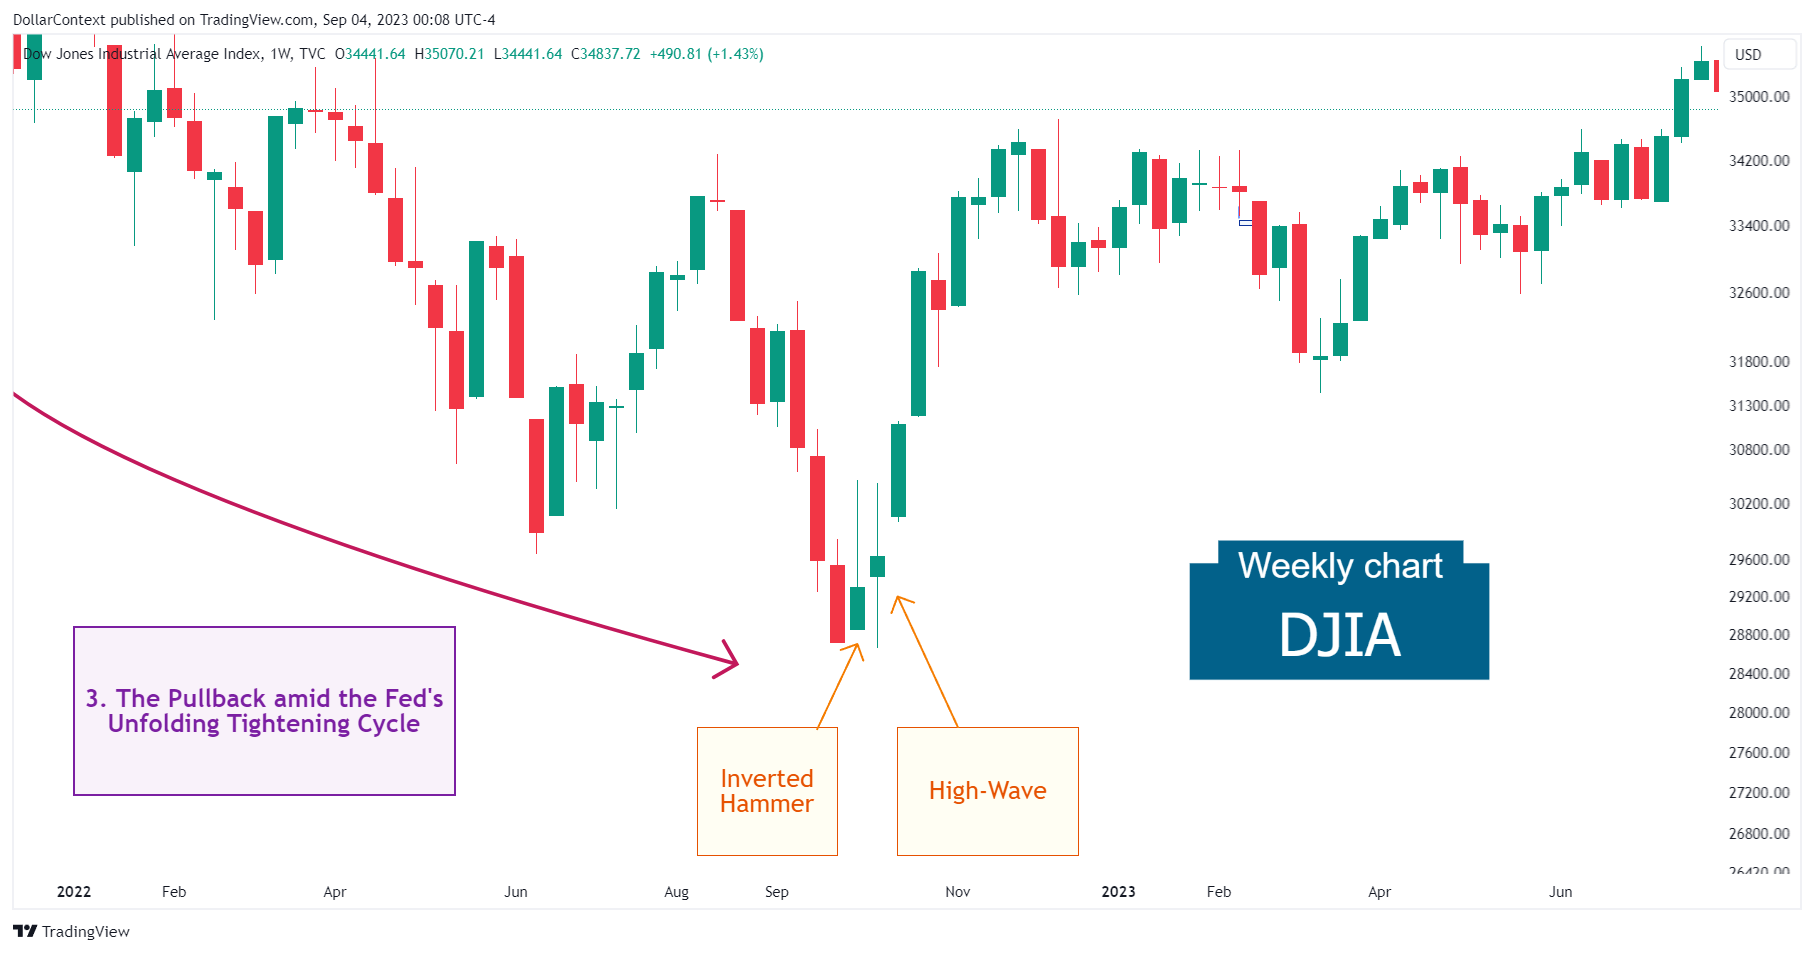
4. From October 2022 Onward: The Rebound
During October 2022, in the context of a prevailing bearish sentiment in the equity market along with an inverted yield curve, the DJIA initiated a recovery that is now nearing its historical peak.
Although the immediate future remains uncertain, there are several factors worth keeping in mind moving forward:
- Potential Economic Slowdown Risks: The Federal Reserve's bold interest rate hikes, combined with concerning indicators like the inverted yield curve, point toward a potential economic downturn in 2024. In times of economic recession, investors frequently shift from equities to bonds, which typically result in decreased stock valuations.
- Market Responses to an Inverted Yield Curve: Historical data shows that the appetite for high-risk assets, like equities, usually remains strong either at the beginning or throughout a yield curve inversion. The shift towards safer assets and the subsequent equity decline generally occurs during the later phases, typically when the curve begins or completes a "reinversion".
- AI's impact on improving productivity: As we embrace the age of artificial intelligence (AI), its capacity to enhance efficiency and productivity appears to be a notable factor driving the increasing willingness to take on equities and equity indexes.


