Nasdaq-100: Evolution and Outlook
We examine the main factors shaping the Nasdaq-100 since 2020 and speculate on its future trajectory.
This analysis reflects market conditions and information available at the time of publication (September 2023). It is provided for educational and historical context.
In this article, we'll explore the primary drivers, both fundamental and technical, that have influenced the trajectory of the Nasdaq-100 index from 2020 onwards. We'll conclude with a look at factors that could steer the future path of this market.
1. January 2020–April 2020: Steep Drop Followed by a Rapid Rebound
In early 2020, the Nasdaq-100, like many global indices, experienced significant volatility, primarily due to the outbreak and rapid spread of the COVID-19 pandemic.
Here's a summary of the Nasdaq-100's performance in early 2020:
- Pre-COVID Peaks: The Nasdaq-100, riding a prolonged bull market, began the year on a strong note, reaching record highs in mid-February.
- Swift Decline: As the reality of the COVID-19 pandemic became clear and countries began implementing strict lockdowns and travel bans, markets worldwide plummeted. The Nasdaq-100 was no exception, with the index experiencing a rapid decline from its February highs.
- Tech Resilience: Despite the broad market sell-off, many technology companies in the Nasdaq-100 showed resilience, particularly those involved in cloud services, e-commerce, and other digital services. These businesses saw an increased demand due to work-from-home and social distancing measures.
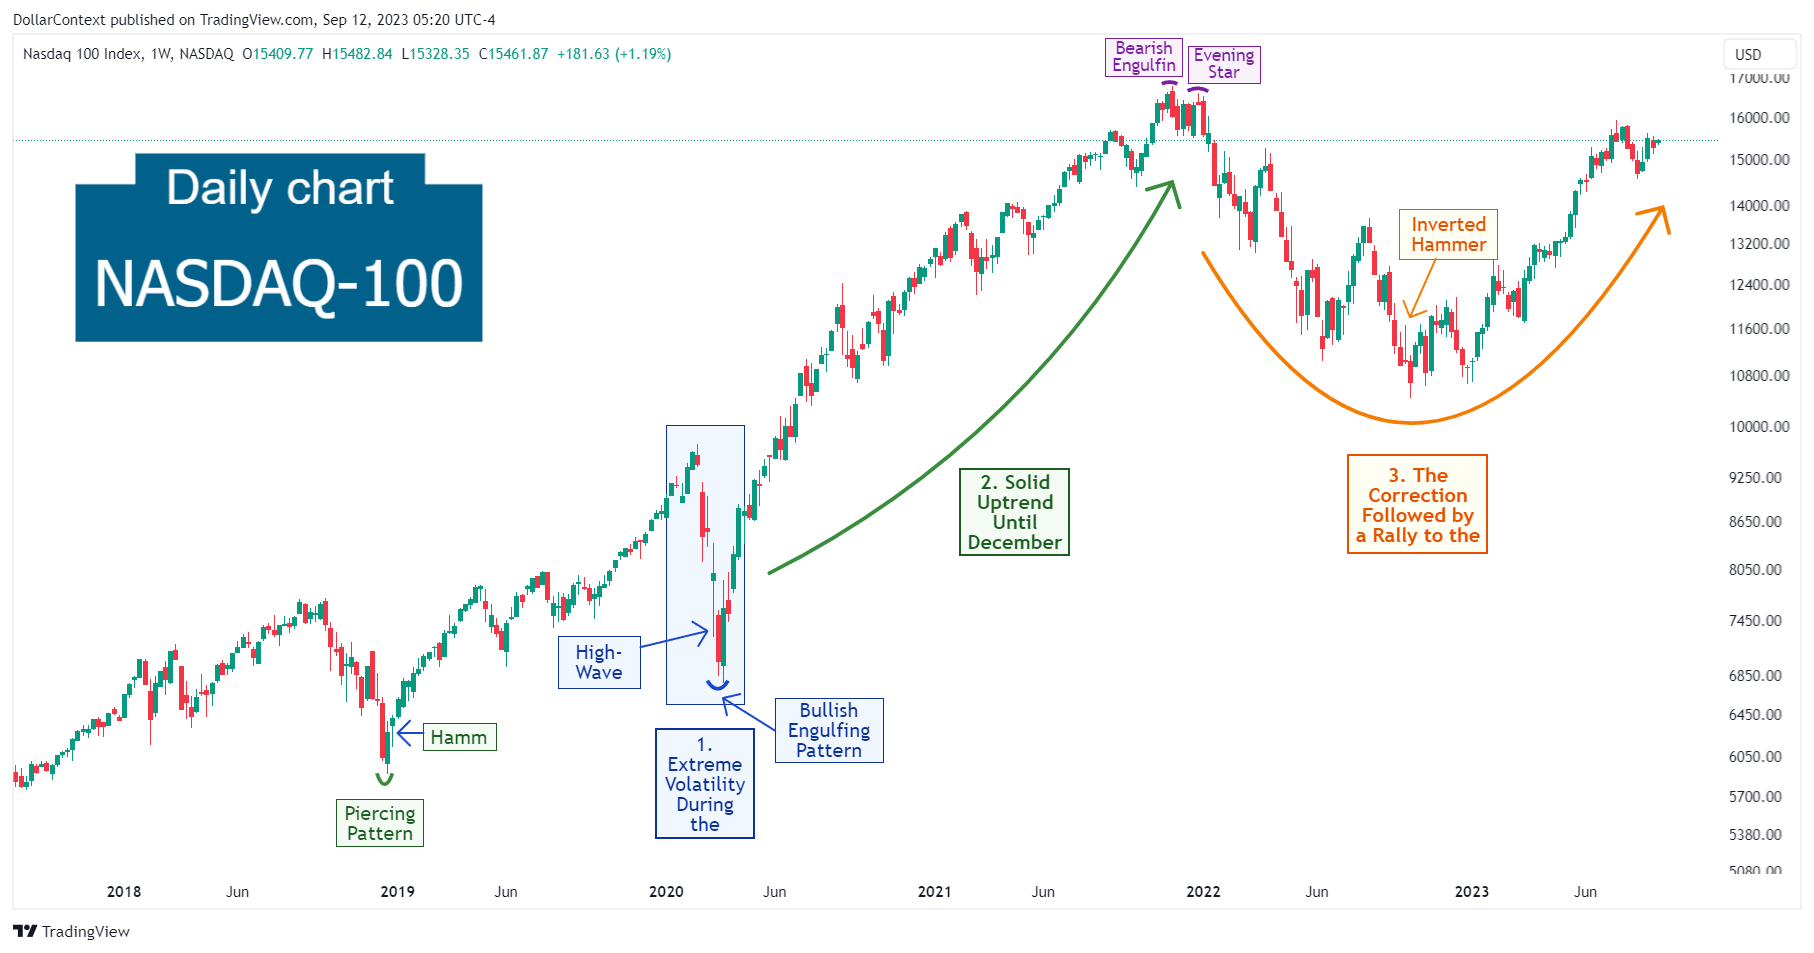
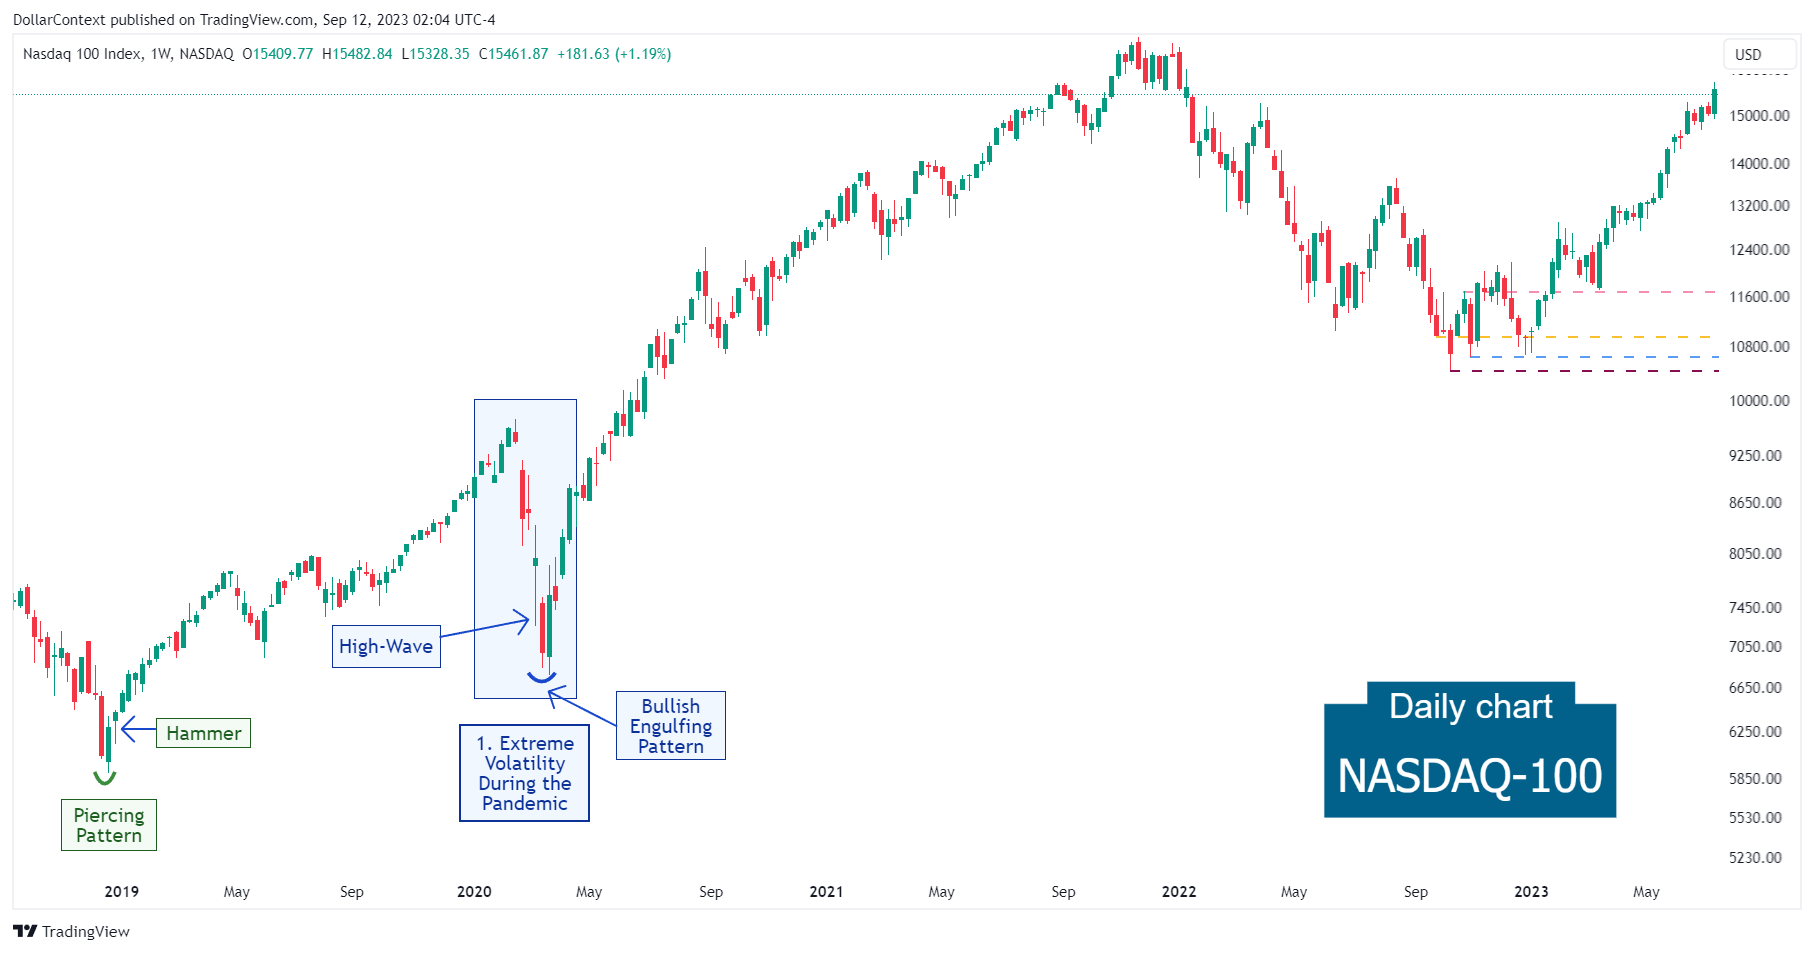
Technical Analysis: In contrast with the SP&500 and the DJIA performance, the December 2018 low of the Nasdaq-100 (characterized by a piercing pattern and a hammer) was not surpassed by the lows witnessed in March 2020.
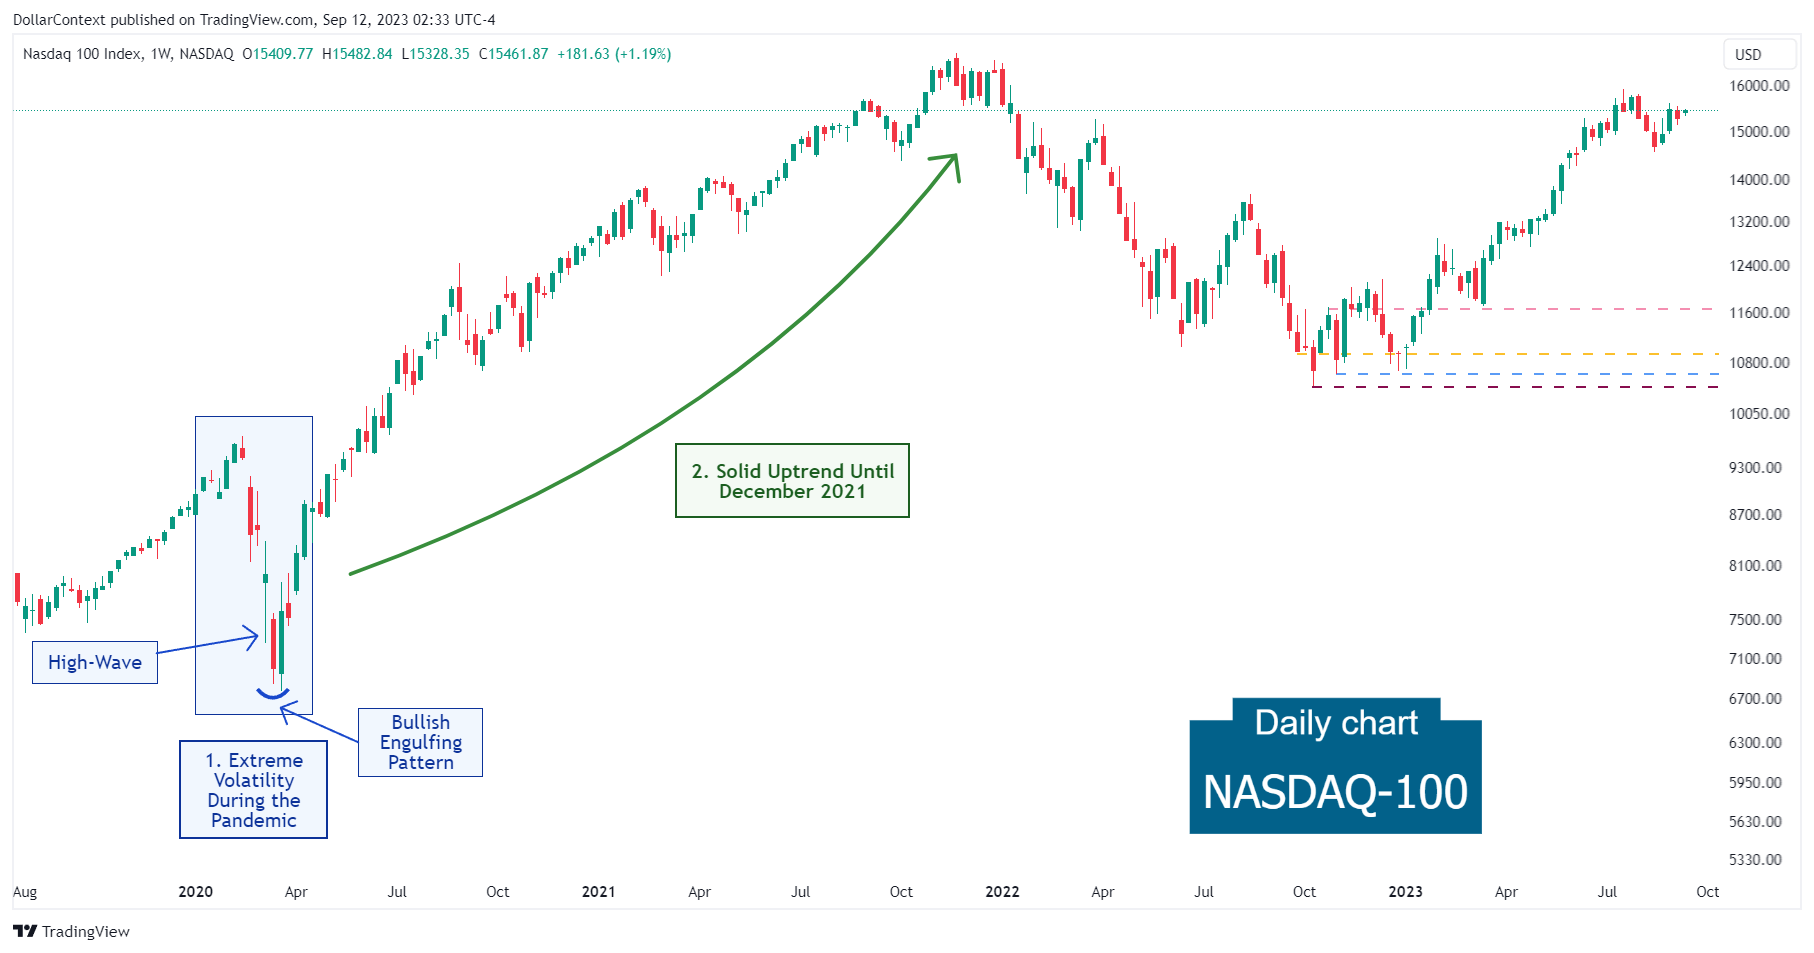
Observe how the end of the steep decline was initially signaled by a high-wave candle, and then followed by a bullish engulfing pattern.
2. May 2020–December 2021: Climbing to All-Time Highs
Midway through 2020, a glimmer of hope appeared when the equity market began to stabilize. The Nasdaq-100 embarked on a sustained uptrend until December 2021. Several elements fueled this ascension:
- Recovery: After touching its lows in March, the Nasdaq-100 started showing signs of recovery. By June 2020, it had not only recovered its losses from the initial COVID-induced downturn but also reached new all-time highs. This recovery was faster and more robust than many other global indices, bolstered by the strength of tech giants like Apple, Amazon, Microsoft, and Alphabet (Google).
- Central Banks' Actions: The aggressive monetary policy measures implemented by central banks, especially the U.S. Federal Reserve, provided liquidity to the markets and played a role in the market's rapid rebound.
- Government Stimulus: In reaction to the economic slump triggered by the pandemic, the U.S. government rolled out significant fiscal stimulus actions, which supported the rise of the Nasdaq-100 index.
- Tech Stock Trends: Major tech giants, commonly labeled as "FAANG" (Facebook, Apple, Amazon, Netflix, and Google), experienced a sharp rise in their stock values in 2020, capitalizing on pandemic-accelerated trends like e-commerce and work-from-home.
- Economic Revival Journey: Through 2020 and 2021, economic indicators started to display recuperative trends.
As the global economy found its footing and consistently improved in 2021, the Nasdaq-100 maintained its climb upwards.
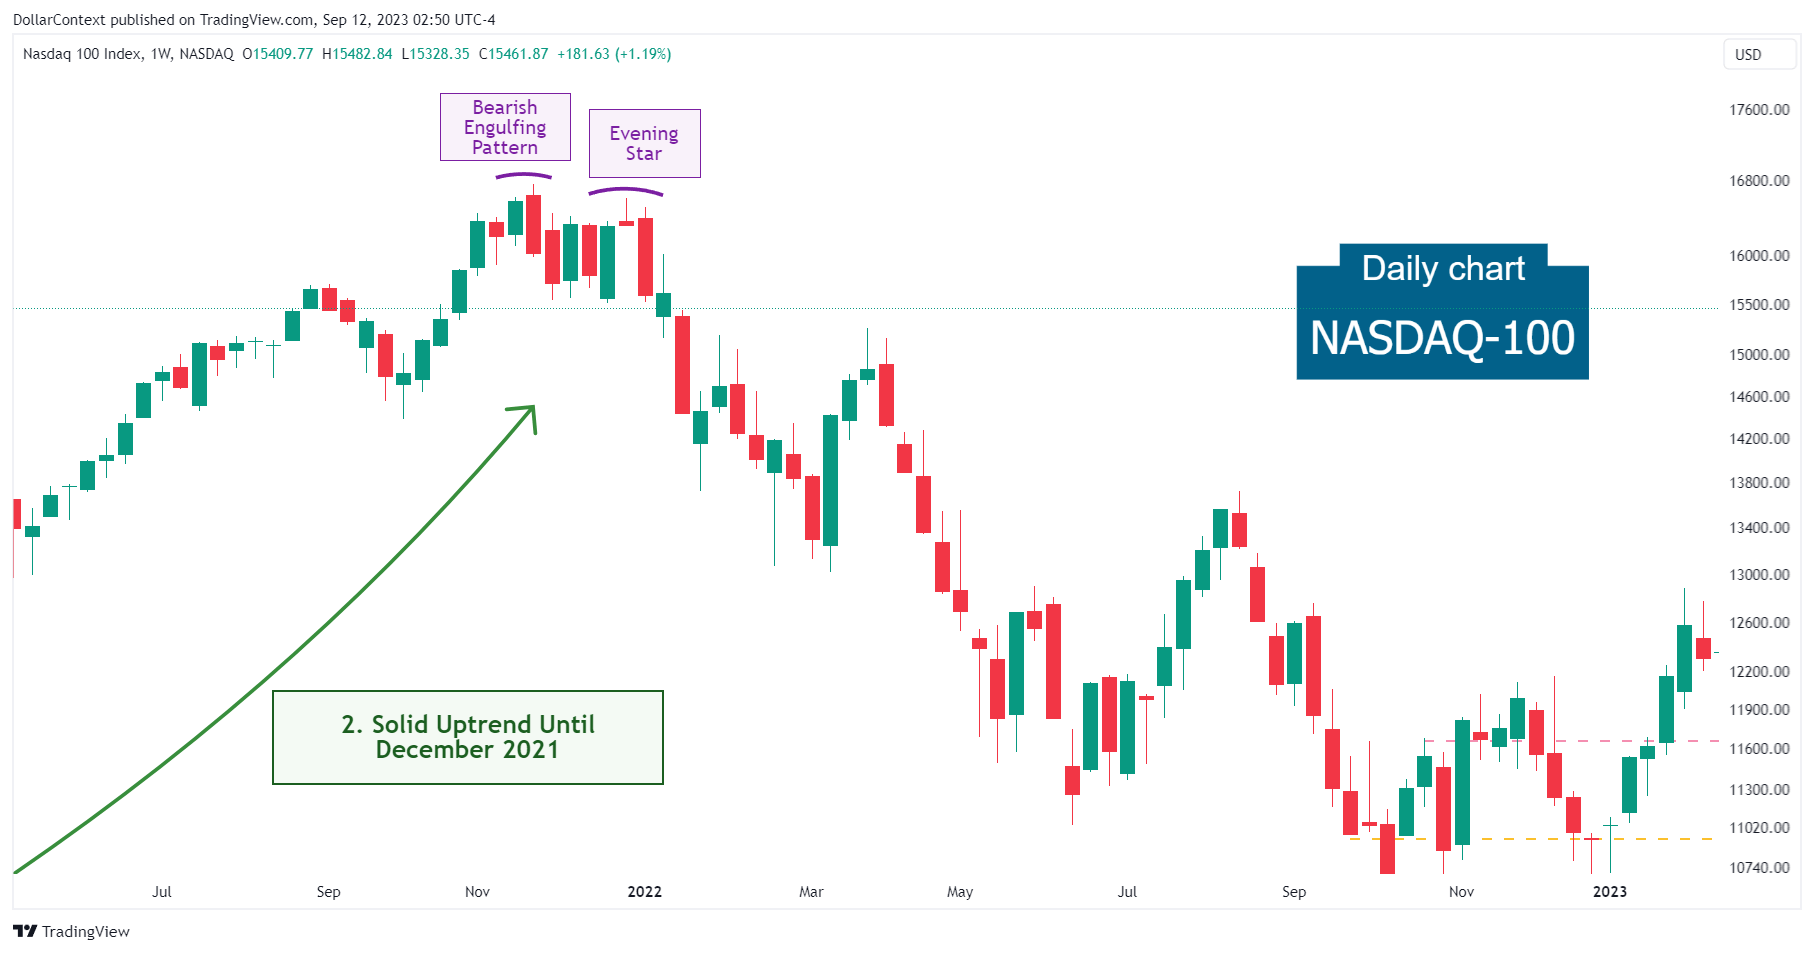
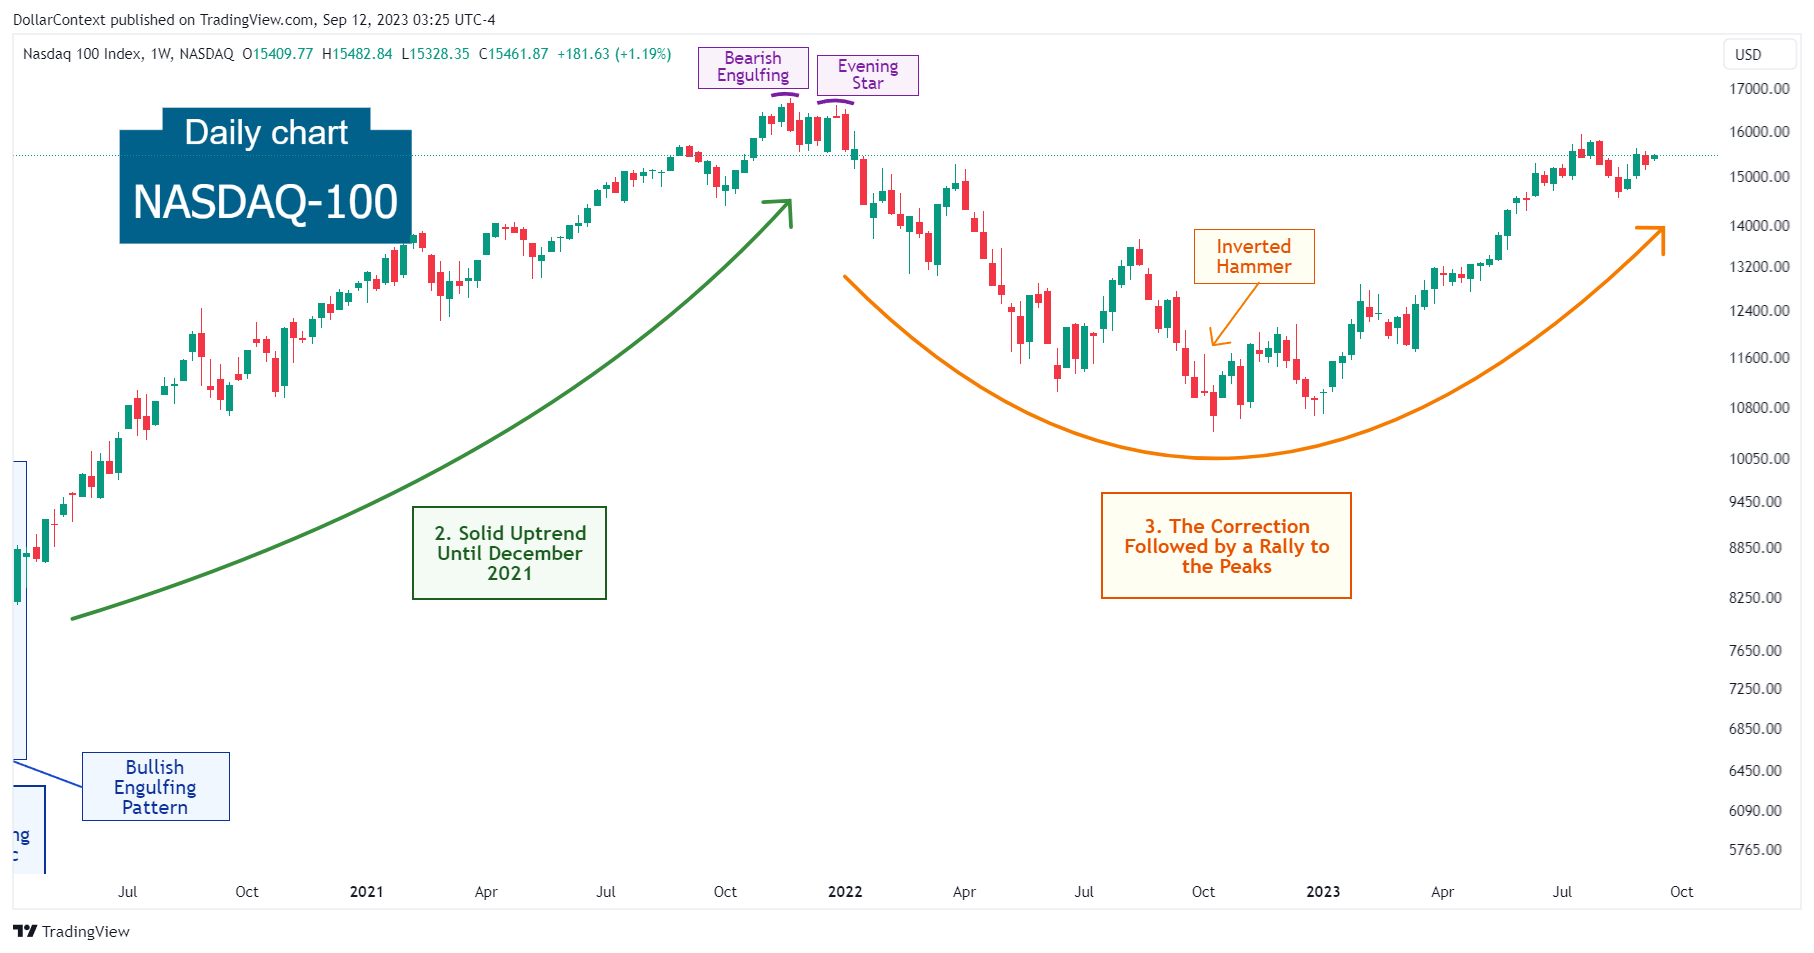
Upon closely examining the chart, we notice that the uptrend culminated in a bearish engulfing pattern. This was further confirmed by an evening star in the opening week of 2022.
3. January 2022–August 2023: The Correction Followed by a Rally to Almost Previous Peak
Rising inflation signals prompted the Federal Reserve to initiate a robust series of interest rate increases, targeting inflation control and moderating economic expansion. The central banks' tilt to tighter policies cast doubts on the equity market, resulting in a notable drop in the Nasdaq-100.
In a climate dominated by strong bearish market sentiment, the Nasdaq 100's downturn culminated with an inverted hammer during the initial week of October 2022. Subsequently, a resurgence to near previous peaks took place, partly driven by the advent of the artificial intelligence (AI) age and the companies involved in this sector.
4. Outlook for Late 2023 and Throughout 2024
The following perspective reflects expectations based on information and policy signals available at the time of writing.
Although the immediate future of the Nasdaq-100 index remains ambiguous, the following key factors could significantly influence its forthcoming direction:
- AI's Role in Boosting Efficiency: In the era of artificial intelligence (AI), its potential to heighten productivity and efficiency is fueling increased attention towards stocks and indices, like the Nasdaq-100.
- Risks of an Economic Decline: The Federal Reserve's assertive interest rate increases, along with worrisome signs such as the inverted yield curve and other leading economic indicators, suggest a possible economic slowdown in 2024.
- Yield Curve Inversion and Its Impact on the Equity Market: Past records indicate that the preference for high-risk assets often holds steady at the onset of a yield curve inversion or during its continuation. The move to more conservative investments, leading to a dip in equities, typically transpires in the later phases, especially as the curve nears or achieves a "reinversion".


