Nasdaq Composite: Evolution and Outlook
We discuss the drivers that shaped the course of the Nasdaq Composite post-2020. We'll wrap up by examining potential factors that might determine the market's direction in the future.

In this article, we'll discuss the main drivers that shaped the course of the Nasdaq Composite post-2020. We'll wrap up by examining potential factors that might determine the market's direction in the coming times.
1. January 2020–April 2020: A Sharp Descent and Subsequent Swift Uptick
At the dawn of 2020, the Nasdaq Composite, mirroring several global indices, faced pronounced fluctuations, mainly attributed to the onset and swift proliferation of the COVID-19 pandemic.
A snapshot of the Nasdaq Composite's trajectory in the early months of 2020:
- Before the Pandemic: Benefiting from a sustained bull run, the Nasdaq Composite commenced the year robustly, touching all-time peaks around mid-February.
- Steep Decline: With the severity of the COVID-19 crisis unfolding and nations enforcing rigorous lockdowns and travel restrictions, global markets witnessed sharp downturns. The Nasdaq Composite followed suit, retracting swiftly from its February zeniths.
- Strength in Technology: In the face of a widespread market downturn, numerous tech firms within the Nasdaq Composite demonstrated tenacity, especially those in the realms of cloud computing, e-commerce, and other virtual services. The shift to remote work and social distancing mandates bolstered the demand for these entities.
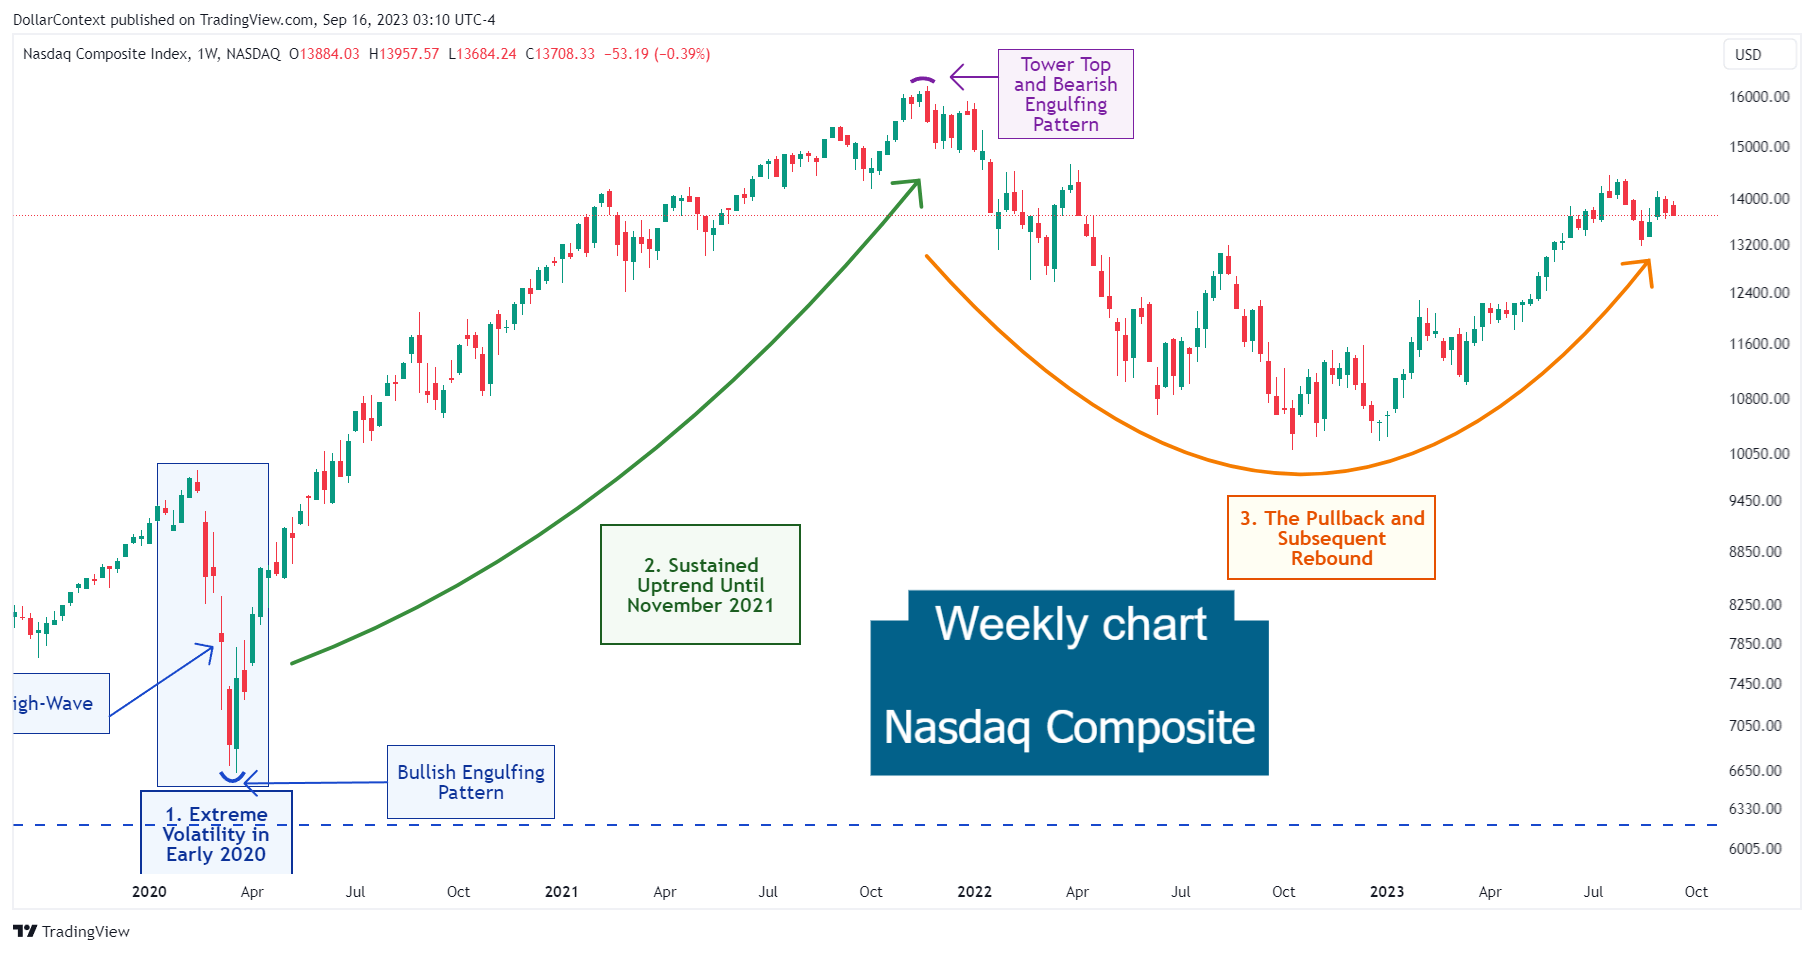
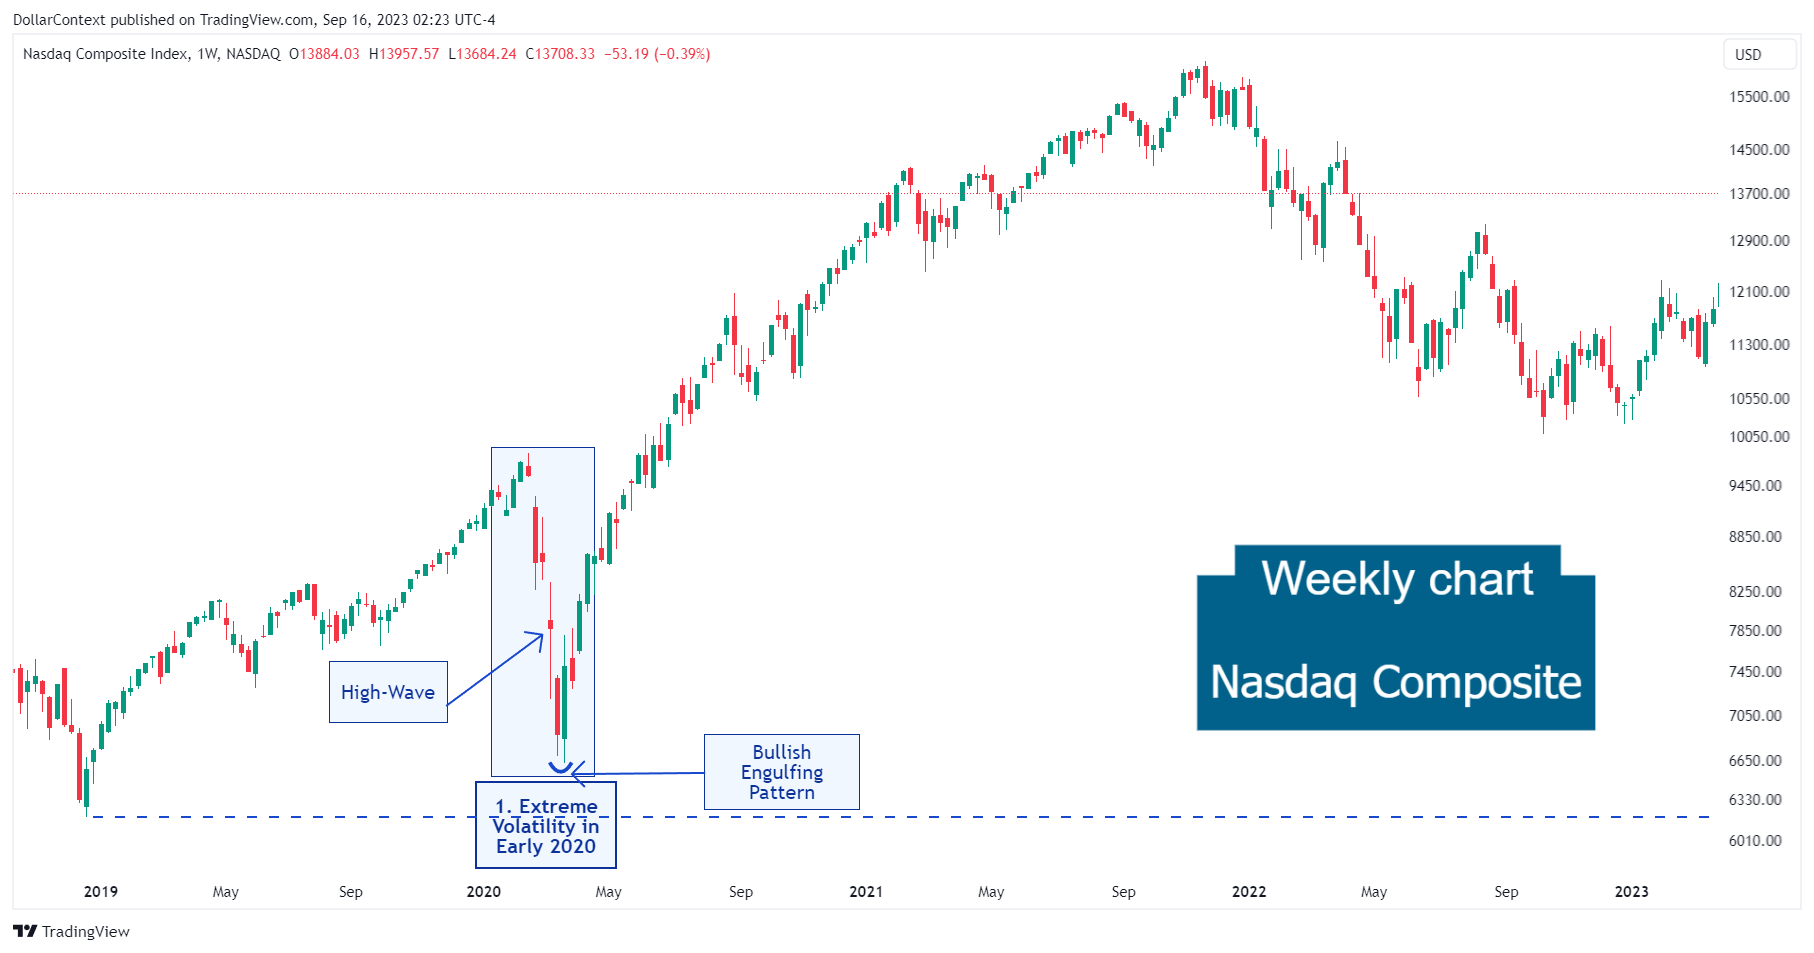
Chart Interpretation: Setting it against the performance trends of the SP&500 and the DJIA, it's worth noting that the previous low in December 2018 for the Nasdaq Composite was not surpassed by the lows observed in March 2020.
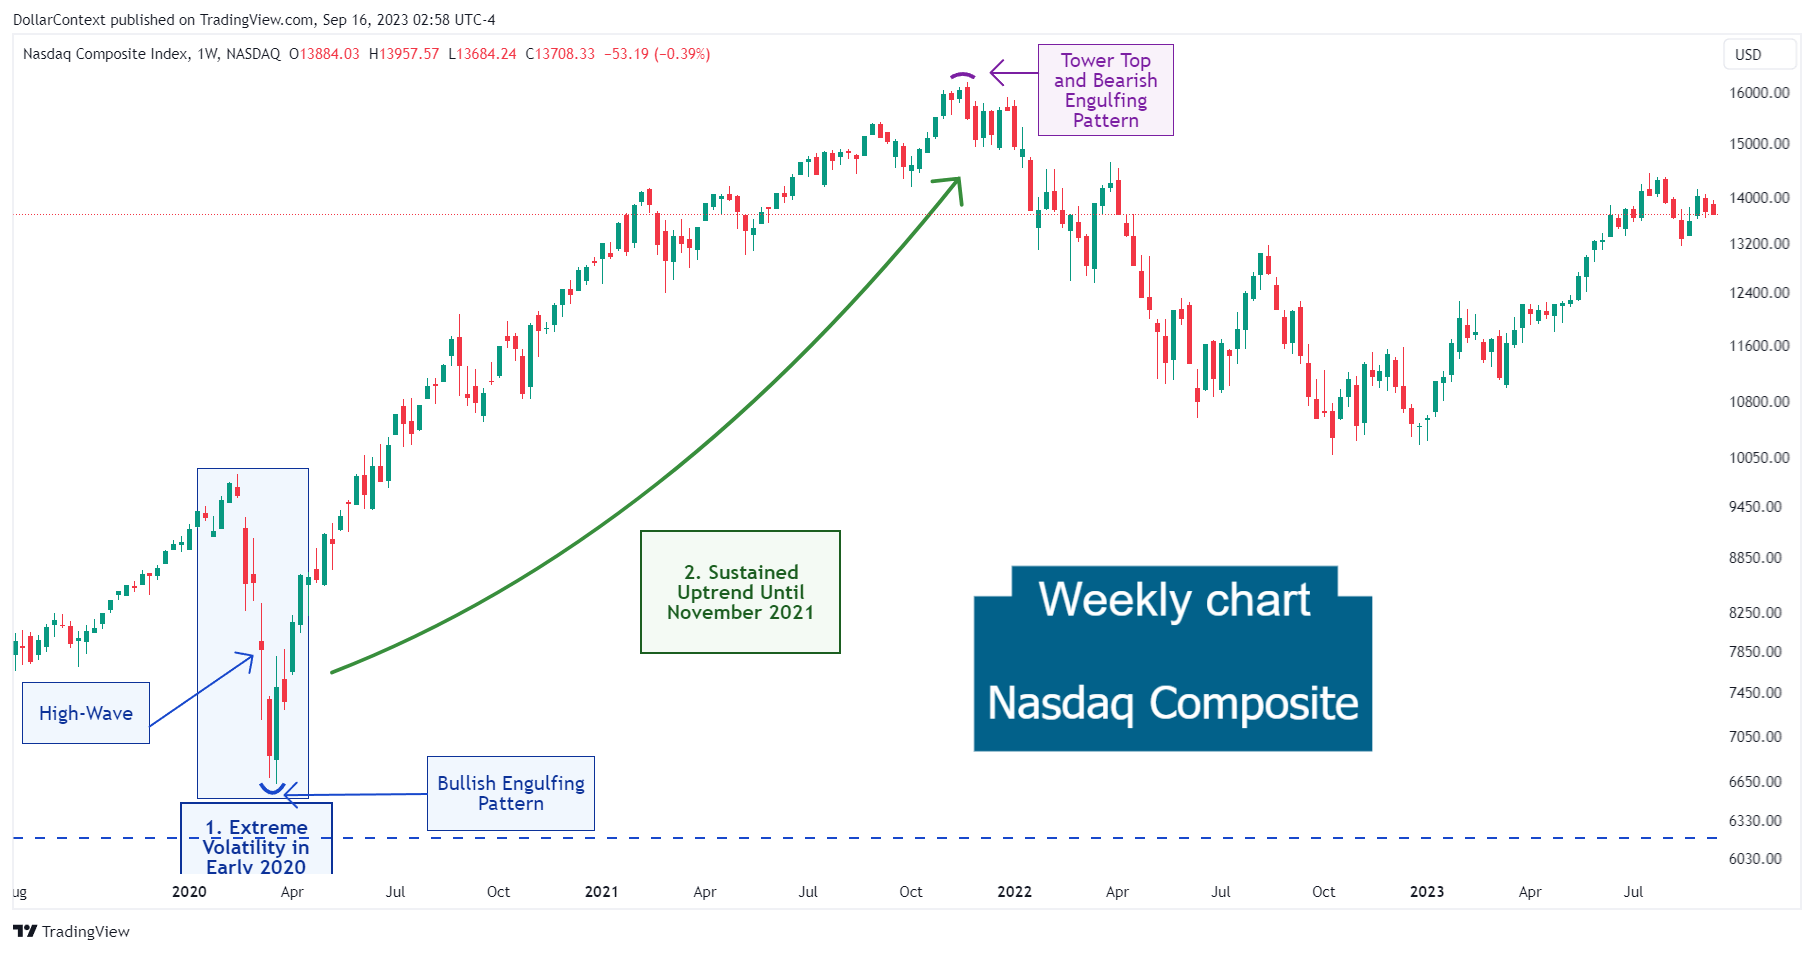
Notice the termination of the sharp drop in March 2020 being first indicated by a high-wave candlestick, later followed by a bullish engulfing pattern.

2. May 2020–November 2021: Soaring to Record Levels
Similarly to the performance of the Nasdaq-100, the Nasdaq Composite rebounded significantly in the second half of 2020, but its broader composition meant that while tech-heavy stocks surged, other sectors within the index faced more challenges.
Several factors drove this upward trajectory:
- Bounce Back: After plummeting to its March lows, the Nasdaq Composite began its resurgence. By June 2020, not only had it recouped its initial losses from the COVID-induced slump, but it also scaled record highs.
- Actions of Central Banks: Swift and assertive monetary interventions by central banks, notably the U.S. Federal Reserve, infused liquidity into the markets, facilitating the brisk market rally.
- Fiscal Interventions: To counter the economic challenges presented by the pandemic, the U.S. government introduced sizeable fiscal stimuli, underpinning the Nasdaq Composite's ascent.
- Surge in Tech Equities: A range of tech companies saw their stock prices soar in 2020, riding on pandemic-driven shifts such as the boom in e-commerce and the rise of remote work.
- Path to Economic Renewal: Throughout 2020 and 2021, a broad range of economic markers were showing important signs of improvement.
With the global economy regaining momentum and showing consistent progress in 2021, the Nasdaq Composite maintained its upward journey.
Observe how the upward trend culminated in a tower top and a bearish engulfing pattern in November 2021.

3. December 2021–August 2023: The Pullback and Subsequent Surge
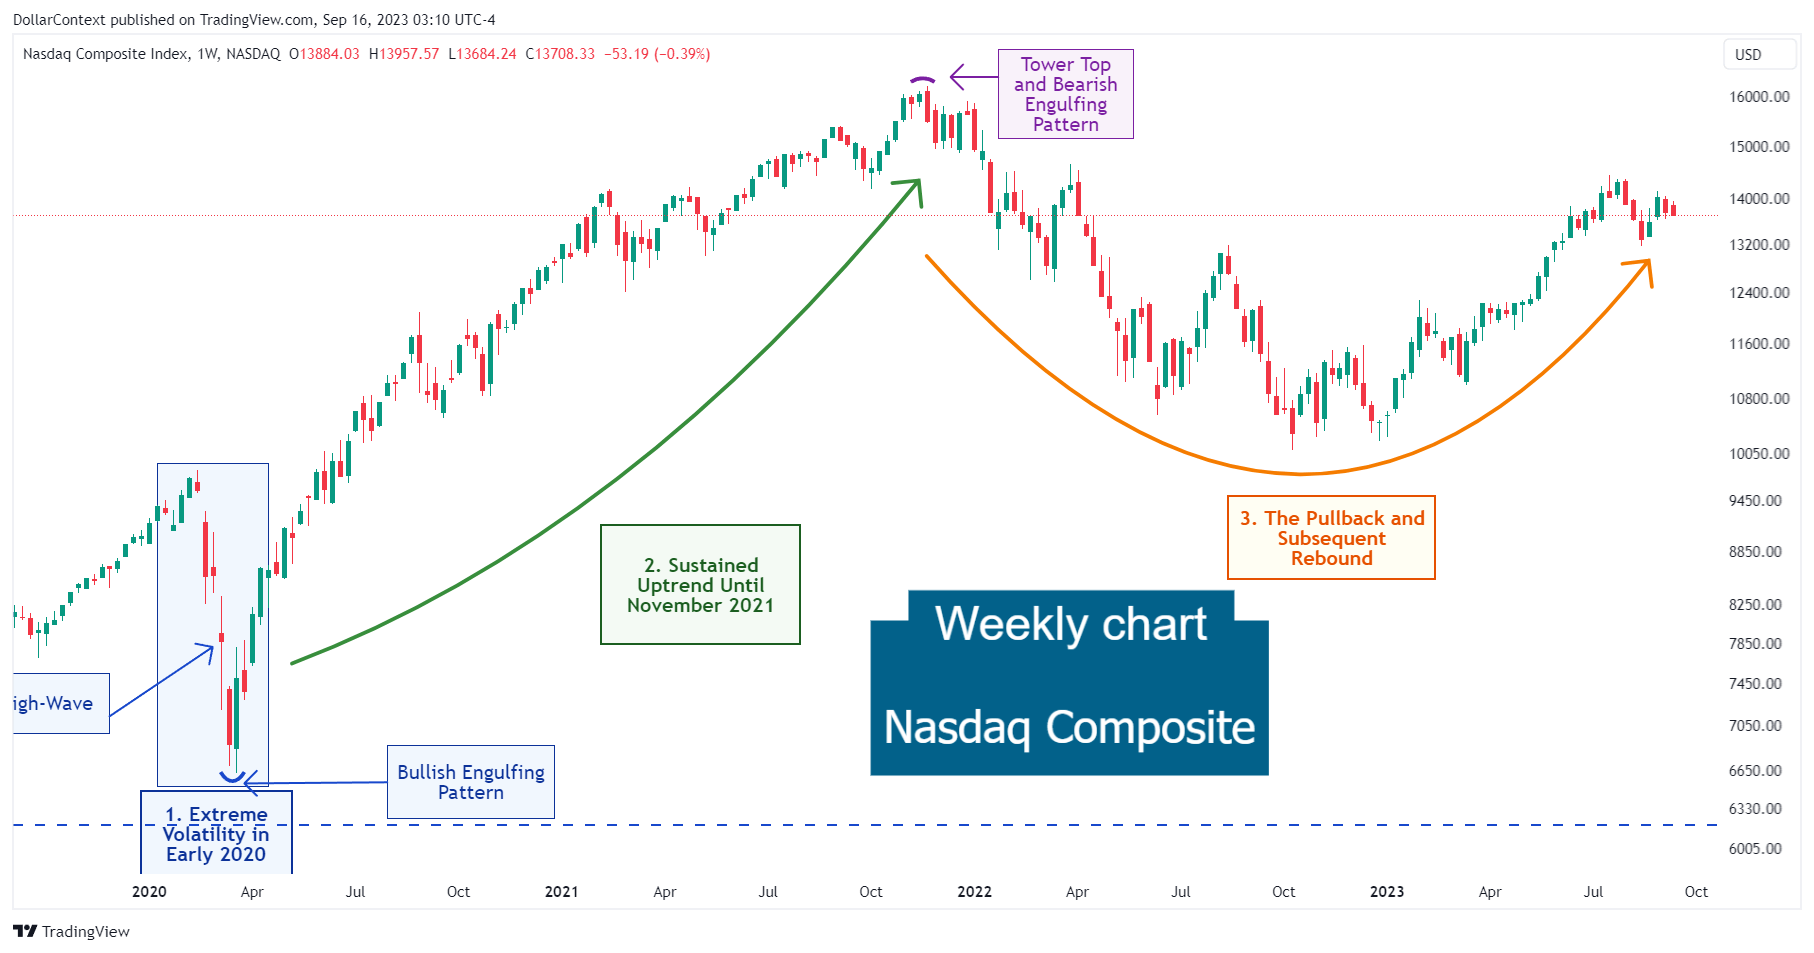
Mounting inflationary concerns led the Federal Reserve to embark on a series of aggressive interest rate hikes, aiming to rein in inflation and temper economic growth. This pivot towards a more stringent monetary stance created uncertainty in the stock market, causing a significant decline in the Nasdaq Composite.
In an environment overshadowed by prevailing bearish momentum, the Nasdaq Composite's descent reached a pinnacle in October 2022. Thereafter, the index experienced a notable recovery, spurred in part by the rise of the artificial intelligence (AI) era and the firms at its forefront.

4. Outlook for Late 2023 and Throughout 2024
While the immediate trajectory of the Nasdaq Composite index is uncertain, several pivotal factors could shape its upcoming course:
- AI's Impact on Productivity: In the age of artificial intelligence (AI), its capability to amplify efficiency and productivity is drawing heightened interest to stocks and indices, such as the Nasdaq Composite.
- Economic Slowdown Concerns: The Federal Reserve's decisive interest rate hikes, combined with alarming indicators like the inverted yield curve and other predictive economic signs, point to a potential economic downturn in 2024.
- The Implications of a Yield Curve Inversion on Stocks: Historical patterns suggest that the appetite for high-risk assets often remains consistent at the beginning or throughout a yield curve inversion. A shift towards more risk-averse investments, leading to a decline in stocks, usually occurs in its later stages, especially as the curve approaches or reaches a "reinversion".


