
Russell 2000: Evolution and Outlook
We examine the main factors shaping the Russell 2000 since 2020 and speculate on its future trajectory.


The Russell 2000 tracks the performance of 2,000 small-cap companies in the U.S. It's a subset of the Russell 3000 index, which represents approximately 98% of the investable U.S. stock market.
In this article, we'll cover the main factors that shaped the direction of the Russell 2000 index starting from 2020. We'll wrap up with an examination of elements that might determine the upcoming course of this market.
1. January 2020–April 2020: Steep Decline Followed by an Initial Recovery
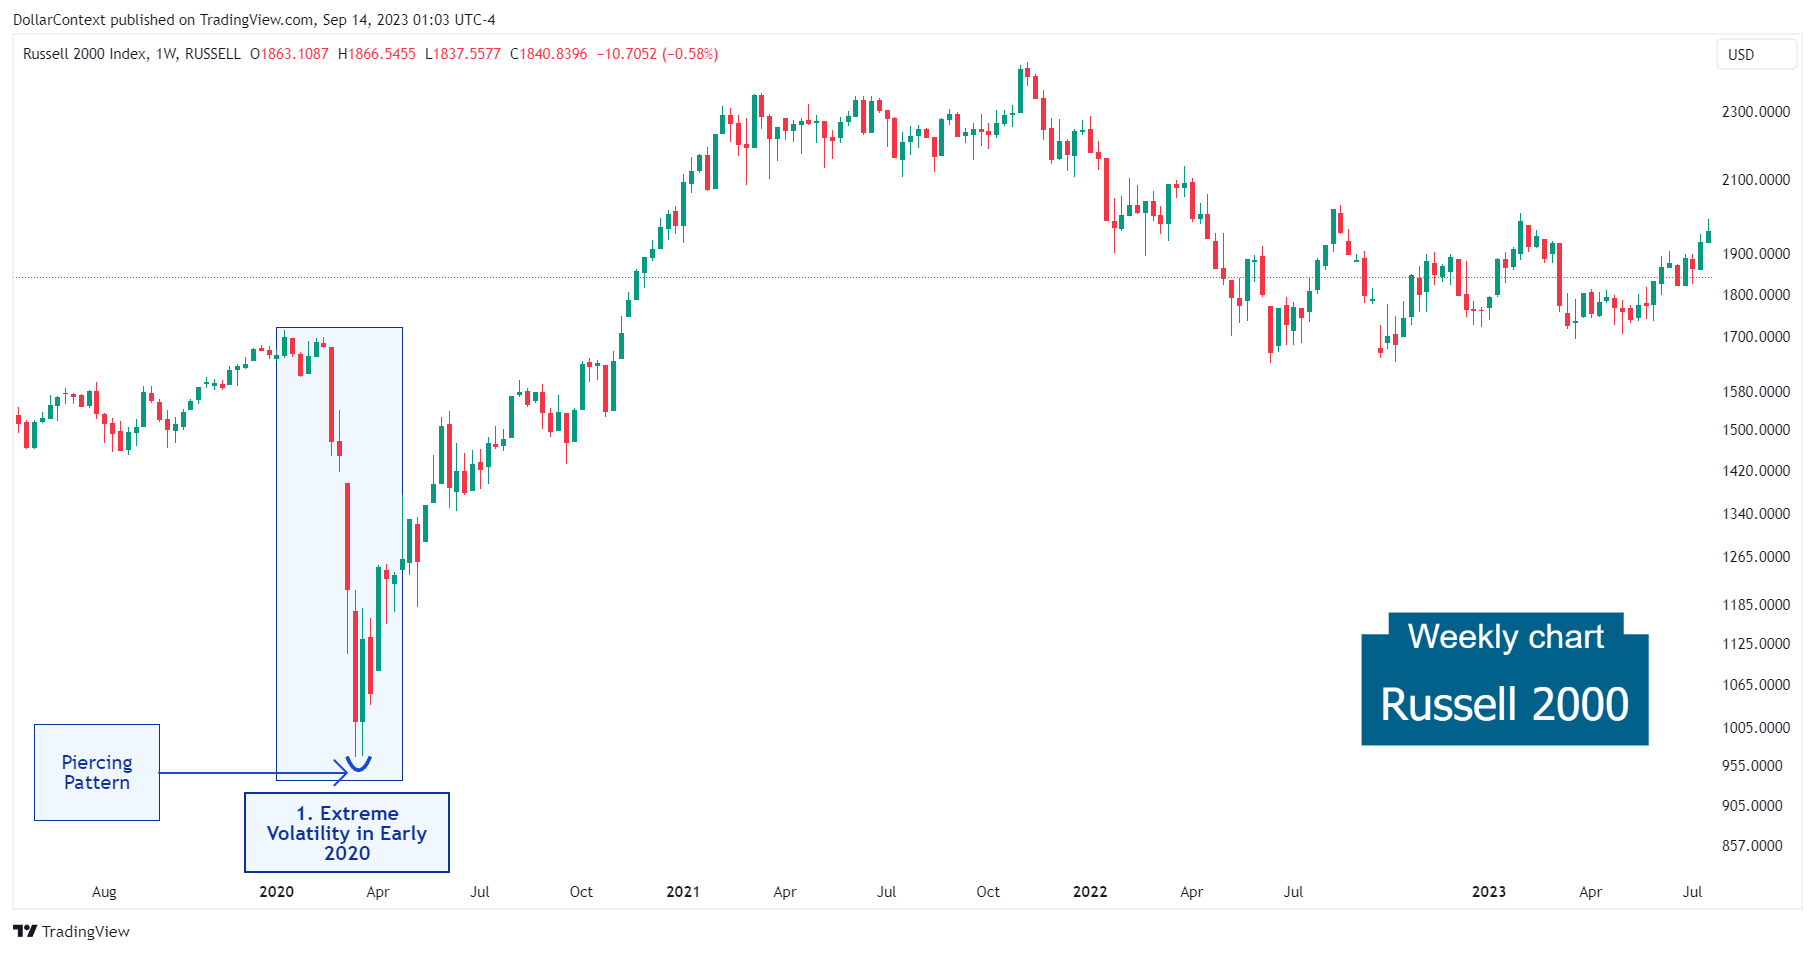
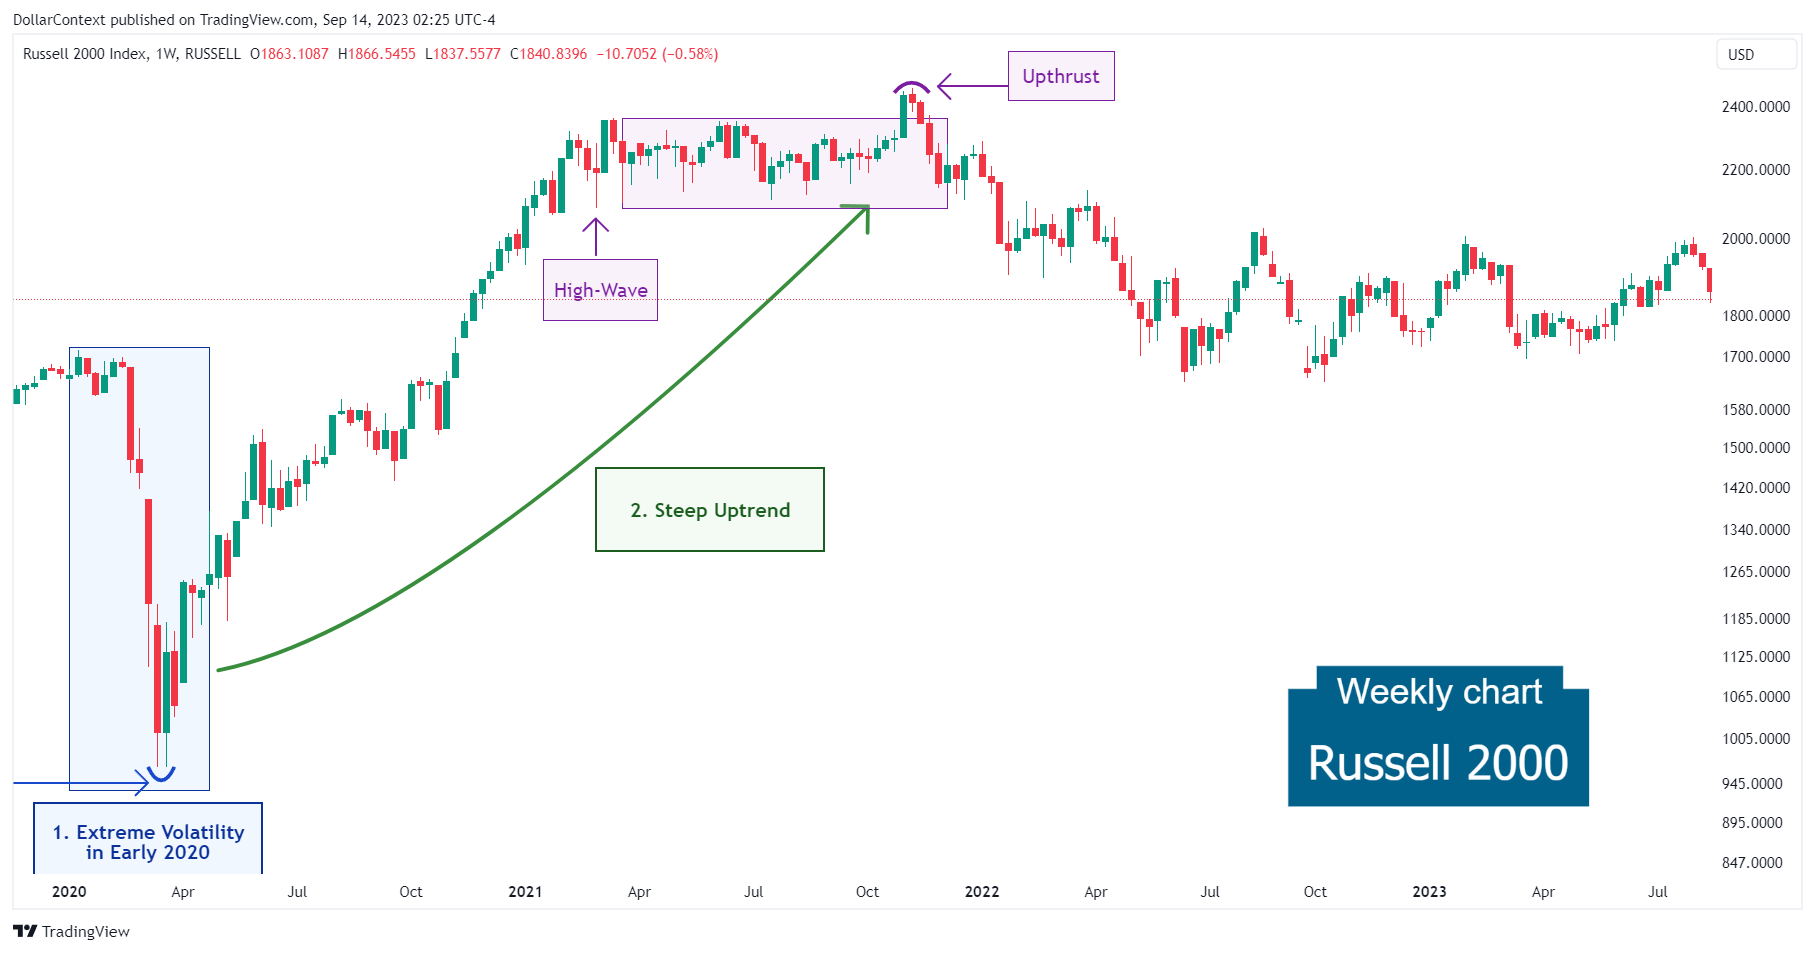
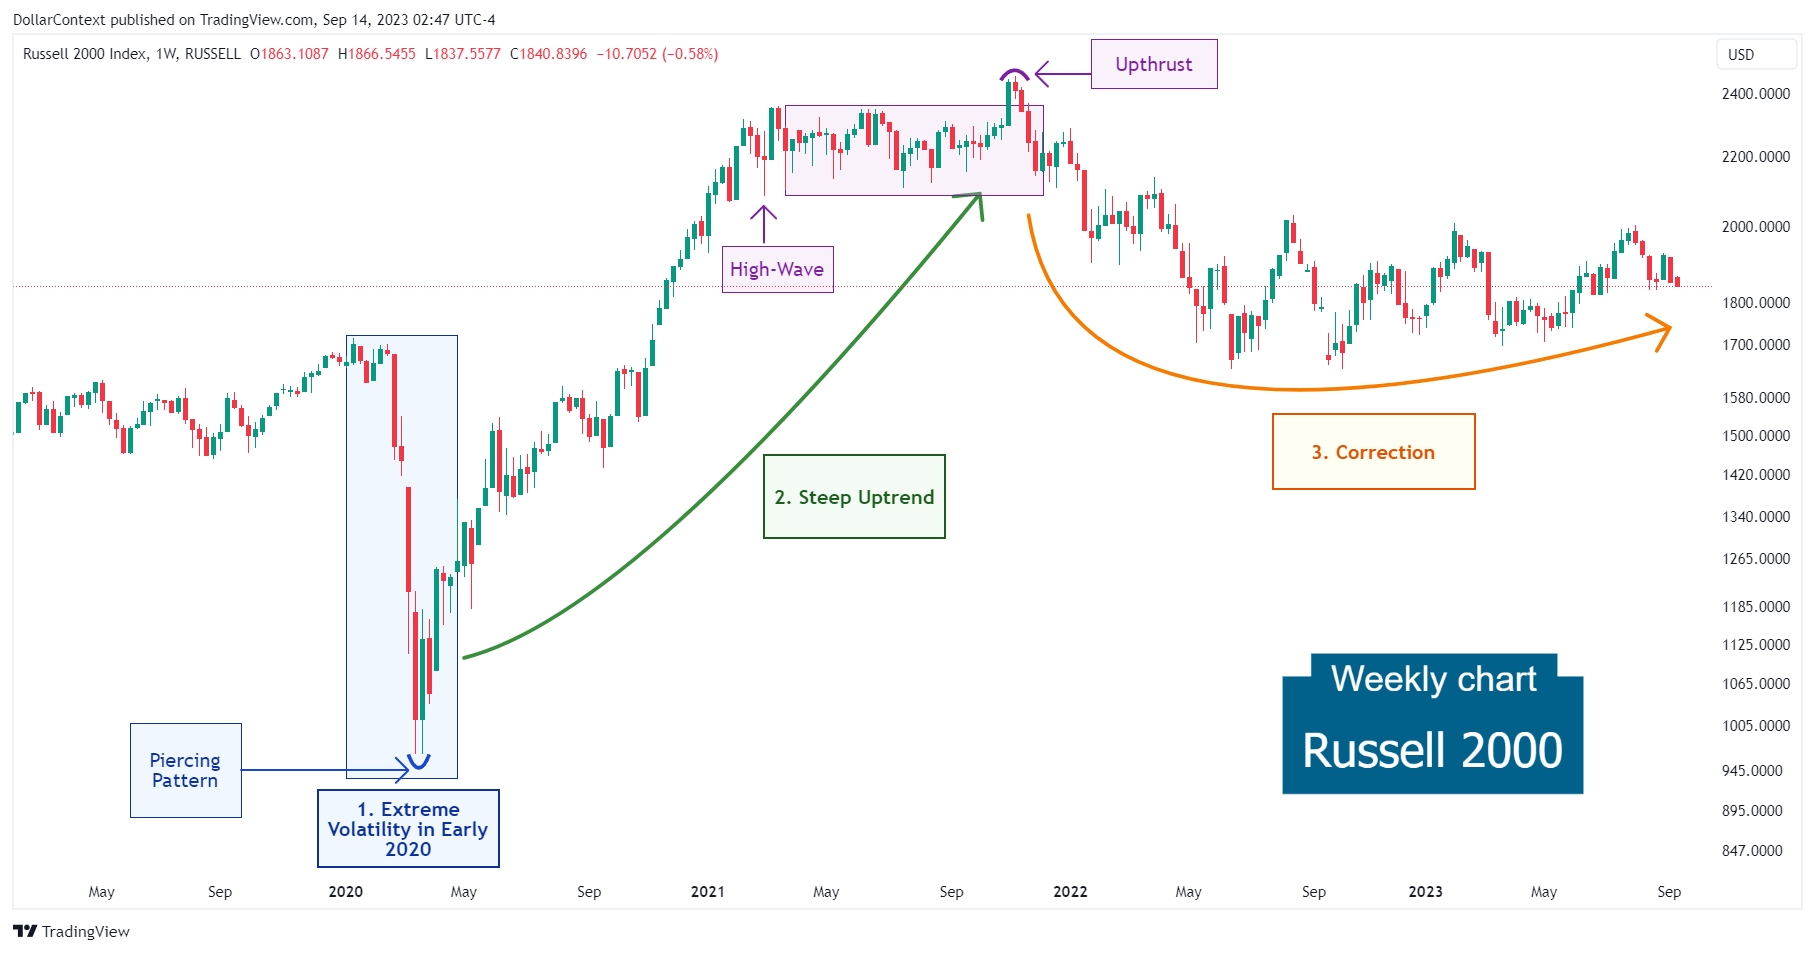
In early 2020, the Russell 2000 experienced significant volatility, much like other major global stock indices. Here's a brief overview of its performance and the primary drivers during that period:
Performance
- Sharp Decline: Starting in late February and escalating into March 2020, the Russell 2000 saw a steep drop.
- Recovery: After reaching a bottom in late March, the index began to rebound in April as part of a broader market recovery. However, its recovery pace was different from that of some other indices, given the unique vulnerabilities and strengths of small-cap stocks.
Key Drivers
- COVID-19 Pandemic: The major driver of the global market downturn in early 2020 was the rapid spread of the novel coronavirus, COVID-19. As countries around the world implemented lockdowns and travel restrictions to curb the spread of the virus, economic activity contracted sharply, impacting businesses of all sizes.
- Economic Uncertainty: The uncertainty surrounding the economic impact of the pandemic was profound. Many small-cap companies, represented in the Russell 2000, often have narrower margins and less financial flexibility than their larger counterparts, making them particularly vulnerable to economic downturns.
- Monetary and Fiscal Stimulus: The U.S. Federal Reserve introduced significant monetary policy measures, including interest rate cuts and massive asset purchases, to provide liquidity to the markets. Additionally, the U.S. government announced fiscal stimulus packages, including the CARES Act, to support businesses and individuals. These interventions played a role in stabilizing the markets and initiating a rebound.
- Investor Sentiment: Given the unprecedented nature of the pandemic and the accompanying economic fallout, investor sentiment was highly fluid. News about the virus's spread, potential treatments, and vaccine developments, alongside economic data releases, played a significant role in daily market movements.
Technical Analysis
Observe how a piercing pattern in late March signaled the end of the meltdown and the beginning of a strong upward trend.
2. May 2020–November 2021: Reaching Unprecedented Peaks
By the end of the first half of 2020, while the broader market context was still defined by uncertainty due to the ongoing pandemic, the Russell 2000 had rebounded significantly from its March lows, though it was still grappling with many challenges.
In late 2020 and throughout 2021, the Russell 2000 showcased a noticeable uptrend. This performance was attributed to various drivers:
- Economic Recovery: As regions around the world began to emerge from the harshest phases of the COVID-19 pandemic, economic activity started to rebound. This recovery, reflected in improving economic indicators, played a significant role in boosting market sentiment and influencing the Russell's uptrend.
- Vaccine Rollout: The latter part of 2020 saw the development, approval, and initial distribution of COVID-19 vaccines. In 2021, the widespread vaccination efforts led to a return of consumer confidence, spurring economic activity and benefitting many companies within the Russell 2000.
- Government Stimulus: Continued government support in the form of stimulus checks and other relief packages provided an essential safety net, leading to increased consumer spending and optimism in the market.
- Low Interest Rates: Central banks, including the U.S. Federal Reserve, maintained low-interest rates to stimulate economic activity. This environment was generally favorable for equities, as it made borrowing cheaper for companies and turned investors toward stocks in search of better returns.
- Rotation into Small Caps: During various periods in 2021, there was a noticeable rotation of investments into small-cap stocks, as they were seen to offer more significant growth potential in a recovering economy compared to some large-cap counterparts.
- Adaptation to the New Normal: Many small-cap companies showcased resilience and adaptability in adjusting their business models to cater to the changing consumer behavior in the pandemic and post-pandemic era, driving positive earnings surprises and influencing stock prices.
While the Russell 2000 witnessed periods of volatility, like all equity markets, the overall trend during late 2020 and much of 2021 was positive, reflecting the broader economic recovery and optimism.
Technically speaking, the rally gave its first sign of peaking with a high-wave candlestick in March 2021. Subsequently, the Russell 2000 displayed an extended sideways trend until November, when an upthrust (false breakout to the upside) emerged.
3. December 2021–August 2023: The Correction
Signals of escalating inflation led the Federal Reserve to embark on a series of significant interest rate hikes, aimed at curbing inflation and tempering economic growth. These more restrictive measures played a part in a marked correction of the Russell 2000, lasting until June 2022. Since then, the index has entered a horizontal trend that persists to the present.
4. Outlook for Late 2023 and Throughout 2024
While the near-term trajectory of the Russell 2000 index is uncertain, several pivotal factors might shape its upcoming course:
- AI's Influence on Productivity: As the prominence of artificial intelligence (AI) grows, its capability to enhance productivity has drawn significant interest, particularly towards stocks and indices such as the Russell 2000.
- Potential Economic Downturn: With the Federal Reserve's aggressive interest rate hikes and concerning indicators like the inverted yield curve, there are looming concerns of a potential economic setback in 2024.
- Effects of the Yield Curve Inversion on Stocks: Historical data shows that the appetite for high-risk investments tends to remain stable during the early stages of a yield curve inversion. However, a shift towards more conservative assets, resulting in a decline in stocks, usually occurs in its later stages, particularly when the curve approaches or reaches a "reinversion".


