S&P 500: Evolution and Outlook
We discuss the dynamics that have shaped the trajectory of the S&P 500 since 2020 and provide insights on the potential drivers that might influence this market.
In this post, we'll discuss the fundamental and technical dynamics that have shaped the direction of the S&P 500 since 2020. We'll wrap up with insights on potential factors that might guide the future course of this market.
1. January 2020–April 2020: Collapse Followed by a Sharp Recovery
In the opening months of 2020, the DJT experienced notable volatility. Initially, the market took a sharp dive, only to rally vigorously towards the close of the first quarter.
Given the combined effects of the factors detailed below, 2020 was one of the most volatile and unpredictable years in the history of the S&P 500.
- COVID-19 Pandemic: The onset of the COVID-19 pandemic in early 2020 caused widespread economic shutdowns, leading to an initial steep decline in the S&P 500.
- Economic Downturn: Even before the pandemic struck, apprehensions about a looming global recession were on the rise because of multiple reasons. The onset of the pandemic magnified these concerns, resulting in reduced consumer spending and business operations, which, in turn, profoundly affected the equity market.
- Supply Chain Disruptions: The pandemic took a heavy toll on international supply chains. Closures of factories, particularly in key manufacturing centers in China, led to a significant reduction in the transportation sector.
- Consumer Behavior Shifts: The health crisis resulted in significant shifts in consumer behavior, with increases in online shopping, reduced travel, and changes in entertainment consumption, influencing various sectors of the market differently.
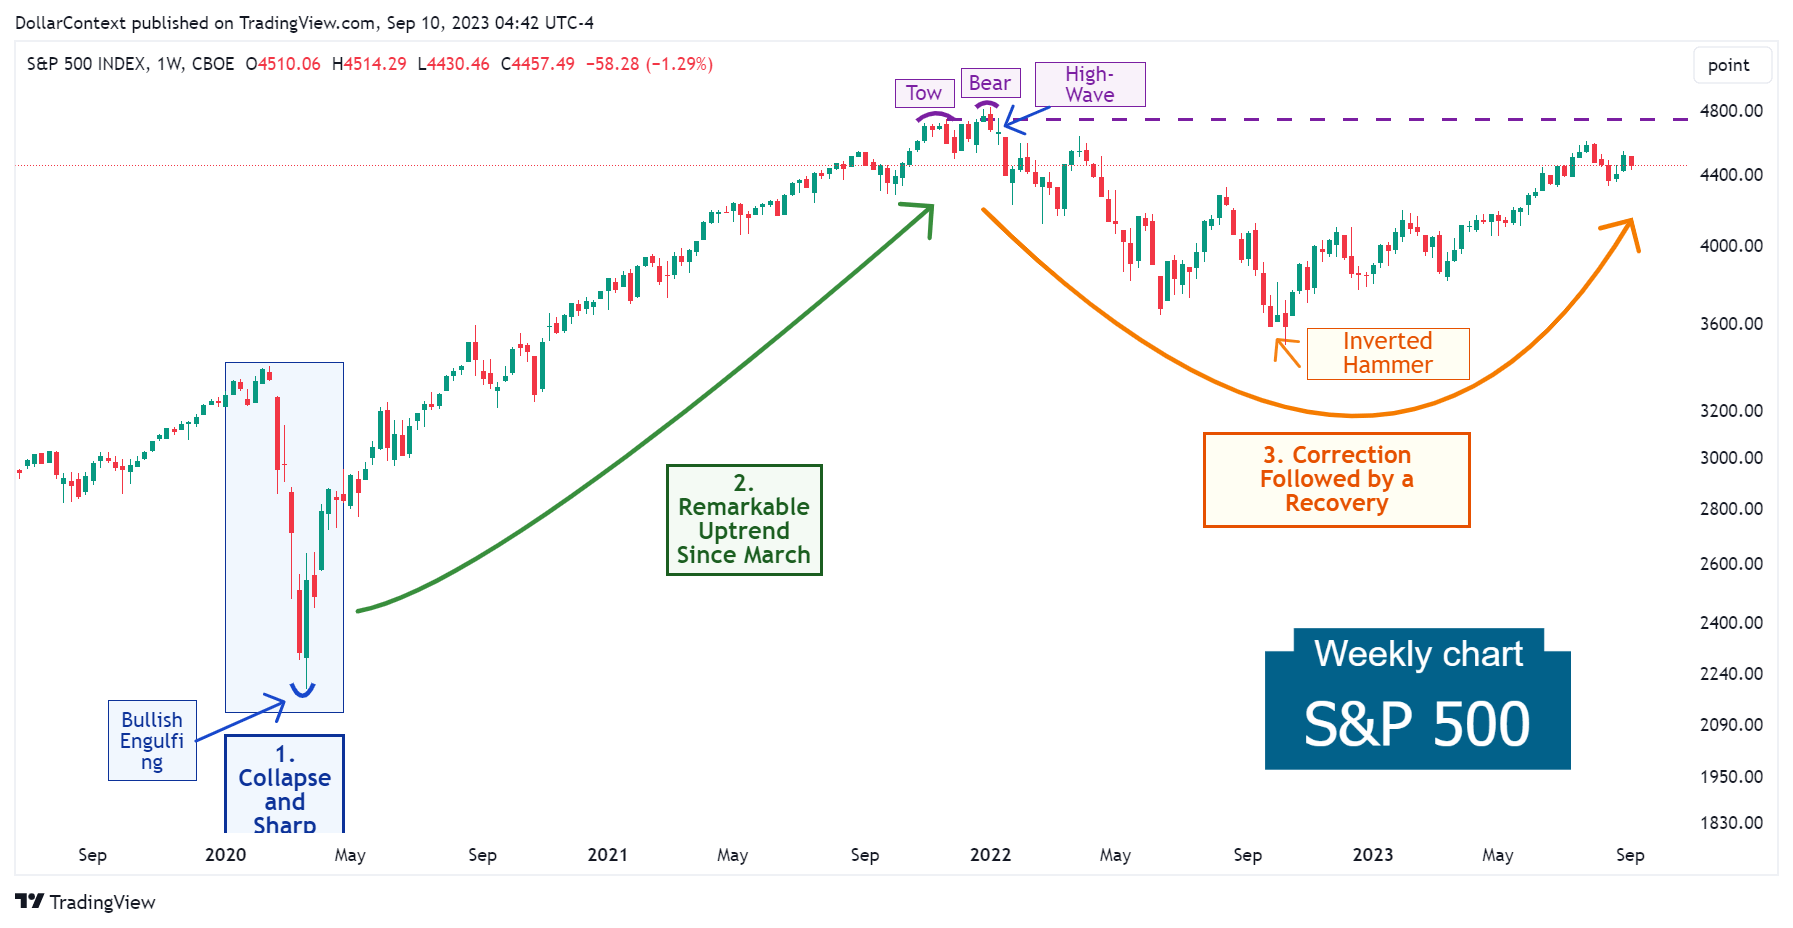
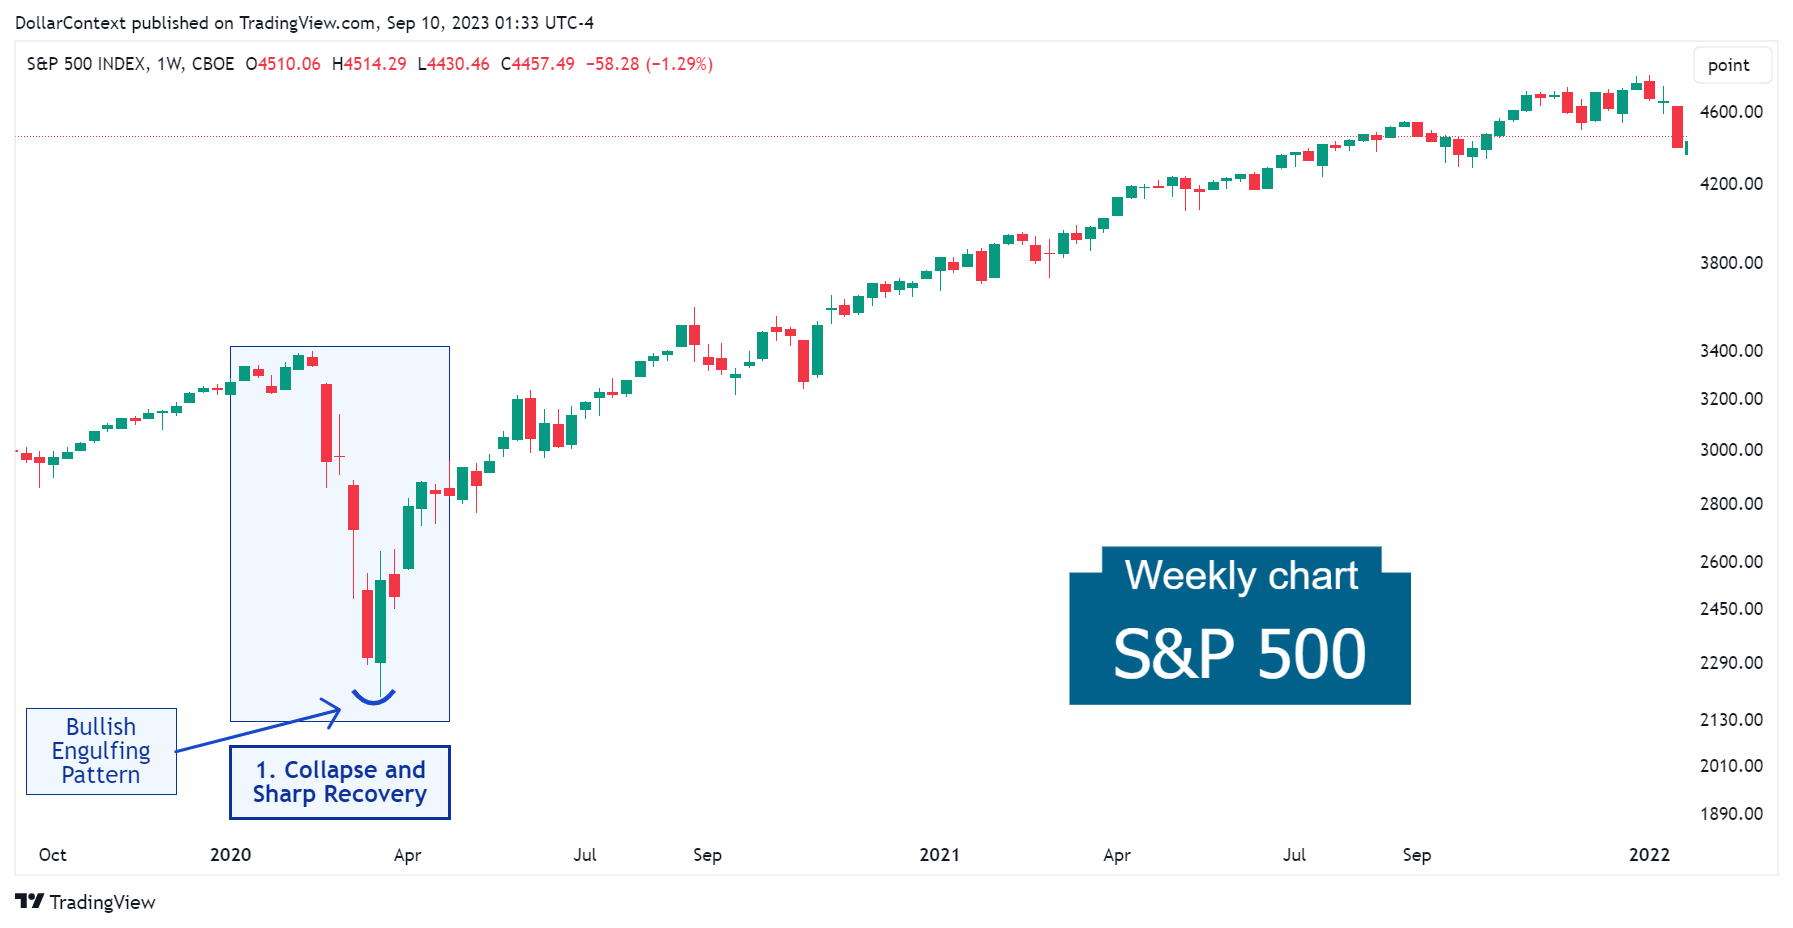
From a candlestick perspective, observe the bullish engulfing pattern that appeared in March 2020, heralding the beginning of a remarkable uptrend.
2. May 2020–December 2021: Ascending to Record Levels
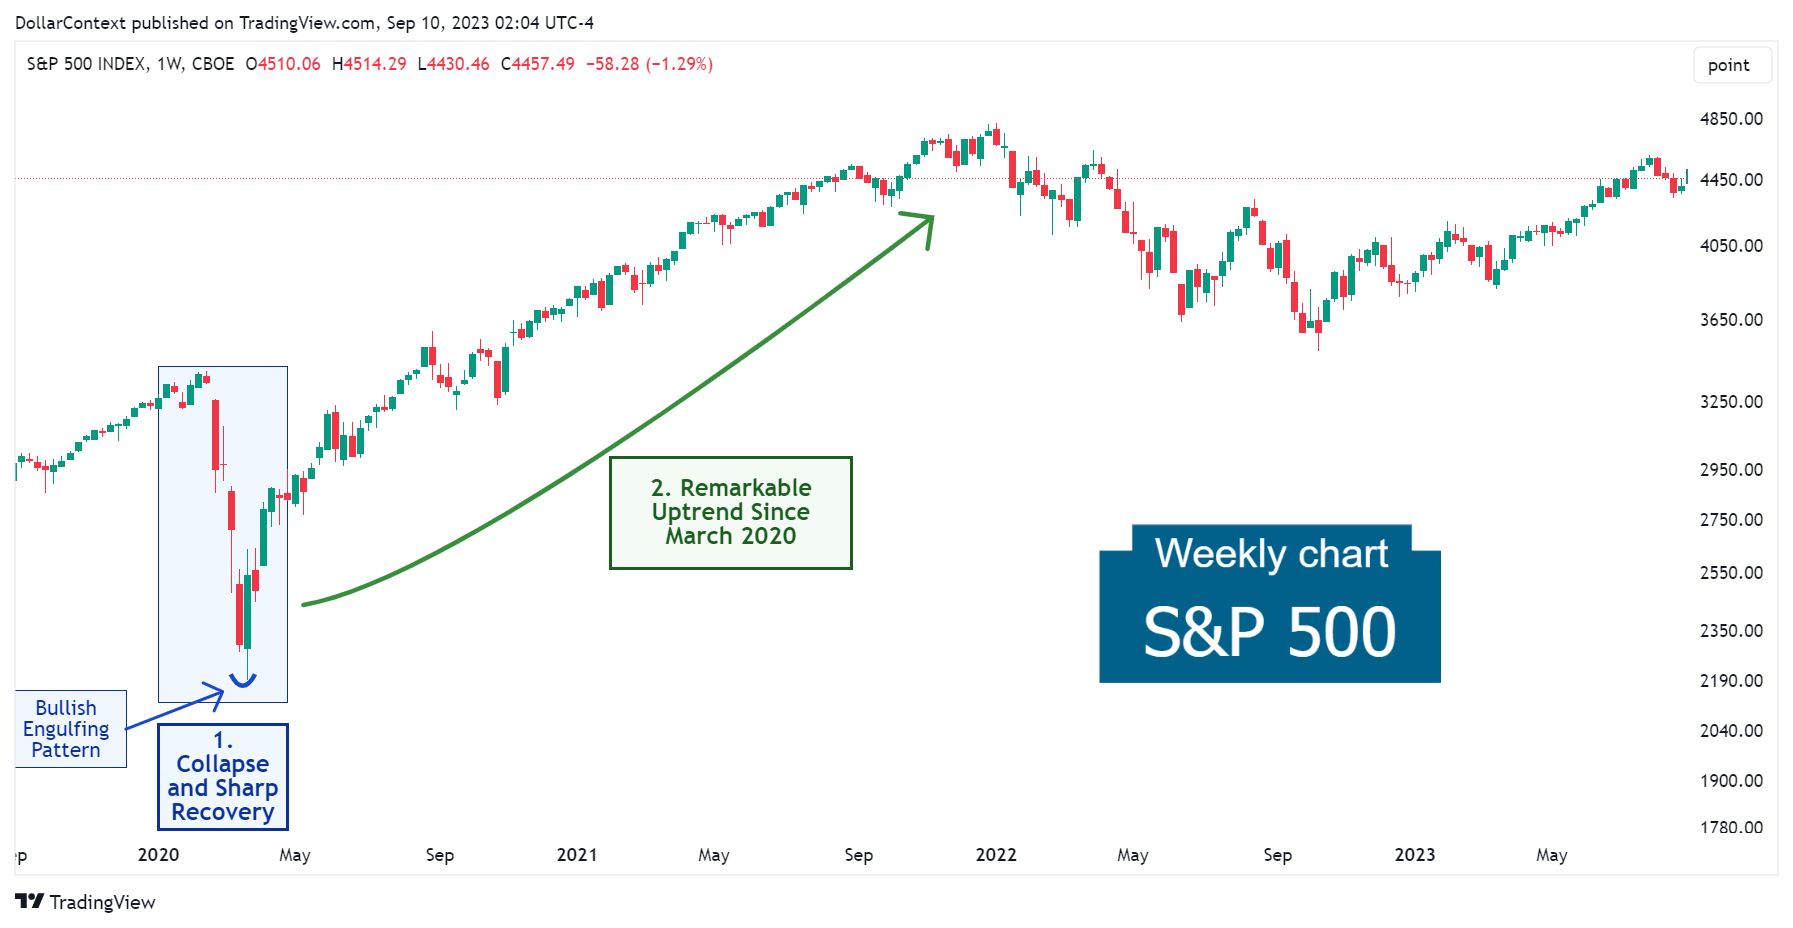
In the middle of 2020, a ray of optimism emerged as the market found stability. The S&P 500 initiated a rapid recovery that persisted until late 2021. Multiple factors drove this upward trend:
- Government Stimulus: In response to the economic downturn caused by the pandemic, the U.S. government introduced substantial fiscal stimulus measures, which helped buoy the S&P 500 index.
- Vaccine Developments: Positive news regarding the development, approval, and distribution of COVID-19 vaccines towards the latter part of 2020 brought optimism to the markets, fueling hopes of a return to economic normalcy.
- Tech Stock Performance: Big technology companies, often referred to as "FAANG" (Facebook, Apple, Amazon, Netflix, and Google), saw their stock prices surge in 2020 as they benefited from trends accelerated by the pandemic, such as e-commerce and remote work.
- Progressive Economic Recovery: As 2020 and 2021 progressed, economic data began showing signs of recovery.
- Federal Reserve Actions: The U.S. Federal Reserve took aggressive monetary policy measures, including slashing interest rates and implementing various lending and liquidity programs, which provided a backstop to financial markets.
As the global economy began to stabilize and demonstrate consistent recovery in 2021, the S&P 500 continued to reinforce its upward trajectory.
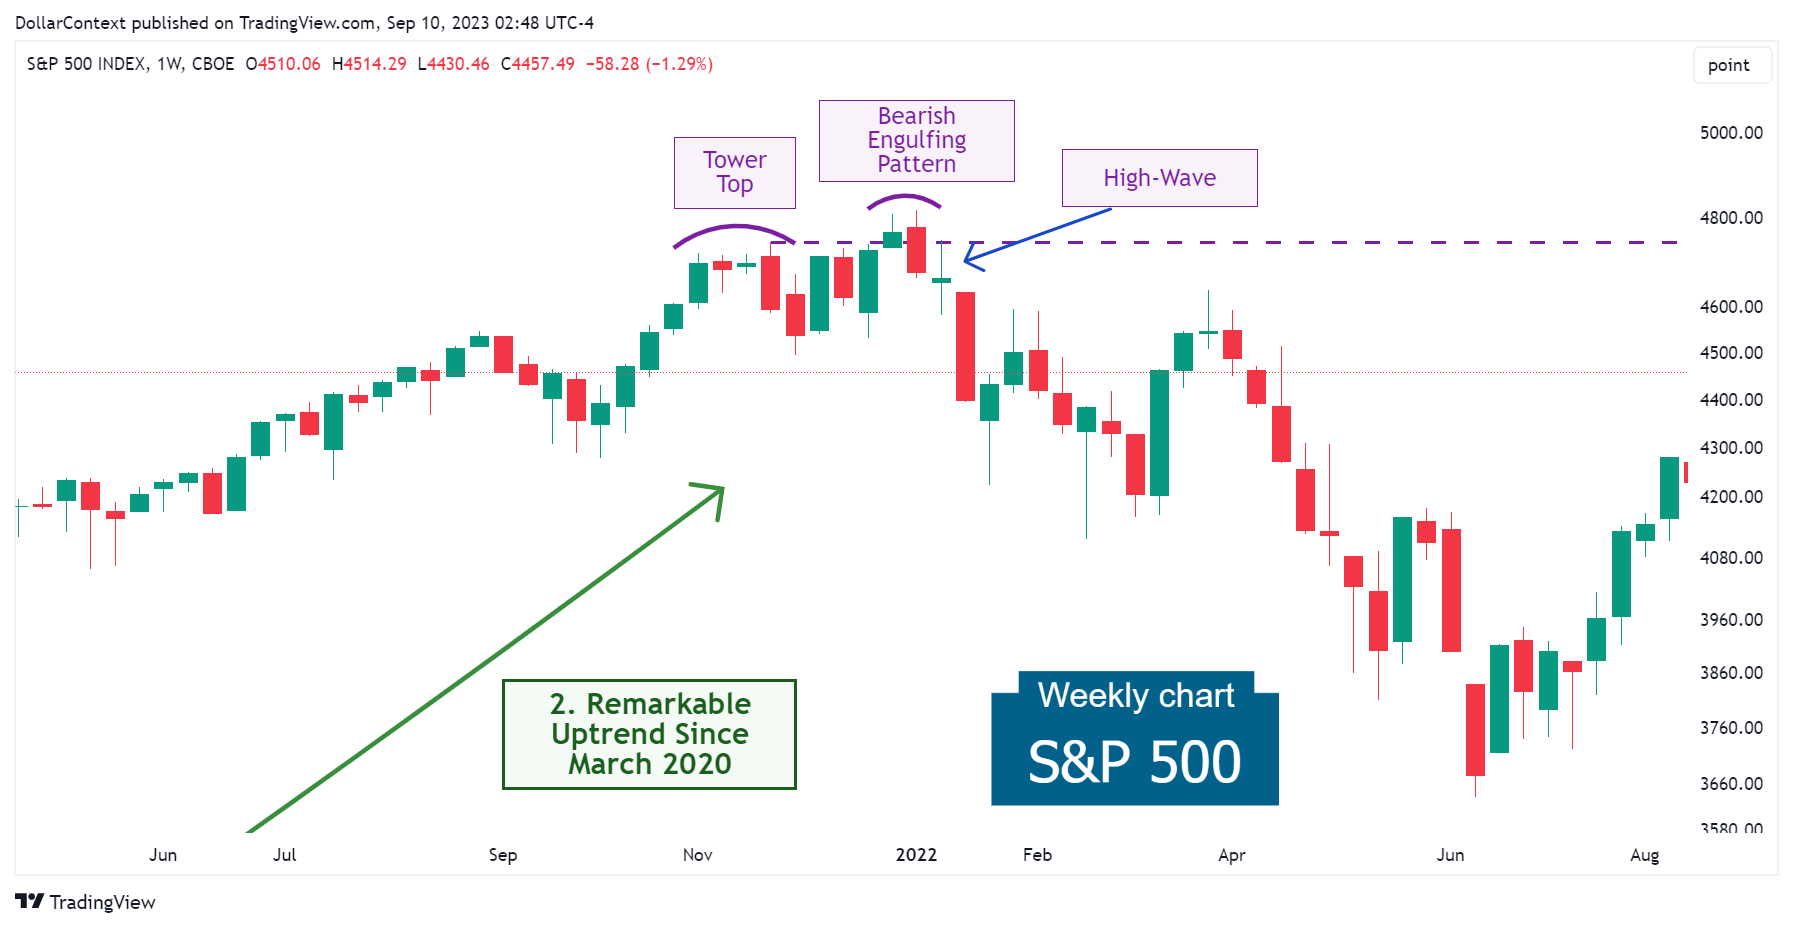
A closer examination of this chart reveals that the peak in late 2021 was characterized by a series of candlestick patterns described below
- Tower Top: This pattern was the first warning sign that the upward trend could be in danger.
- Bearish Engulfing Pattern: A few weeks after the tower top, a bearish engulfing pattern challenged those highs. The market quickly retreated, resulting in an upthrust (false breakout to the upside).
- High-Wave: The appearance of a high-wave candle close to the peak of the tower top underscored the significance of this resistance and strengthened the possibility of a reversal to the downside.
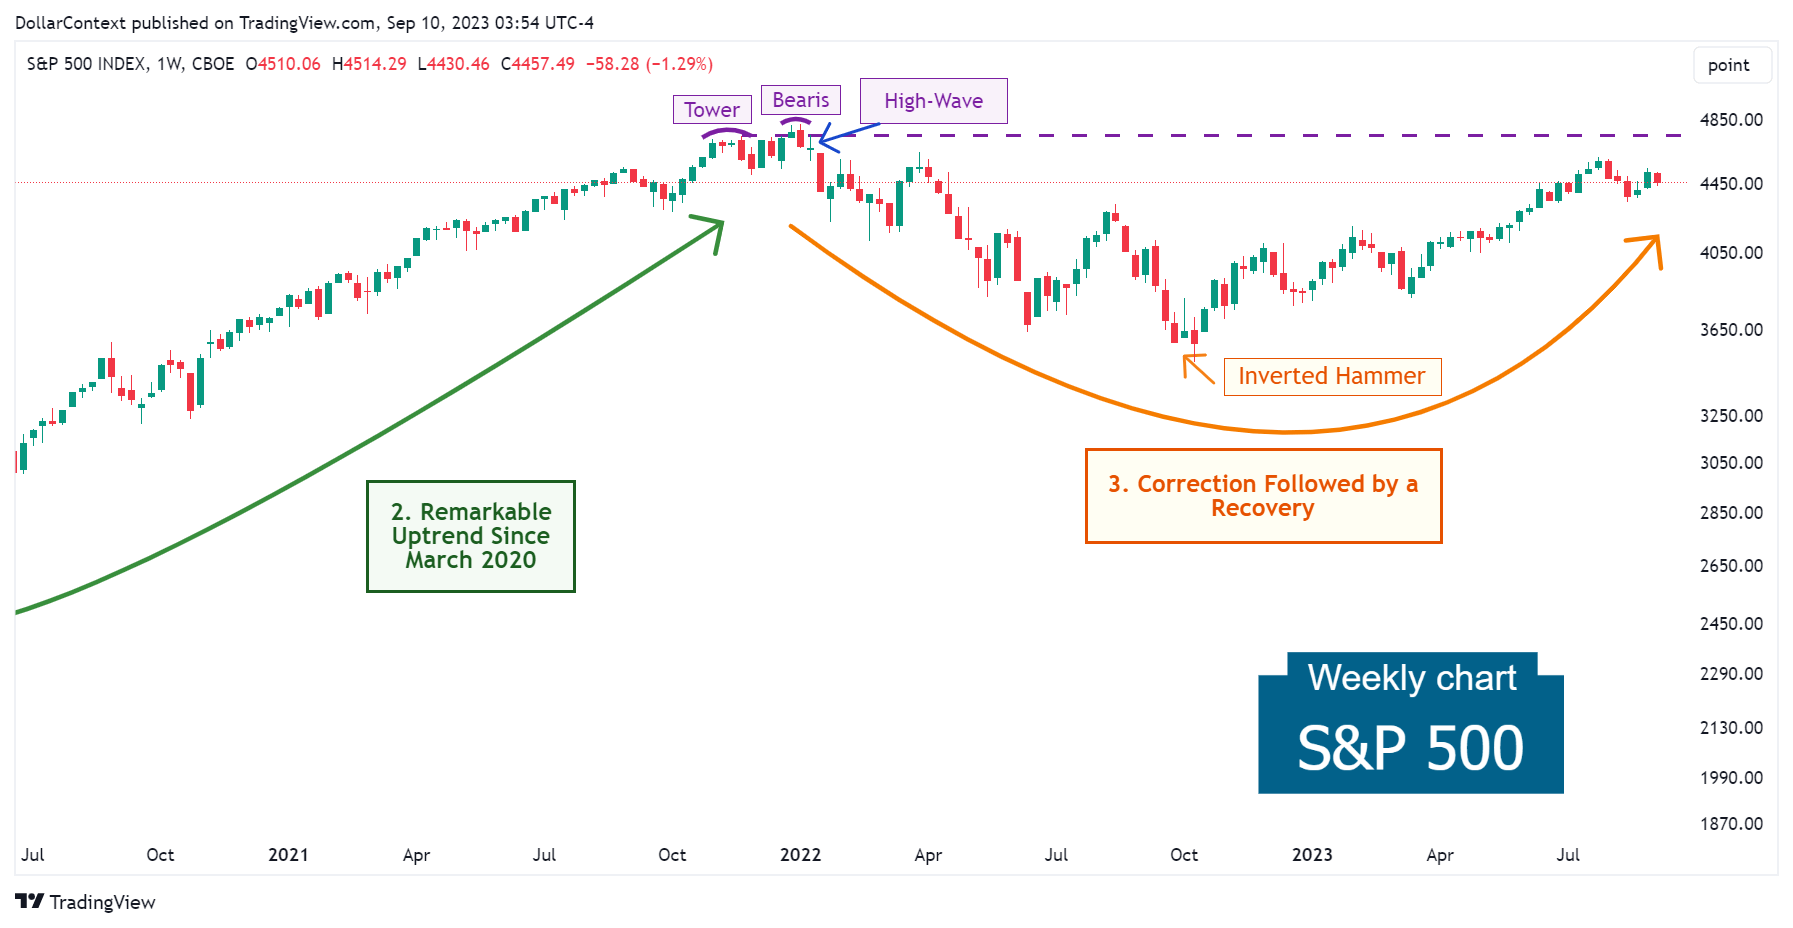
3. January 2022–August 2023: The Correction Followed by a Resurgence to the Highs
Surging inflation indicators led the Federal Reserve to embark on an aggressive cycle of interest rate hikes, aimed at countering inflation and mitigating economic growth.
The central banks' shift towards more restrictive policies cast a shadow over the equity market. This sentiment was manifested in a significant decline in the S&P 500.
Amid an atmosphere of pronounced bearish market sentiment, the S&P 500's correction concluded with an inverted hammer in the first week of October 2022. A rally to prior highs ensued thereafter.
4. Outlook for Late 2023 and Throughout 2024
While the short-term outlook for the S&P 500 index is still uncertain, the following key factors may have a major impact on the future trajectory of the S&P 500:
- AI's Influence on Enhancing Productivity: As we navigate the age of artificial intelligence (AI), its capacity to amplify efficiency and productivity is driving a growing interest in equities and equity indices, including the S&P 500.
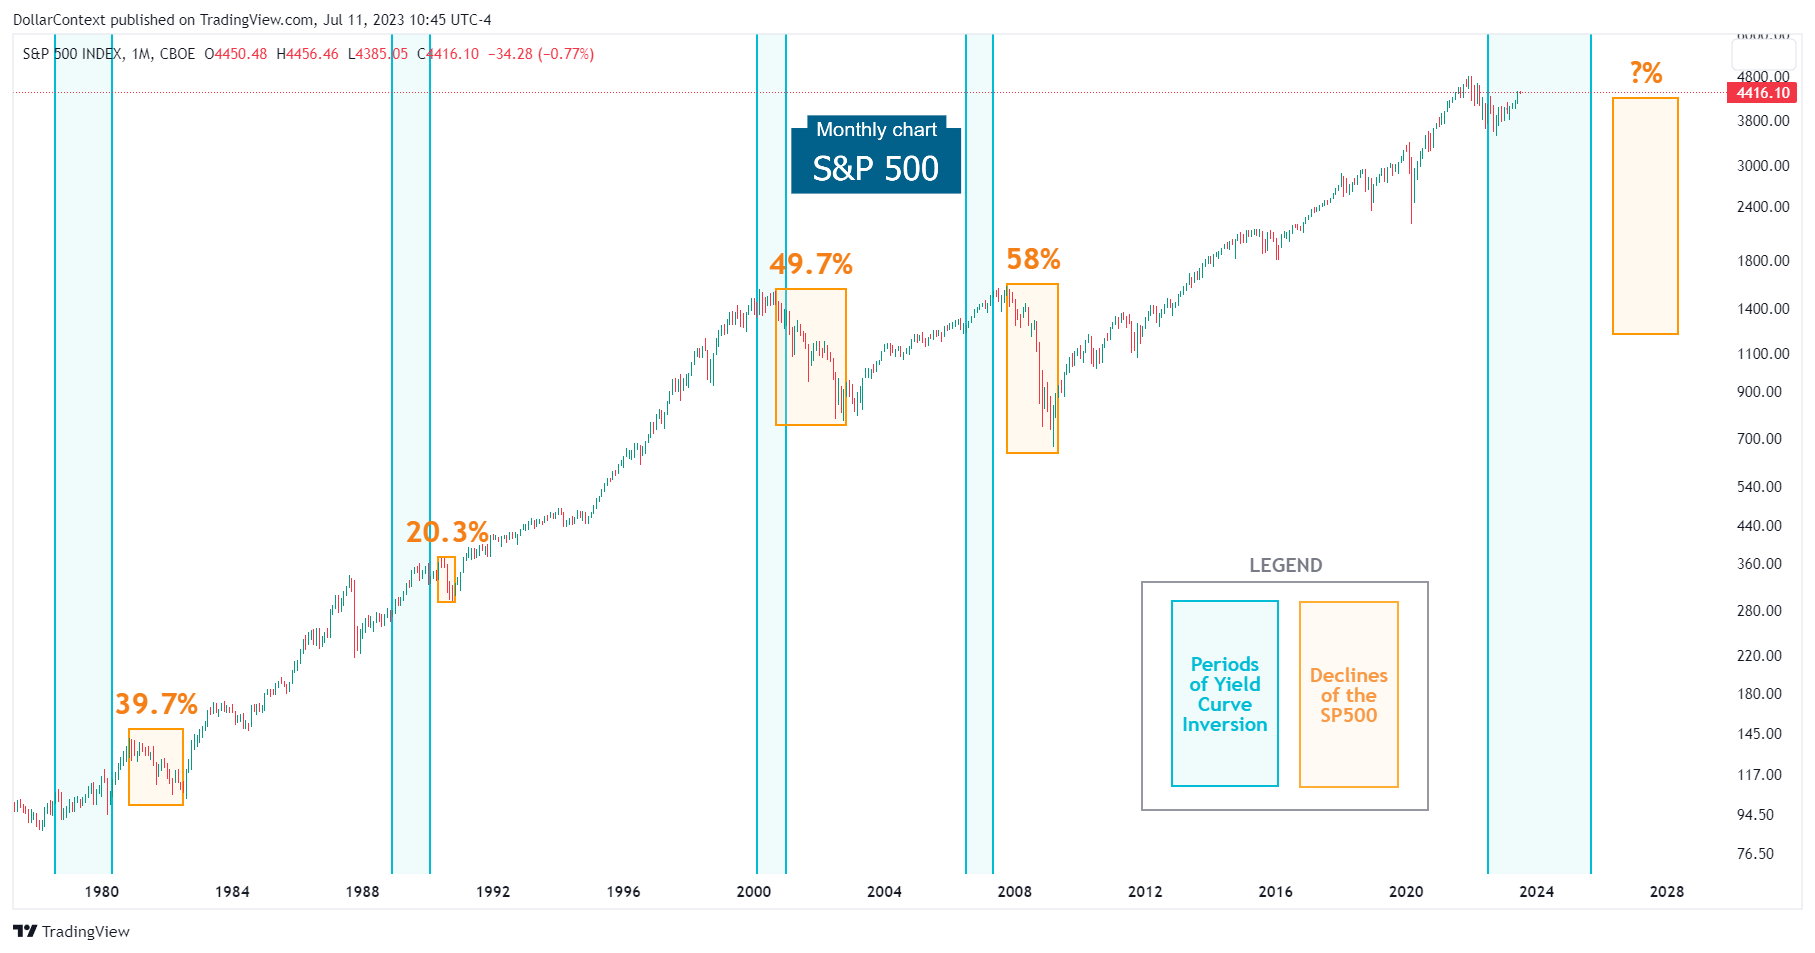
- Potential Economic Downturn Risks: The Federal Reserve's bold interest rate hikes, combined with concerning indicators like the inverted yield curve, point toward a potential economic downturn at some point in 2024.
- Equity Market Behavior in the Context of Yield Curve Inversion: Historical data suggests that appetite for riskier assets remains strong either when a yield curve inversion begins or throughout its duration. The shift towards safer investments and the resulting decline in equities generally occur in the advanced stages, often as the curve approaches or completes a "reinversion".
The chart below depicts the performance of the S&P 500 during recessionary periods.
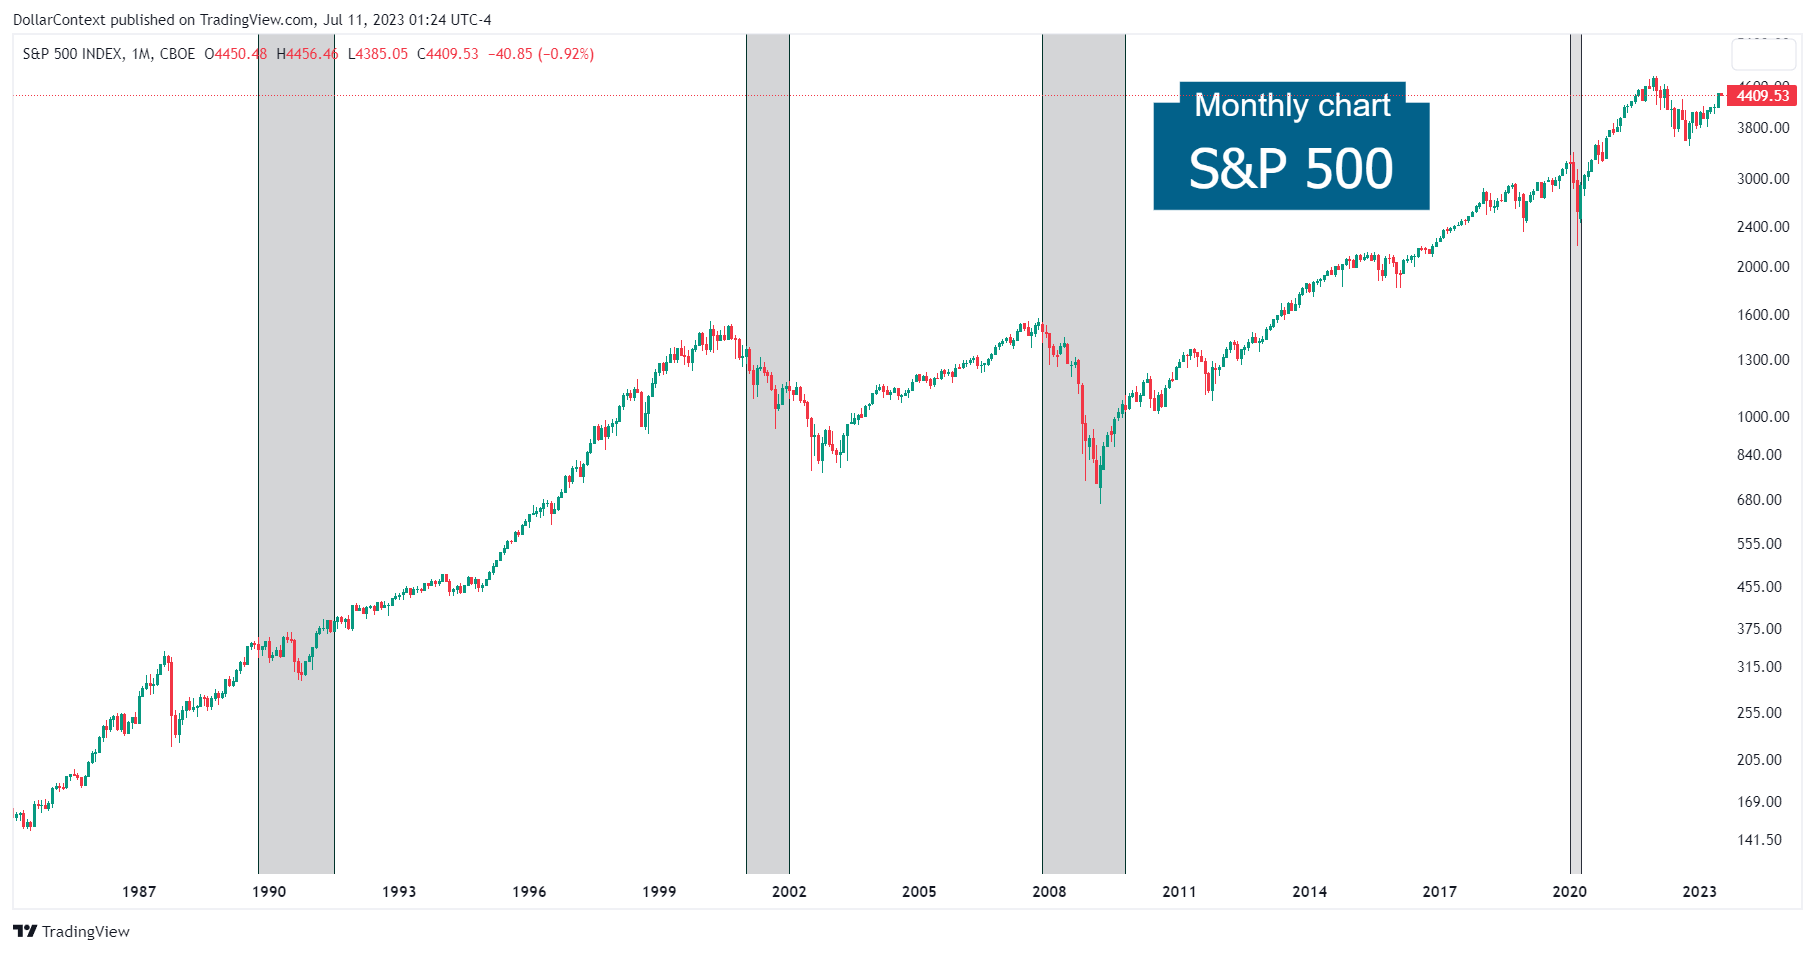
The following showcases the S&P 500's performance during and after a period of yield curve inversion.
