Timing Strategies for Shorting the S&P 500 During Recessions
Typically, the SP500 tends to initiate a downtrend concurrently or slightly ahead of the onset of an economic downturn.
This article examines historical market behavior across multiple cycles to identify recurring patterns and structural tendencies. It is intended for educational and analytical purposes and does not reflect current market conditions.
There are multiple signals that we’re heading for a recession:
- Hiking Cycle from the Fed: In less than 15 months (from March 2022 until June 2023), the Fed has increased the federal funds rate from 0% to above 5%. Eventually, the effects of a hiking cycle of this magnitude will trickle through the financial system and unleash a cascade of significant repercussions on the economy.
- Deterioration of Leading Indicators: Many leading indicators, including consumer confidence, PMI, and commodity prices, have experienced a considerable and sustained deterioration over the past several months.
- Inverted Yield Curve: Since July 2022, the yield curve has displayed a significant and persistent inversion. The yield curve has been one of the most reliable indicators of US recessions.
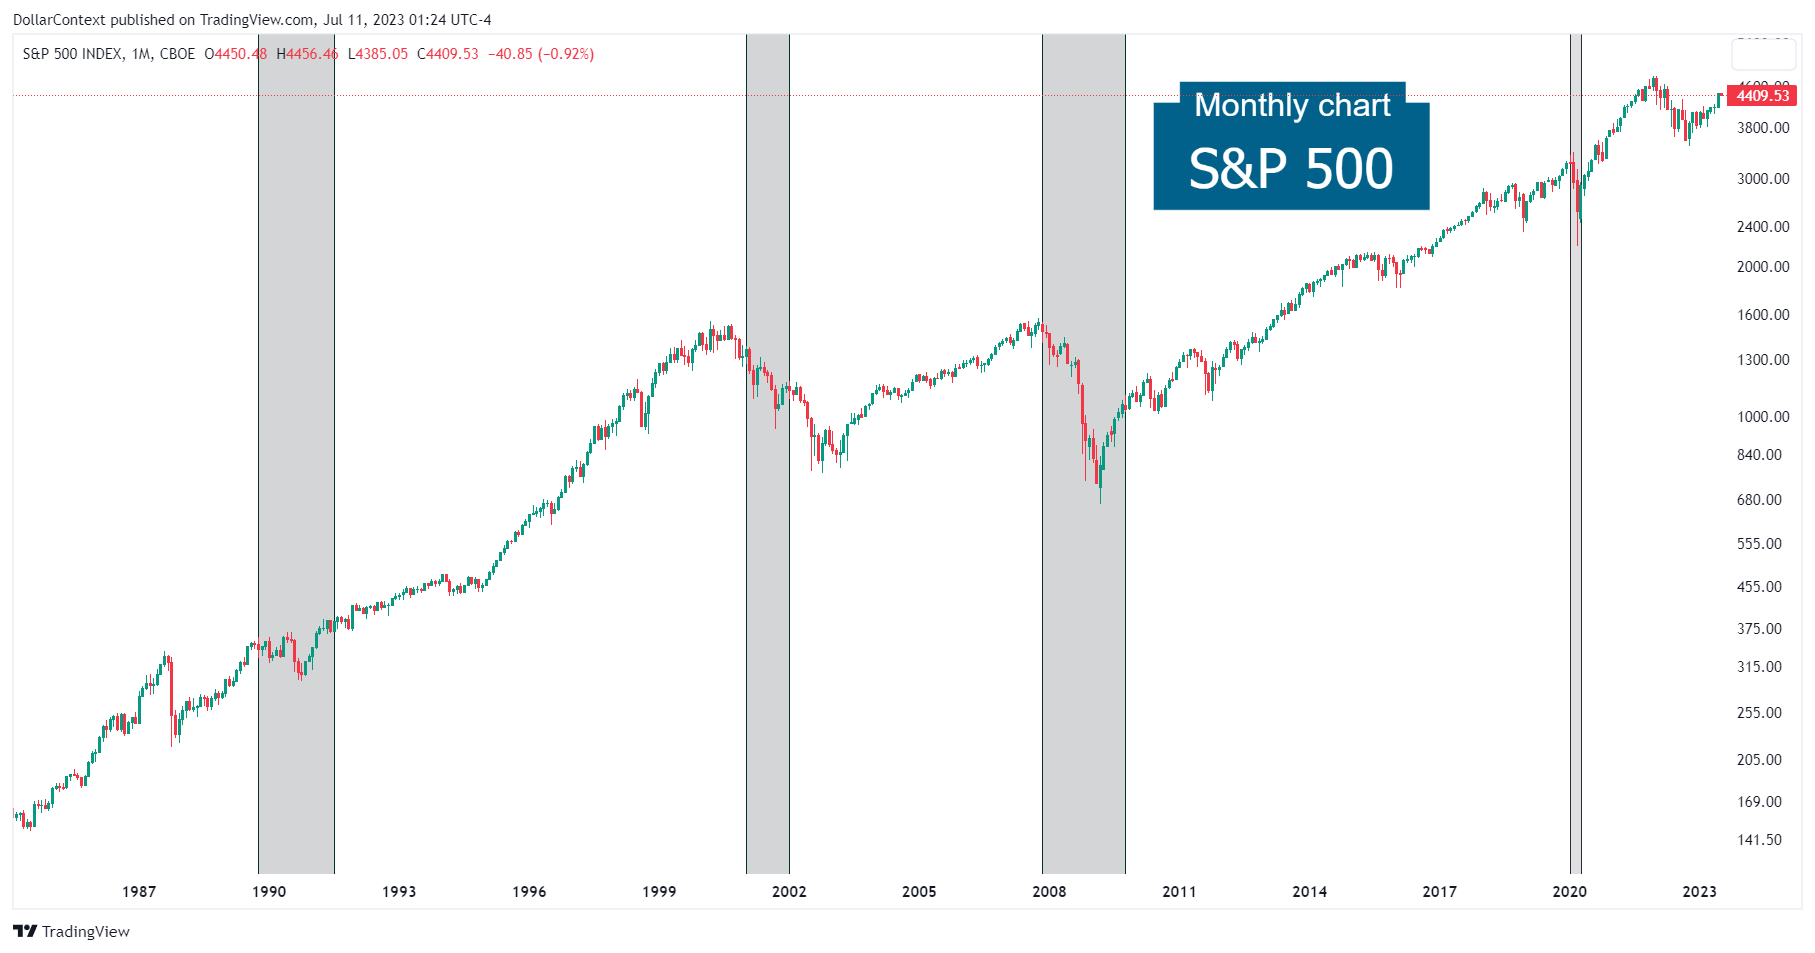
Performance of the S&P 500 During Recessions
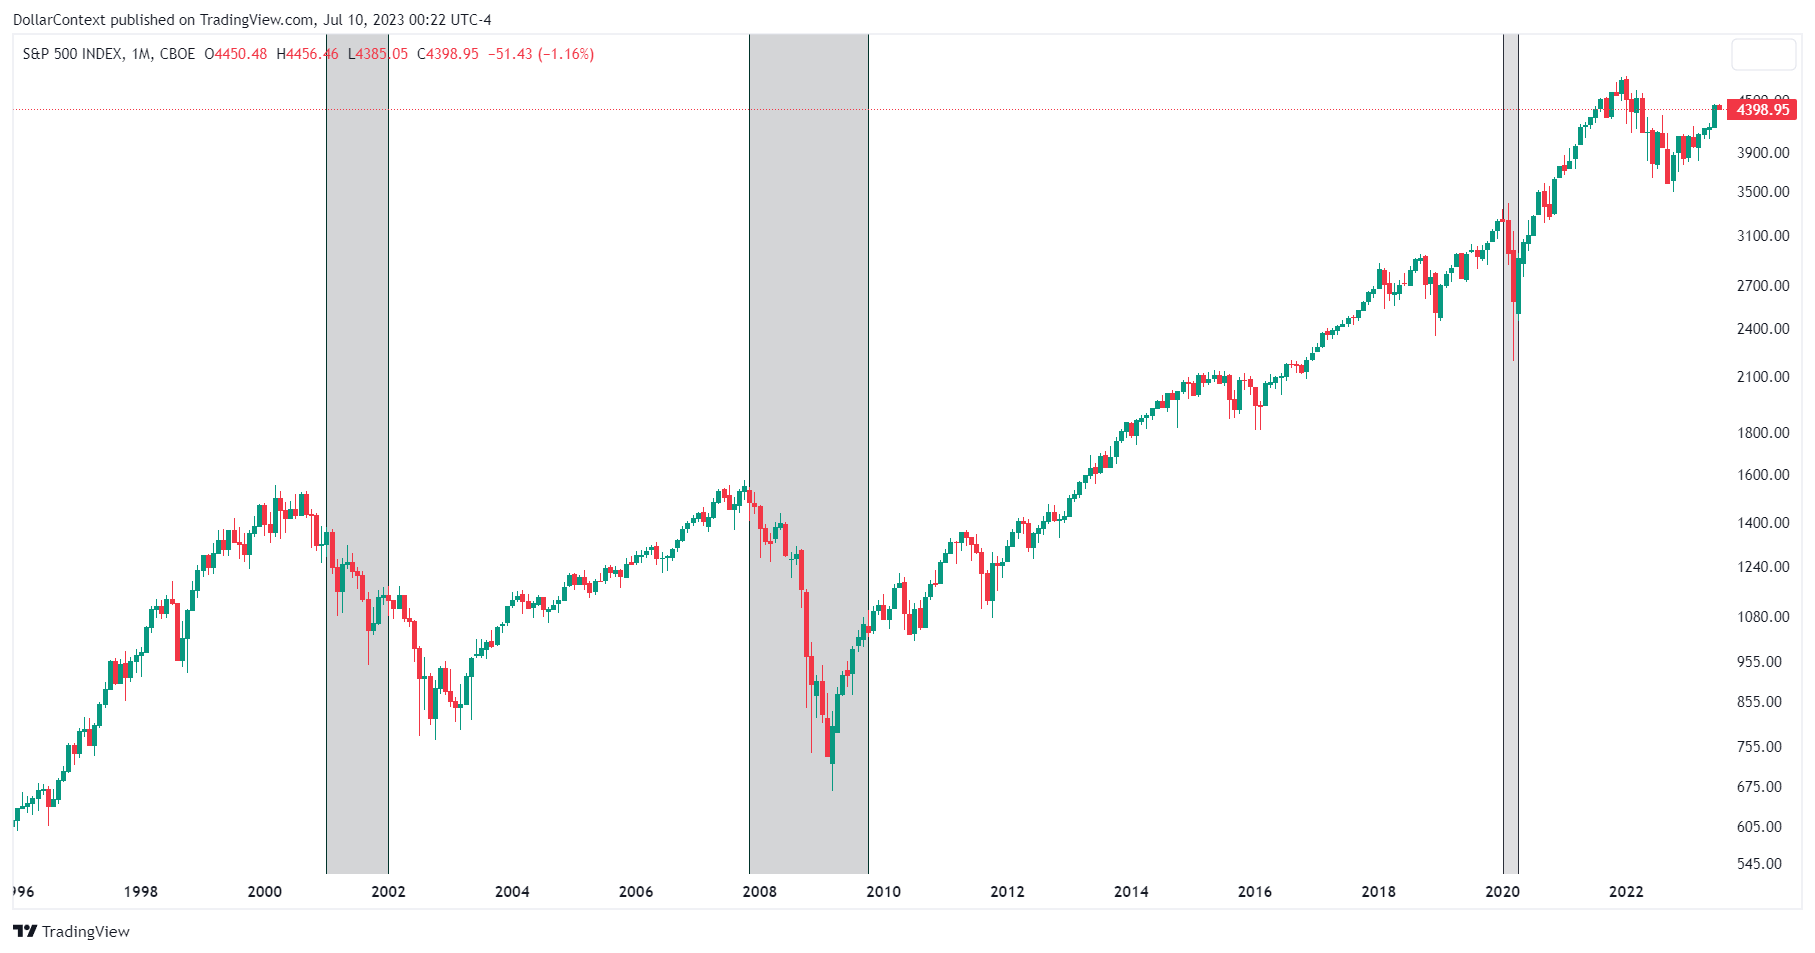
Typically, the S&P 500 tends to initiate a downtrend concurrently or slightly ahead of the onset of an economic downturn.
When does the process of recovery start? Usually around the middle or towards the conclusion of the recession period (occasionally slightly thereafter), the stock market index enters a phase of recovery.
Source: Federal Reserve Bank of St. Louis, National Bureau of Economic Research
The Risk of Shorting the S&P 500 Too Early
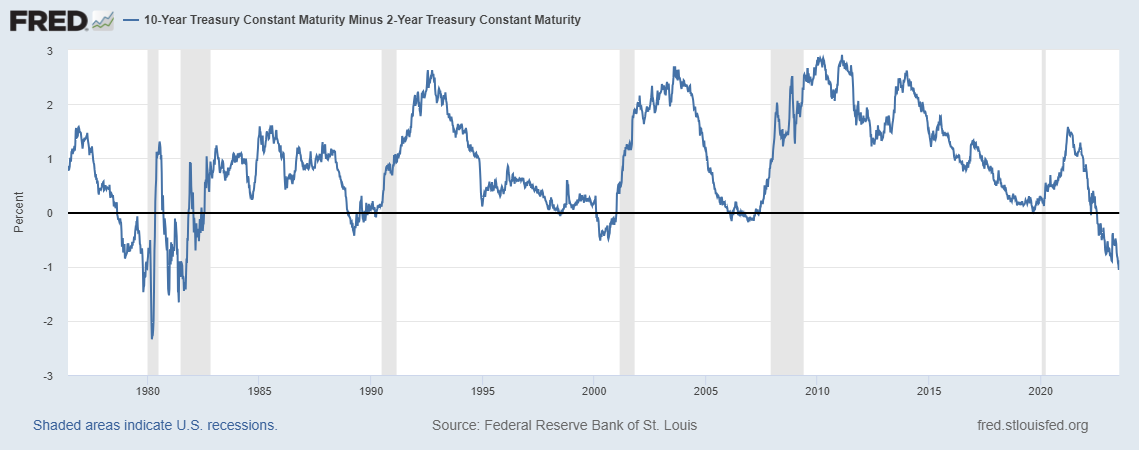
Being one of the most reliable signals of recessions, the yield curve indicator enables us to be vigilant before the selloff. The following chart shows that an inverted yield curve (blue line below 0) almost always anticipates a recession (shaded area).
Source: Federal Reserve Bank of St. Louis
Notice that the S&P 500 tends to grind higher, sometimes for a prolonged period, after the yield curve inverts. Typically, the rally reaches its peak just before the onset of the recession.
By contrast, the unemployment rate (blue line on the chart below) is a lagging indicator of changes in the business cycle (recessions are indicated by shaded areas).
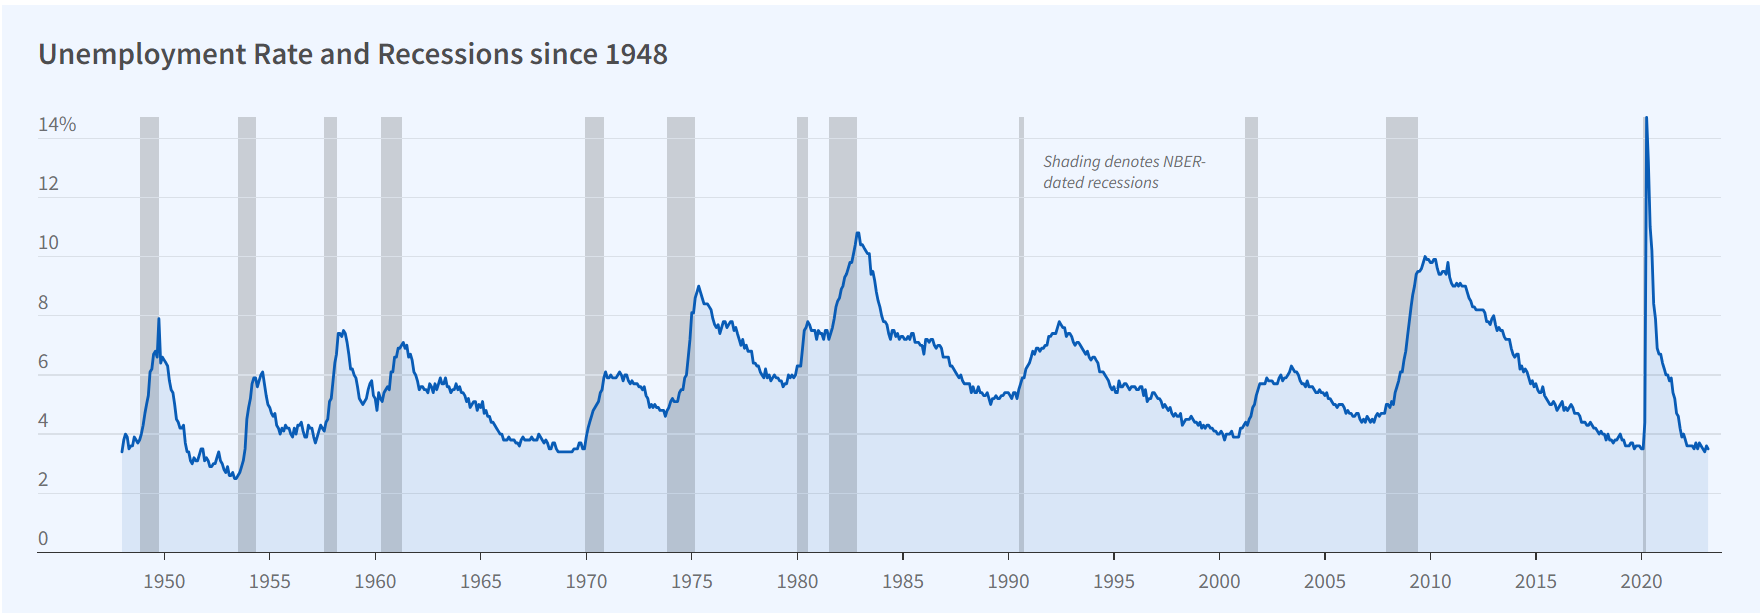
Source: Federal Reserve Bank of St. Louis, National Bureau of Economic Research


