WHEAT
Wheat Prices: A Look Back and Ahead
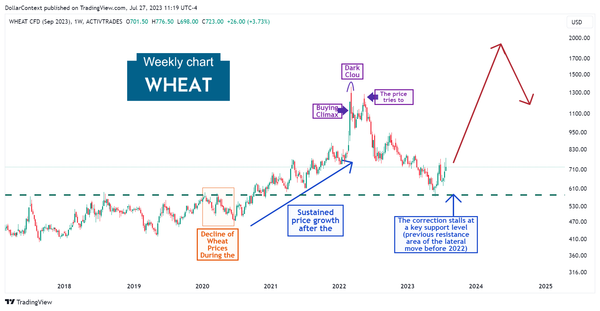
We delve into the key driving forces that have been shaping the wheat market since 2020. Then, we speculate on the potential trajectory this market might take.
WHEAT
We delve into the key driving forces that have been shaping the wheat market since 2020. Then, we speculate on the potential trajectory this market might take.
CANDLESTICK
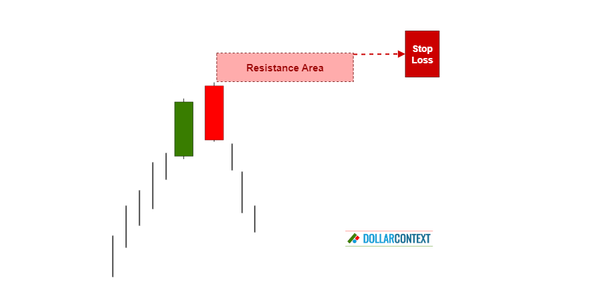
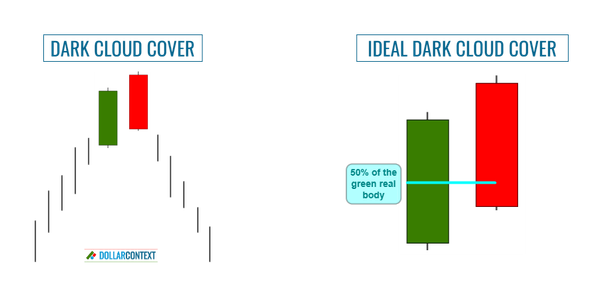
The highs of the dark cloud cover creates a resistance area. This resistance level represents your initial stop loss.
SILVER
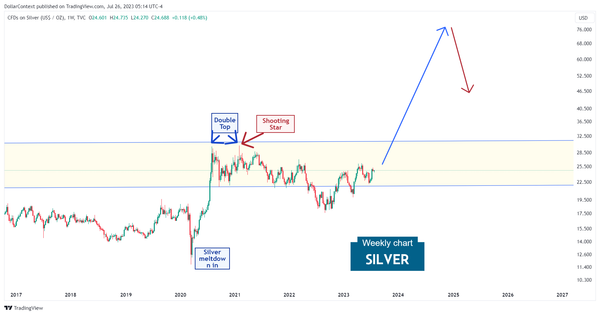
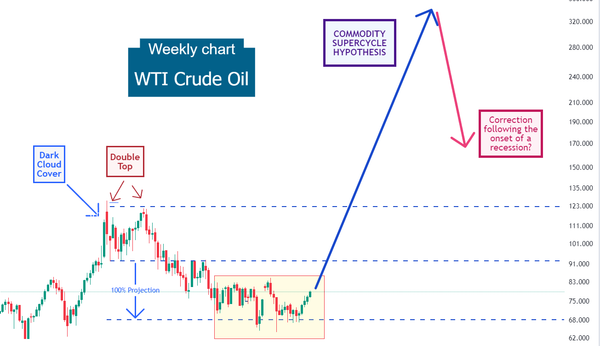
Evidently, this particular scenario may not come to fruition. Nevertheless, we deem it a likely outcome. Episodes of profound collapses and panic, similar to the one observed in 2020, frequently precede commodity supercycles.
CANDLESTICK
This sudden reversal surprises those participants who had been expecting the upward trend to continue.
CRUDE OIL
Starting in 2020, the commodity market may have entered a supercycle phase. Such supercycles usually extend beyond 8 years and lead to substantial price escalations.
CANDLESTICK
For an optimal dark cloud cover, the second session should ideally conclude below the midpoint of the preceding white/green candle.
COPPER
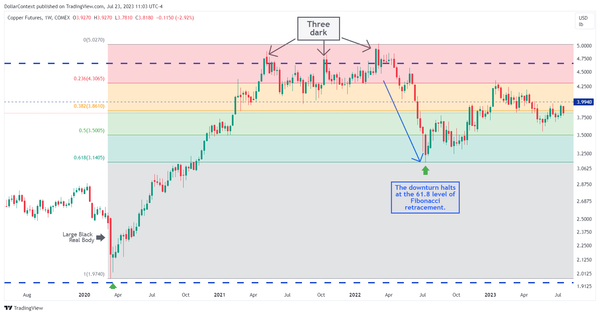
Scenario 1. Since 2020, the commodity market might have been going through a supercycle. Scenario 2. Copper could be undergoing a brief correction phase before retesting the lows of 2022. The catalyst for this scenario might be a recession expected to materialize in 2024.
HIGH-WAVE
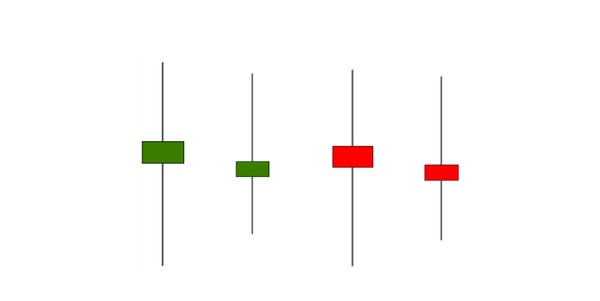
The high-wave candle is characterized by its distinct long upper and lower shadows, which are significantly longer than the candle's real body.

AI
Artificial intelligence (AI) is revolutionizing the economy by substantially enhancing efficiency and productivity. That is, we are witnessing the early phases of what could very well become a transformative era in our history.
HIGH-WAVE
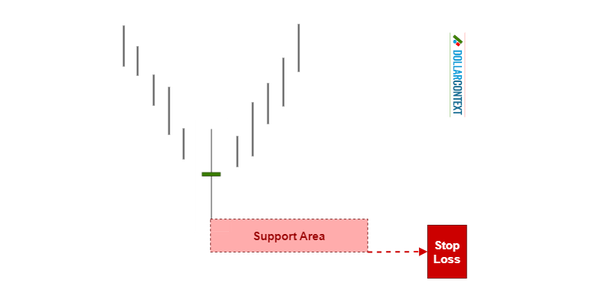
After a downtrend, the lowest price reached during the high-wave’s session sets up a support level.

GDP
Instead of a soft landing, a "hard landing" scenario will come to fruition at some point. When? While the timing is uncertain, the collapse may be delayed until somewhere next year.
CANDLESTICK
A high-wave candle reflects equilibrium, indecision, and volatility: a tug of war between buyers and sellers signaling a reversal or transition.