CANDLESTICK
What Is an Engulfing Pattern Variation?
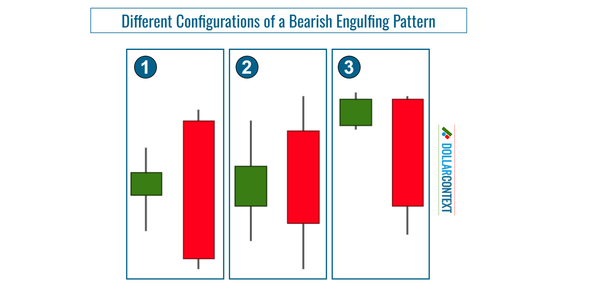
Not all engulfing patterns are equally relevant. They can be presented in different configurations or variations.


CANDLESTICK
Not all engulfing patterns are equally relevant. They can be presented in different configurations or variations.
ANALYSIS
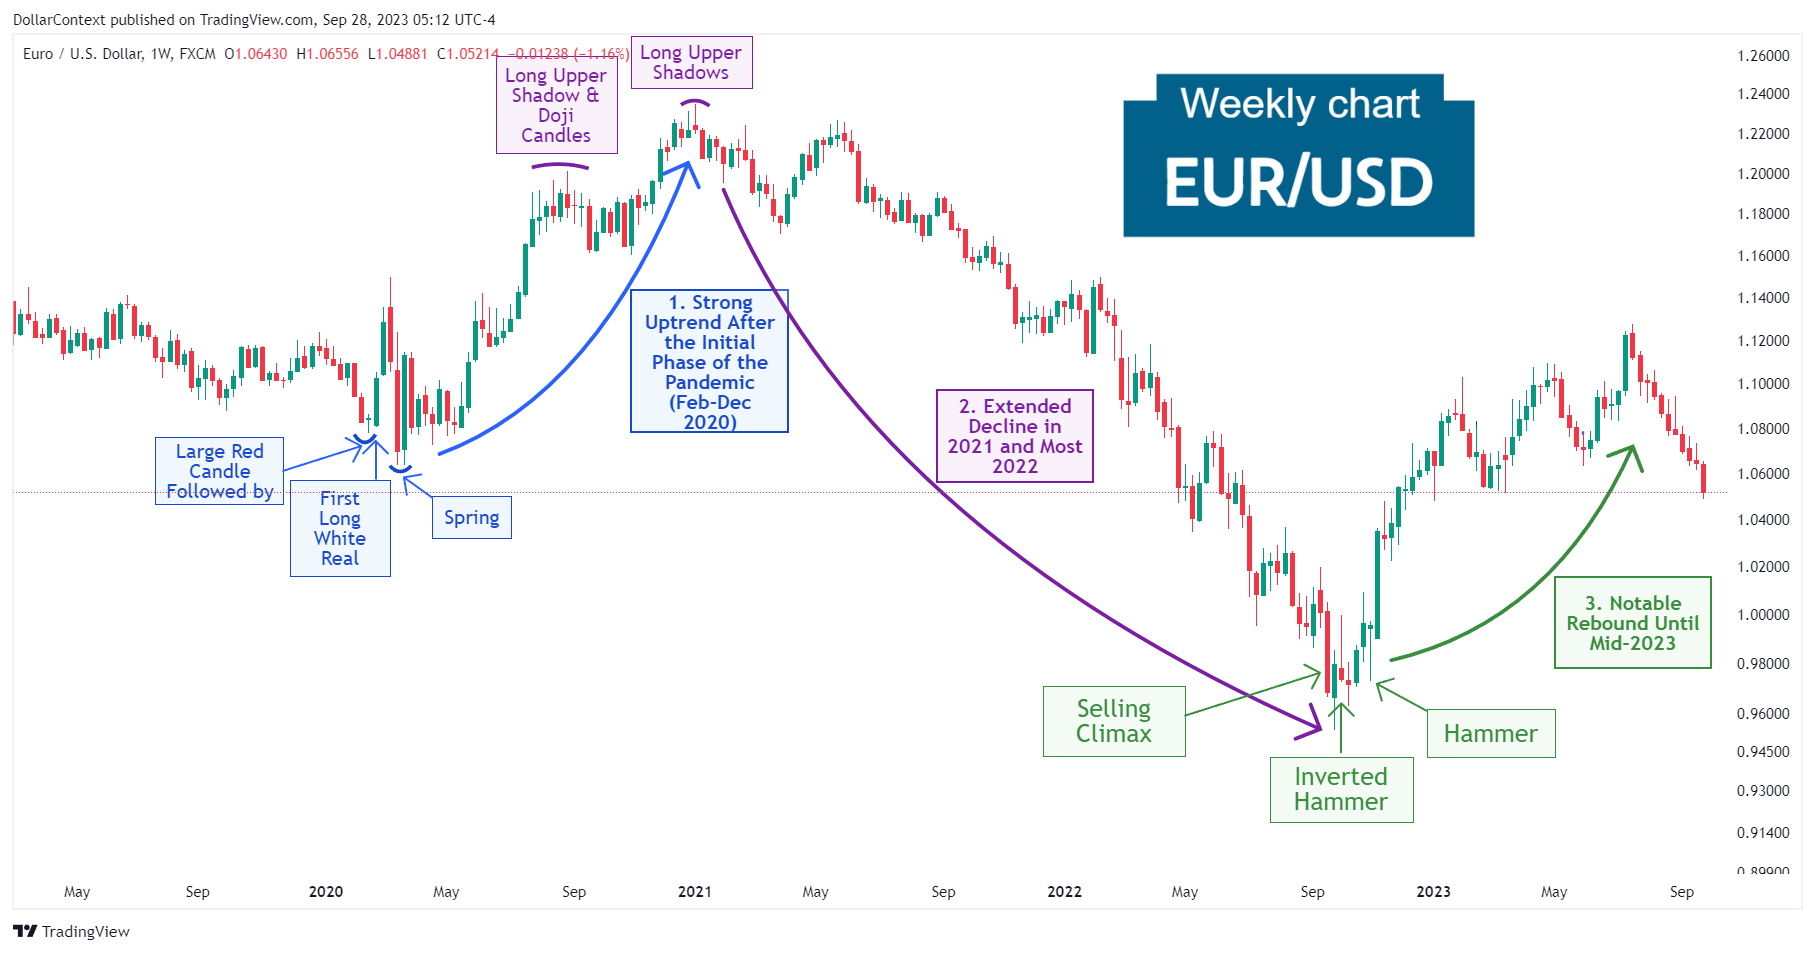
We'll examine the drivers that have shaped the EUR/USD pair since 2020 and wrap up by discussing the pair's future movements.
STOP-LOSS
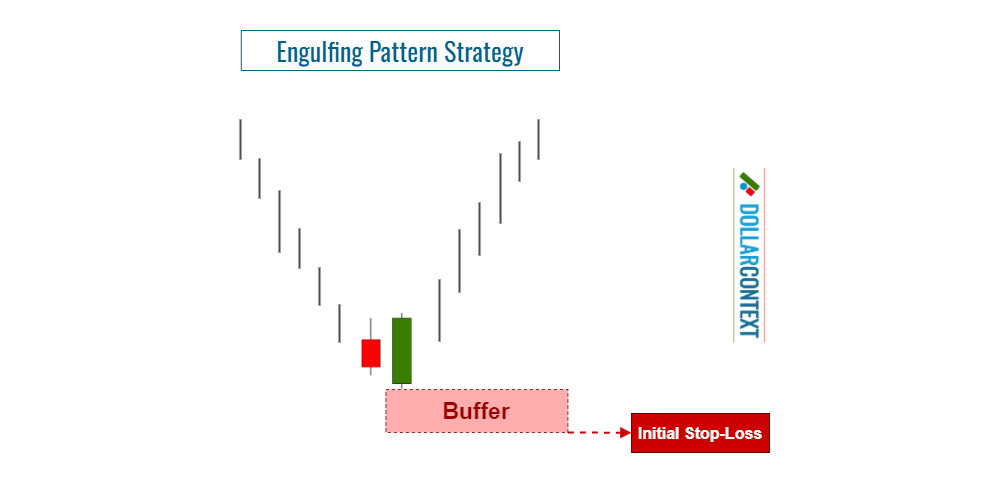
In this post, we'll explore effective strategies to set a stop-loss when using an engulfing pattern to open a market position.
CANDLESTICK
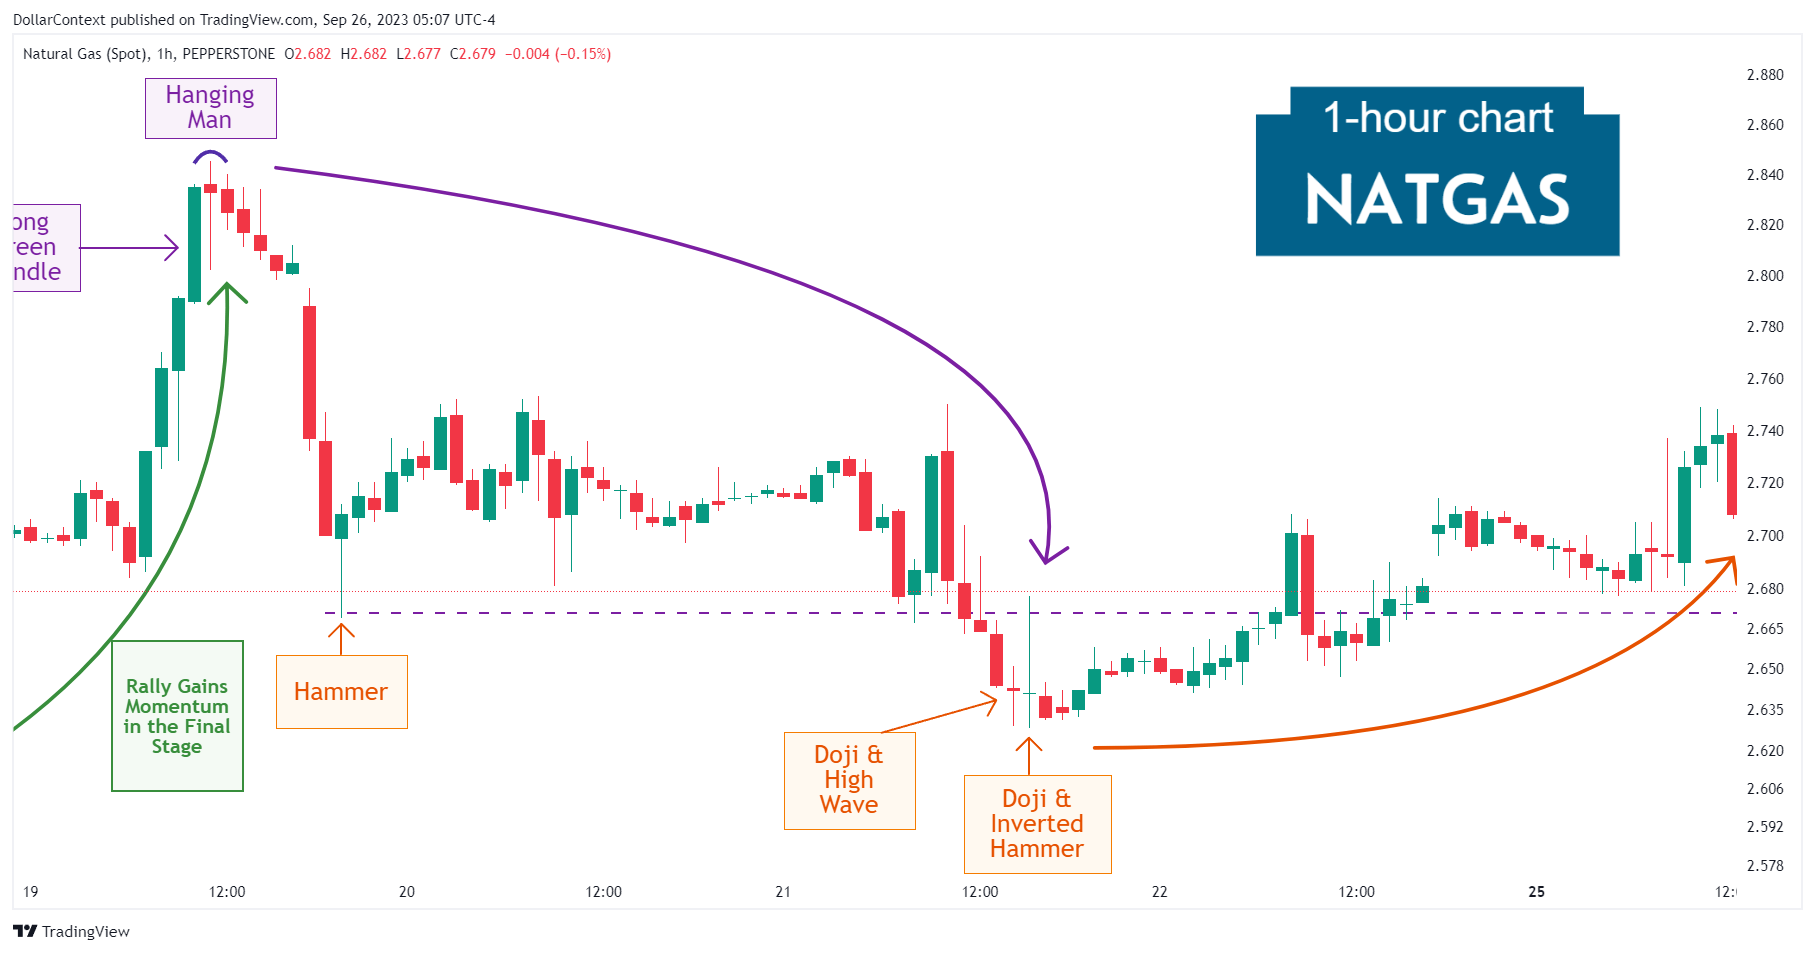
In this article, we will discuss the performance of a highly volatile market in which specific candlestick patterns effectively signaled price tops and bottoms.
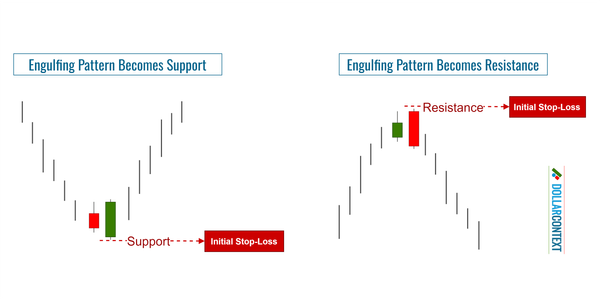
CANDLESTICK
After an uptrend, the price range associated with a bearish engulfing pattern becomes resistance. The same applies in reverse.
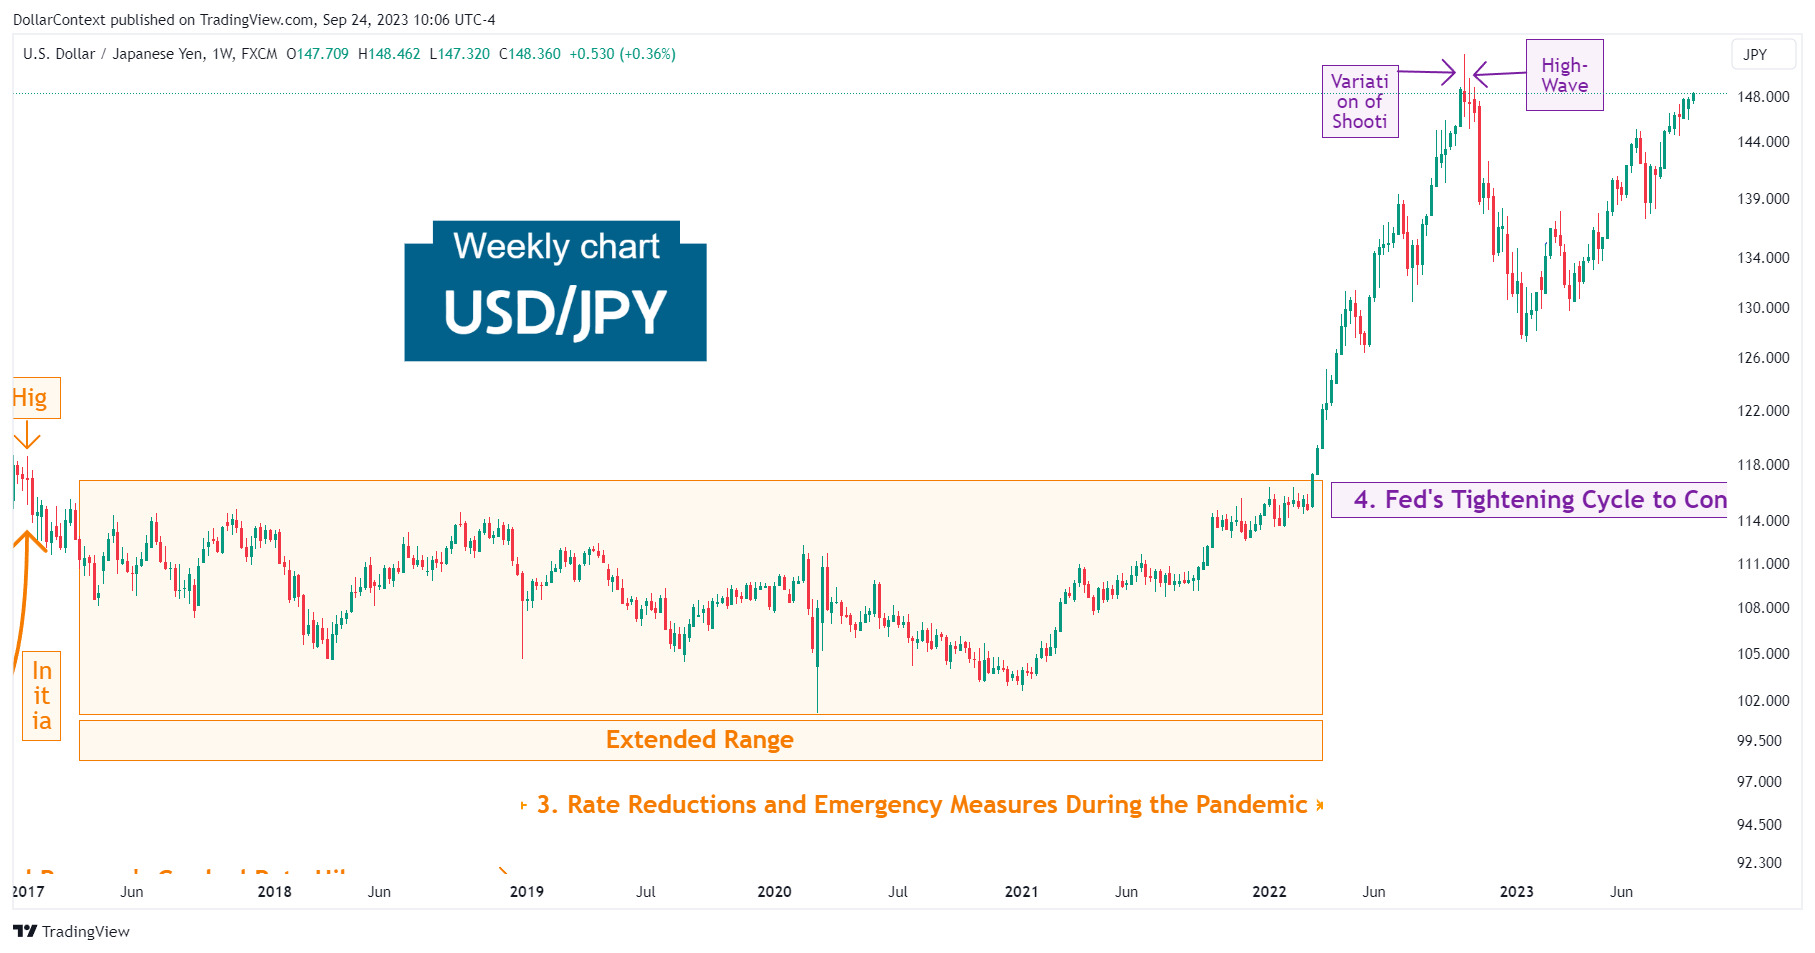
ANALYSIS
We cover the primary forces that have influenced the trajectory of the USD/JPY since 2009 and conclude by delving into potential factors that could steer the future of this market.
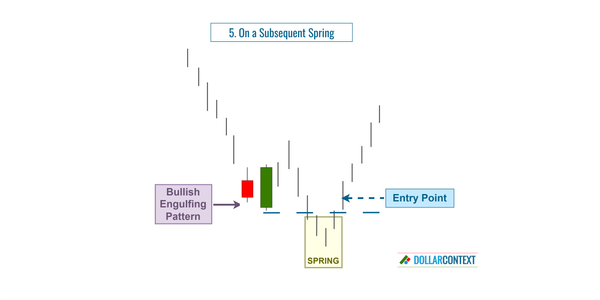
CANDLESTICK
In this article, we discuss the different options for entry points after the appearance of an engulfing pattern.
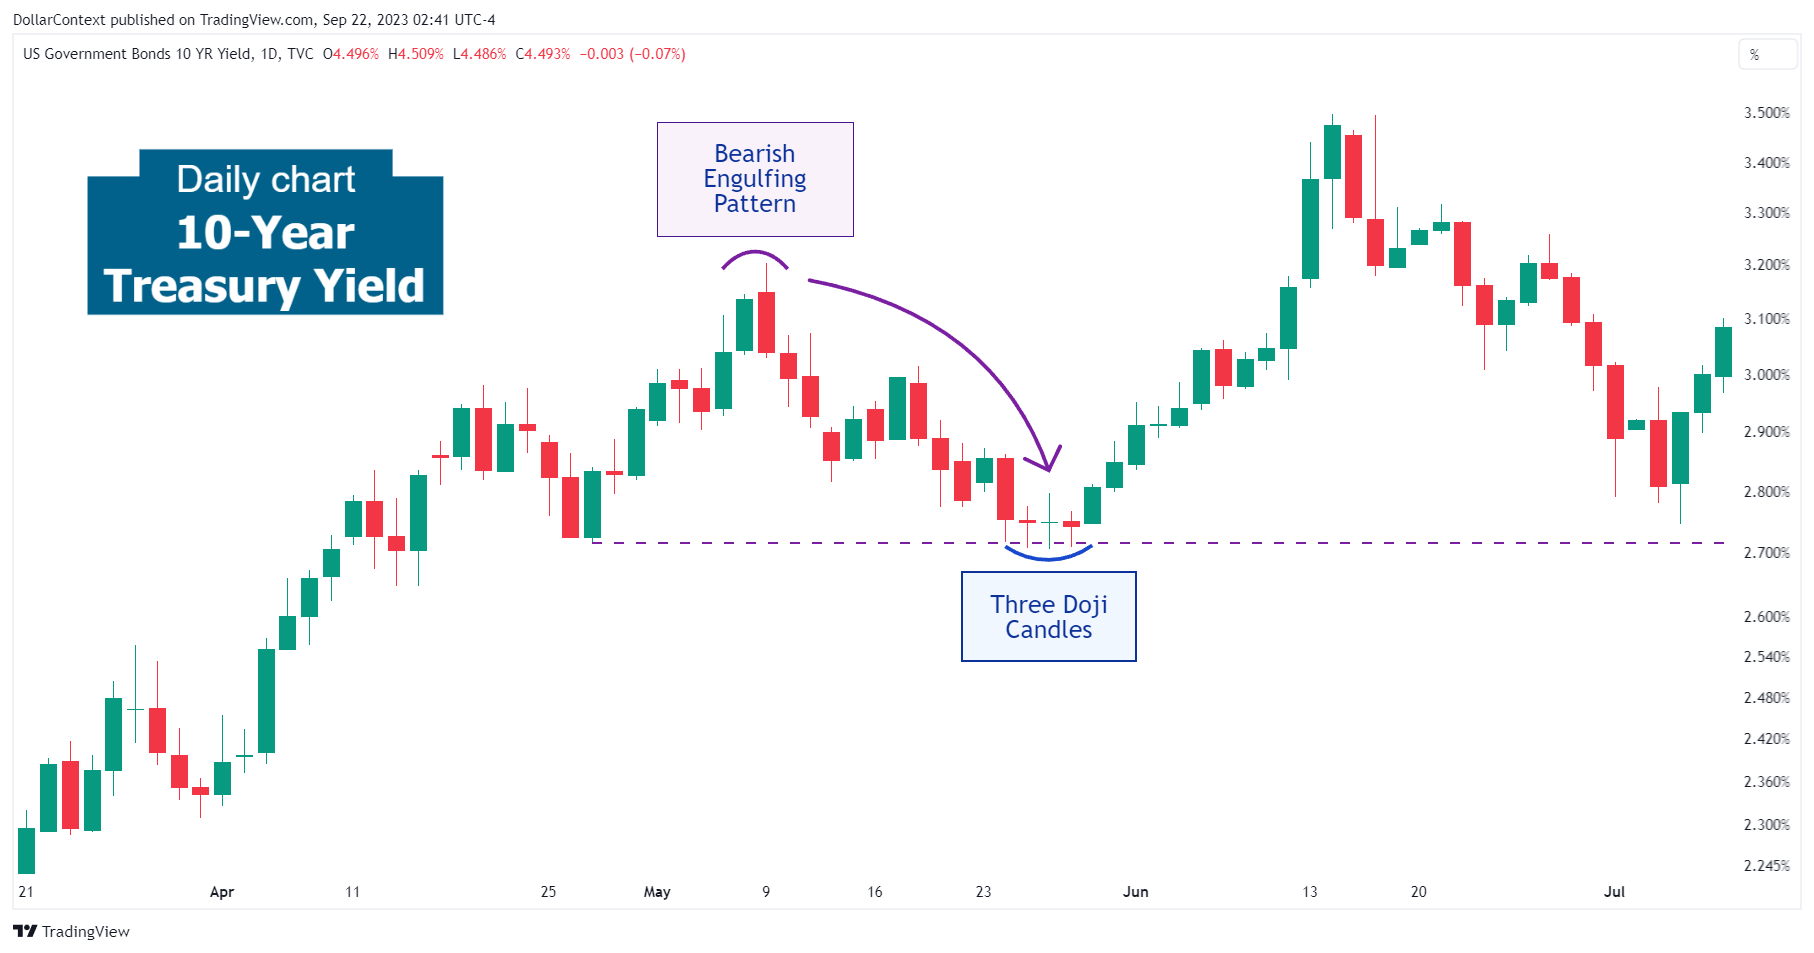
CANDLESTICK
Following the appearance of the bearish engulfing pattern, there was a high likelihood of either a sideways trading range or a minor retracement.

CANDLESTICK
By understanding these psychological aspects, traders can better anticipate the potential market's response to an engulfing pattern and adjust their strategies accordingly.
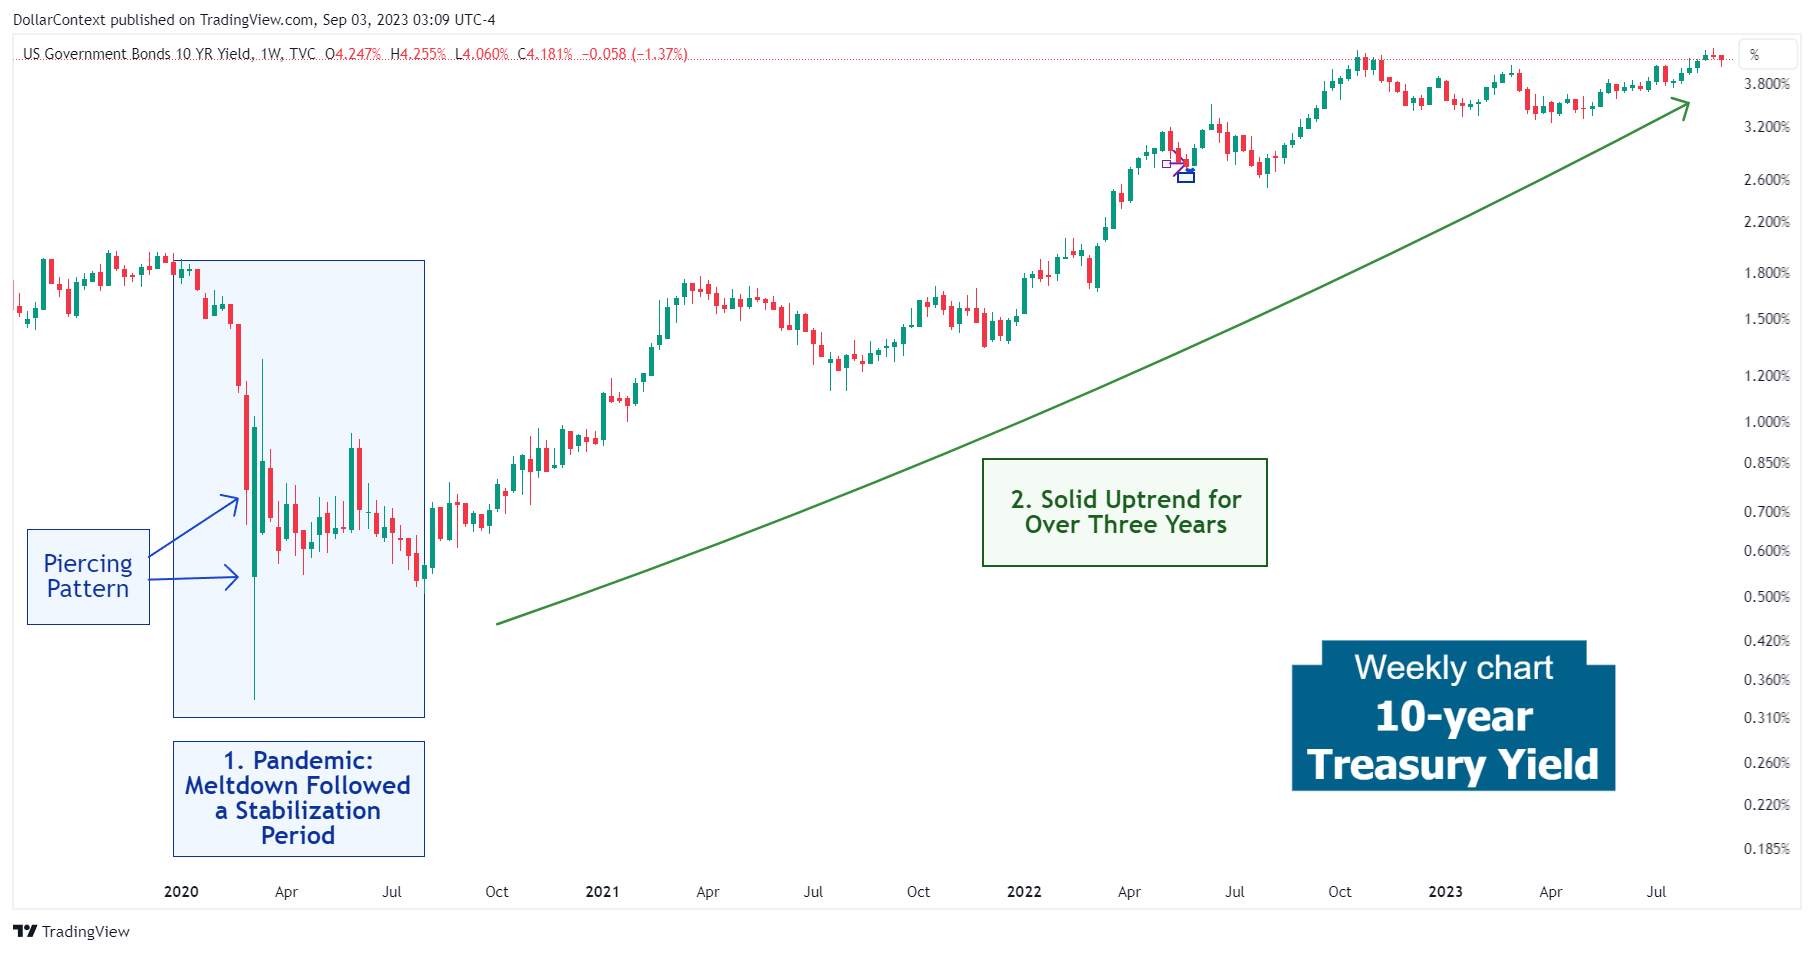
STOCKS
We'll explore the dynamics that have shaped the course of the major U.S. equity indices and provide insights about the potential future of this market.
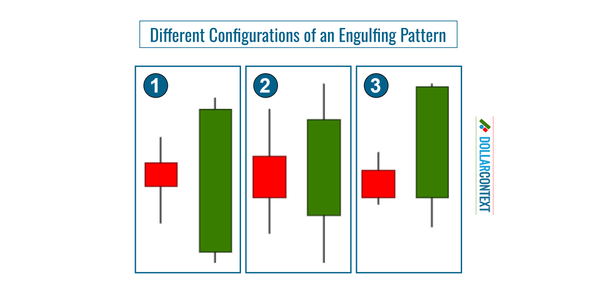
CANDLESTICK
In this article, we'll explore the different shapes of an engulfing pattern and how to identify this candlestick indicator.
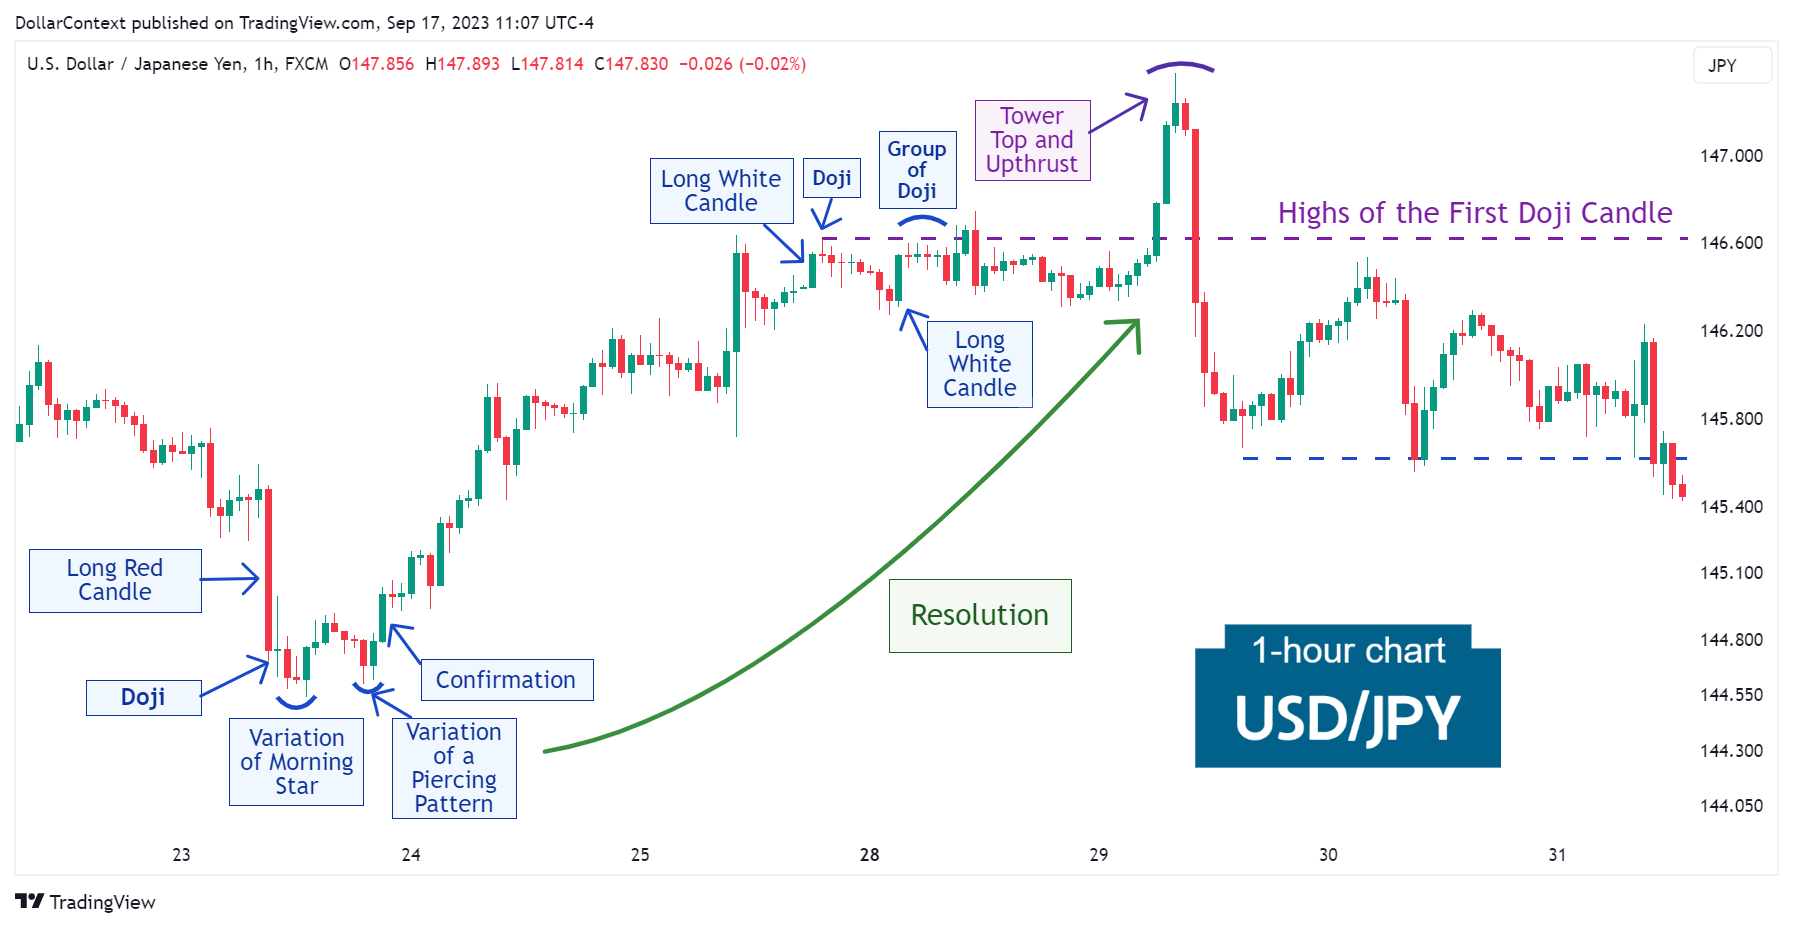
CANDLESTICK
After an extended downtrend, the USD/JPY exhibited an exceptionally long red candle followed by a doji.