
Case Study 0002: Weak Engulfing Pattern Transitions Into a Pullback (10-Year Treasury)
Following the appearance of the bearish engulfing pattern, there was a high likelihood of either a sideways trading range or a minor retracement.


In this article, we will examine a subtle movement in the 10-year Treasury market following the appearance of a weak signal: a bearish engulfing pattern where both real bodies are roughly the same size.
Data Sheet
- Reference: CS0002
- Security: 10-Year Treasury Yield
- Timeframe: Daily Chart (May 2022)
- Patterns:
- Bearish Engulfing Pattern
- Doji
1. Signal Formation
In May 2022, after an extended uptrend that began in 2020, the 10-year Treasury yield displayed a weak bearish engulfing pattern. Note how the green and red candles of this pattern were about equal.
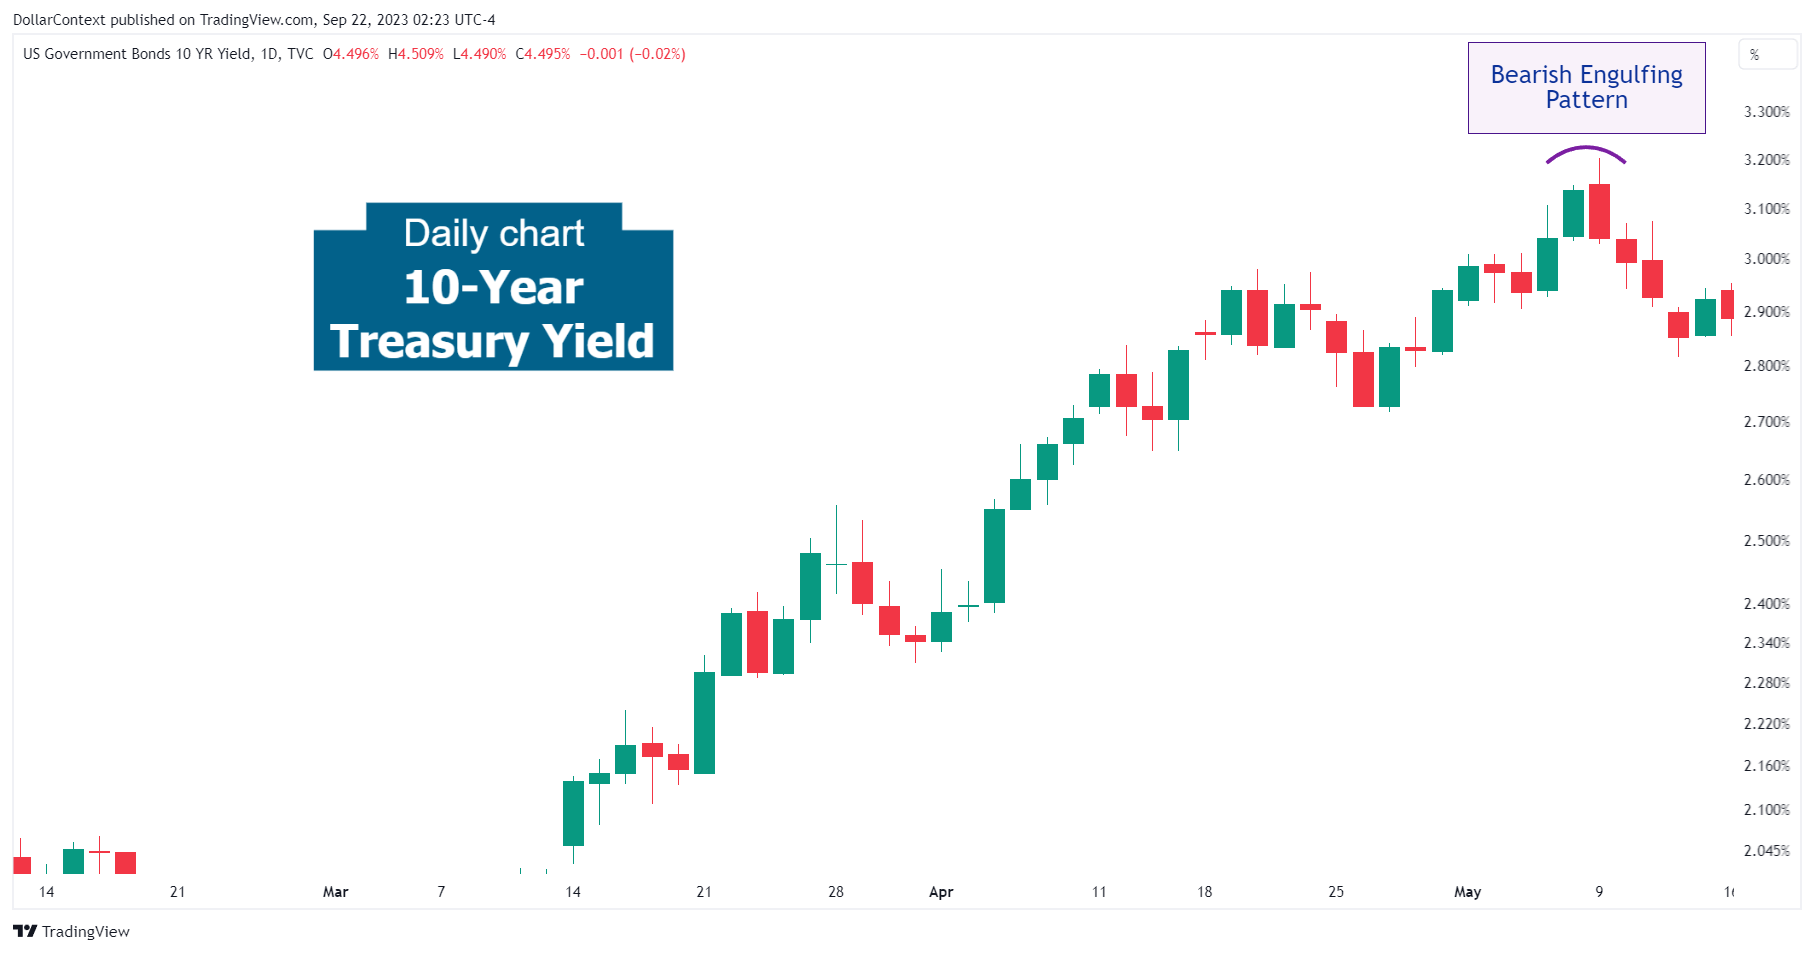
Why do we categorize this pattern as a weak engulfing pattern? An ideal engulfing pattern has a large body enveloping a small green body. The small size of the first small body of a bearish engulfing pattern shows that the momentum of the prior rally is slackening. The subsequent tall red body confirms the bears' dominance over the bulls.
However, if there are two almost equal size candles that comprise the engulfing pattern, the market may move into a lateral band or a minor pullback.
2. Early Market Transition
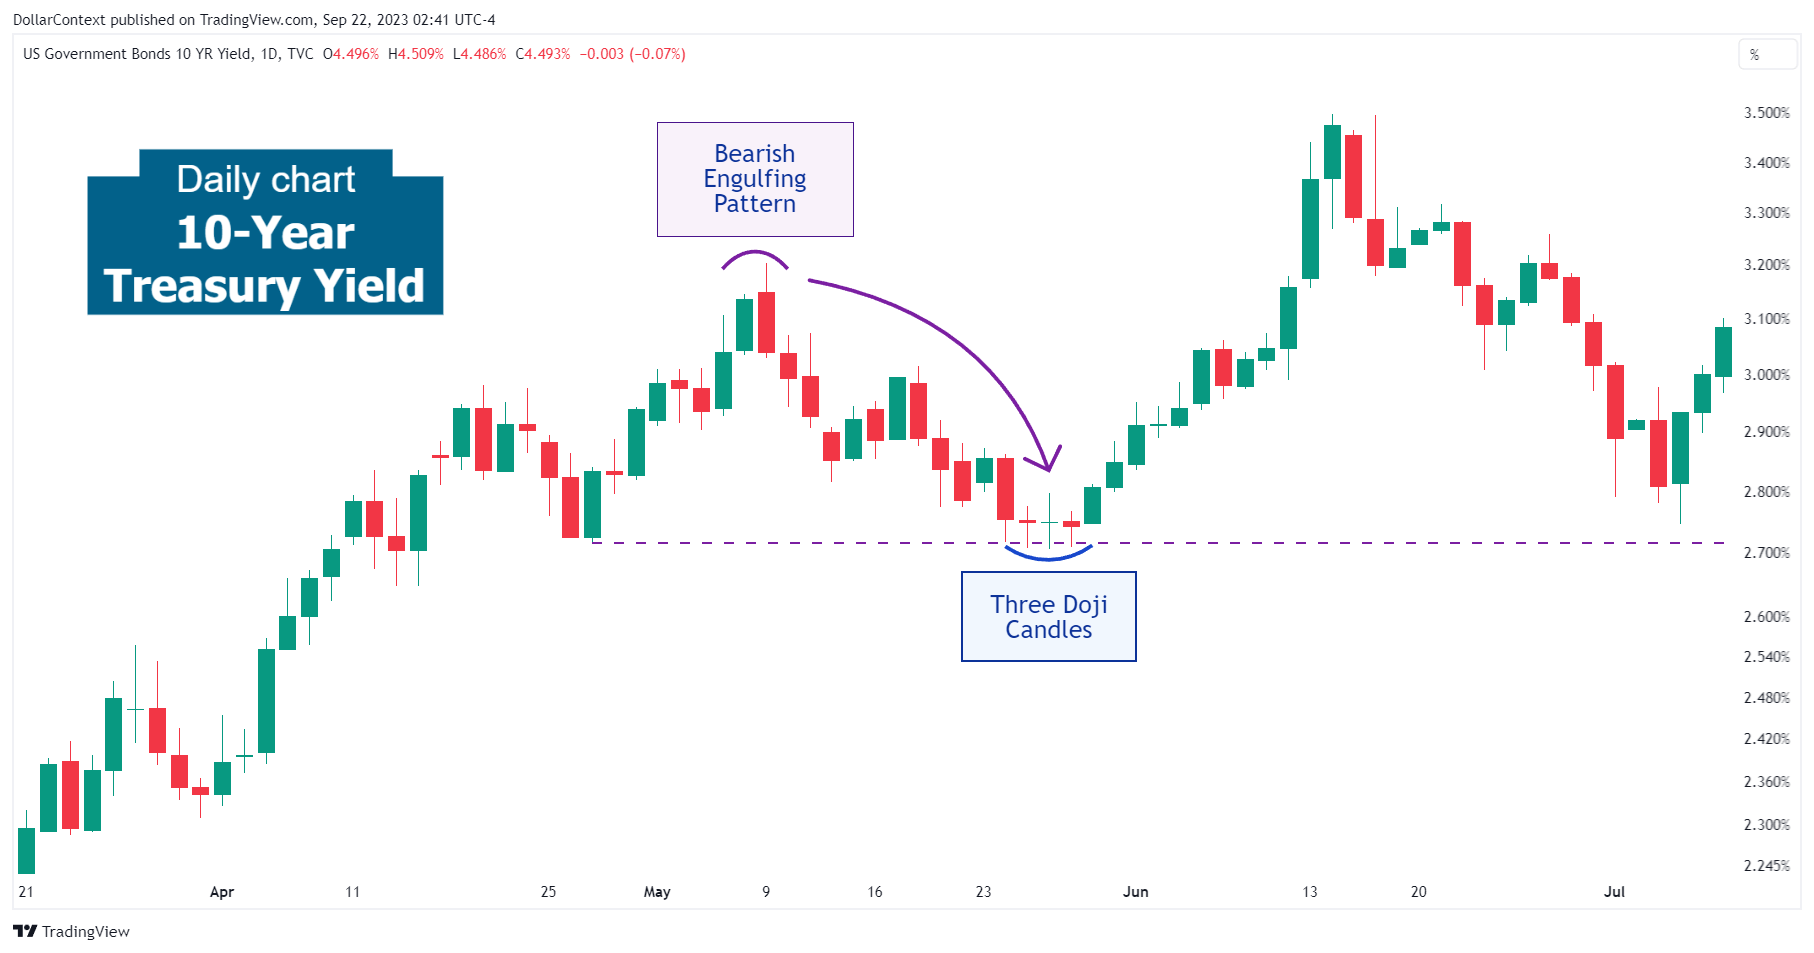
As illustrated in the chart above, following the engulfing pattern, the market began to decline immediately, without any further delays or retesting of the pattern's highs.
3. Resolution
Following the engulfing pattern, a short-term reversal ensued. The retracement concluded with a sequence of three doji sessions at a minor support level set by the recent lows.
4. Conclusion
4.1 Pattern Development
Following the appearance of the bearish engulfing pattern, there was a high likelihood of either a sideways trading range or a minor retracement.
4.2 Outcome Analysis
The short-term decline indeed occurred, and ended with three doji candlesticks near the recent lows.


