
Case Study 0003: Hanging Man After Steep Advance (Natural Gas)
In this article, we will discuss the performance of a highly volatile market in which specific candlestick patterns effectively signaled price tops and bottoms.


In this article, we will discuss the performance of a highly volatile market in which specific candlestick patterns effectively signaled a sequence of price tops and bottoms.
Data Sheet
- Reference: CS0003
- Security: Natural Gas
- Timeframe: Hourly Chart (September 19, 2023)
- Patterns:
- Hanging Man
- Doji
- Hammer
- High-Wave
- Inverted Hammer
1. Signal Formation
The last stage of an uptrend in natural gas gained momentum by displaying four consecutive tall green candles. The accelerated move culminated in a hanging man pattern.
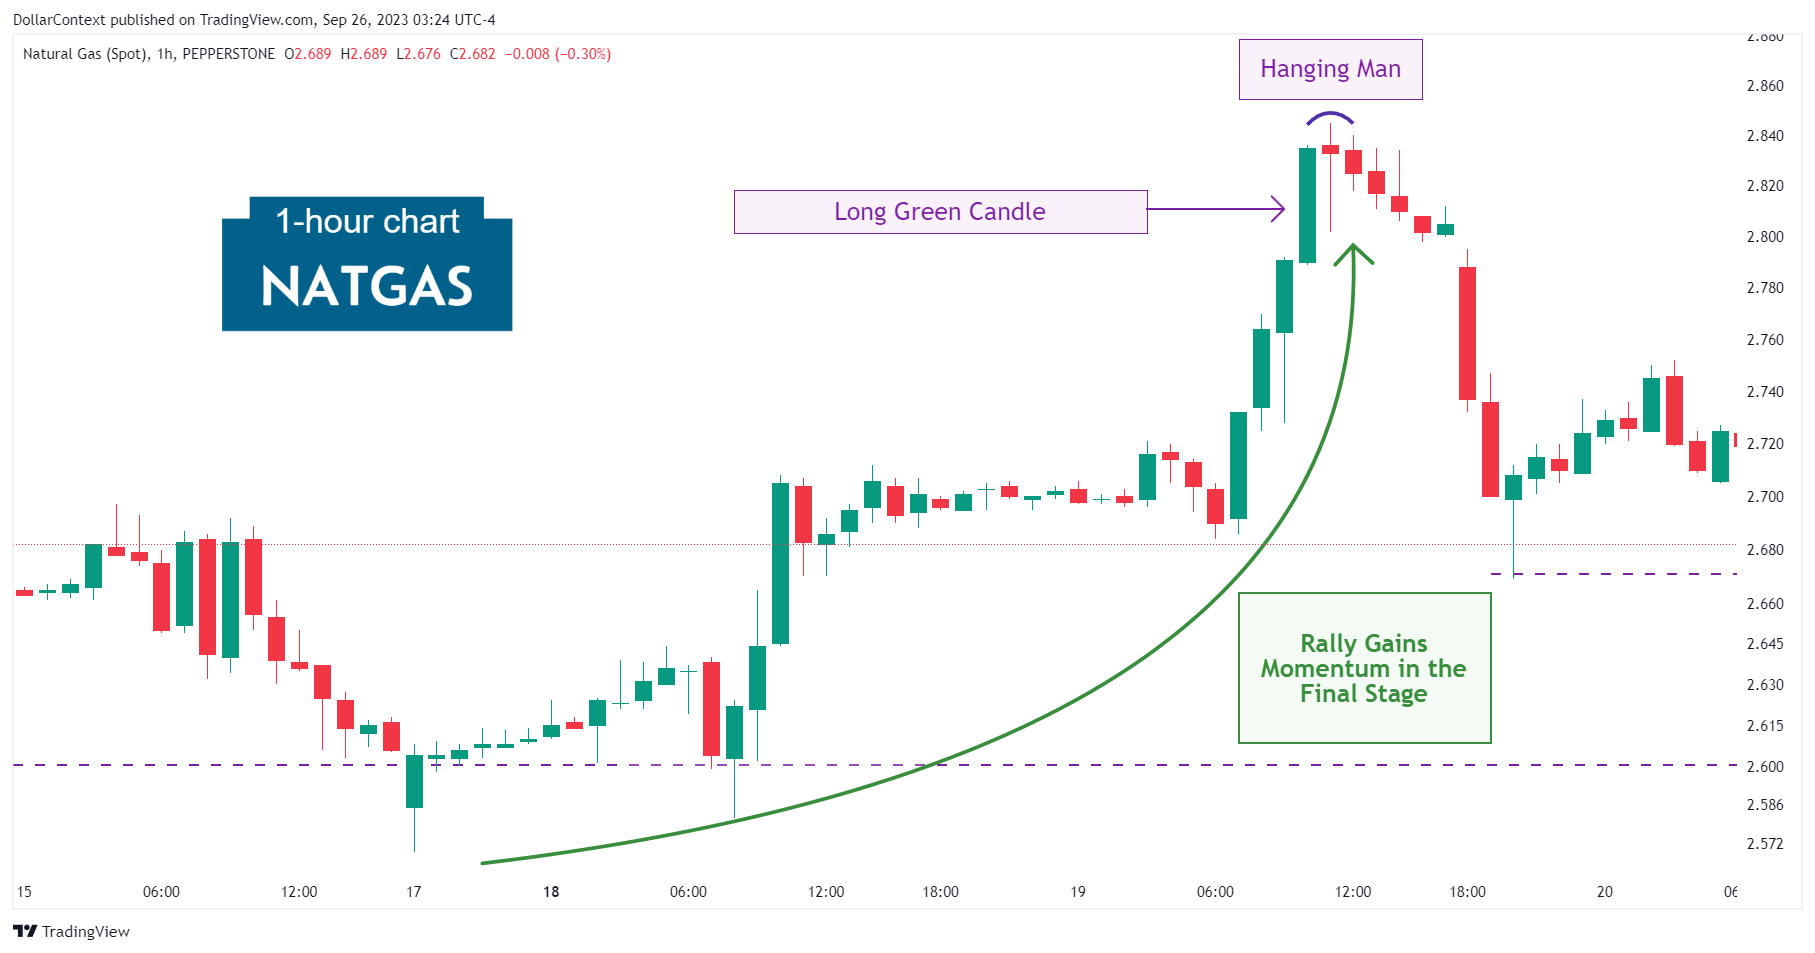
The context in which a hanging man emerges is as important as the pattern itself. These contextual elements for this chart can be described as follows:
- The previous upward trend is evident.
- The surge in the final phase of the rally suggests potential market euphoria.
- The pronounced lower shadow of the hanging man is proportional to the preceding candles' size.
- The small body of the hanging man can also be interpreted as a variation of a doji. Following a long green candle, this bolsters its reliability as a reversal indicator.
2. Early Market Transition
After an initially slow decline, natural gas rapidly confirmed the reversal. The market basically accelerated to the downside without any further delays or retesting of the hanging man's highs.
3. Resolution
Following the market decline, a hammer signaled a potential trend change. Remember, candlestick patterns don't always indicate a complete market reversal. They might suggest a possible market transition from bearish to range-bound (or from bullish to range-bound).
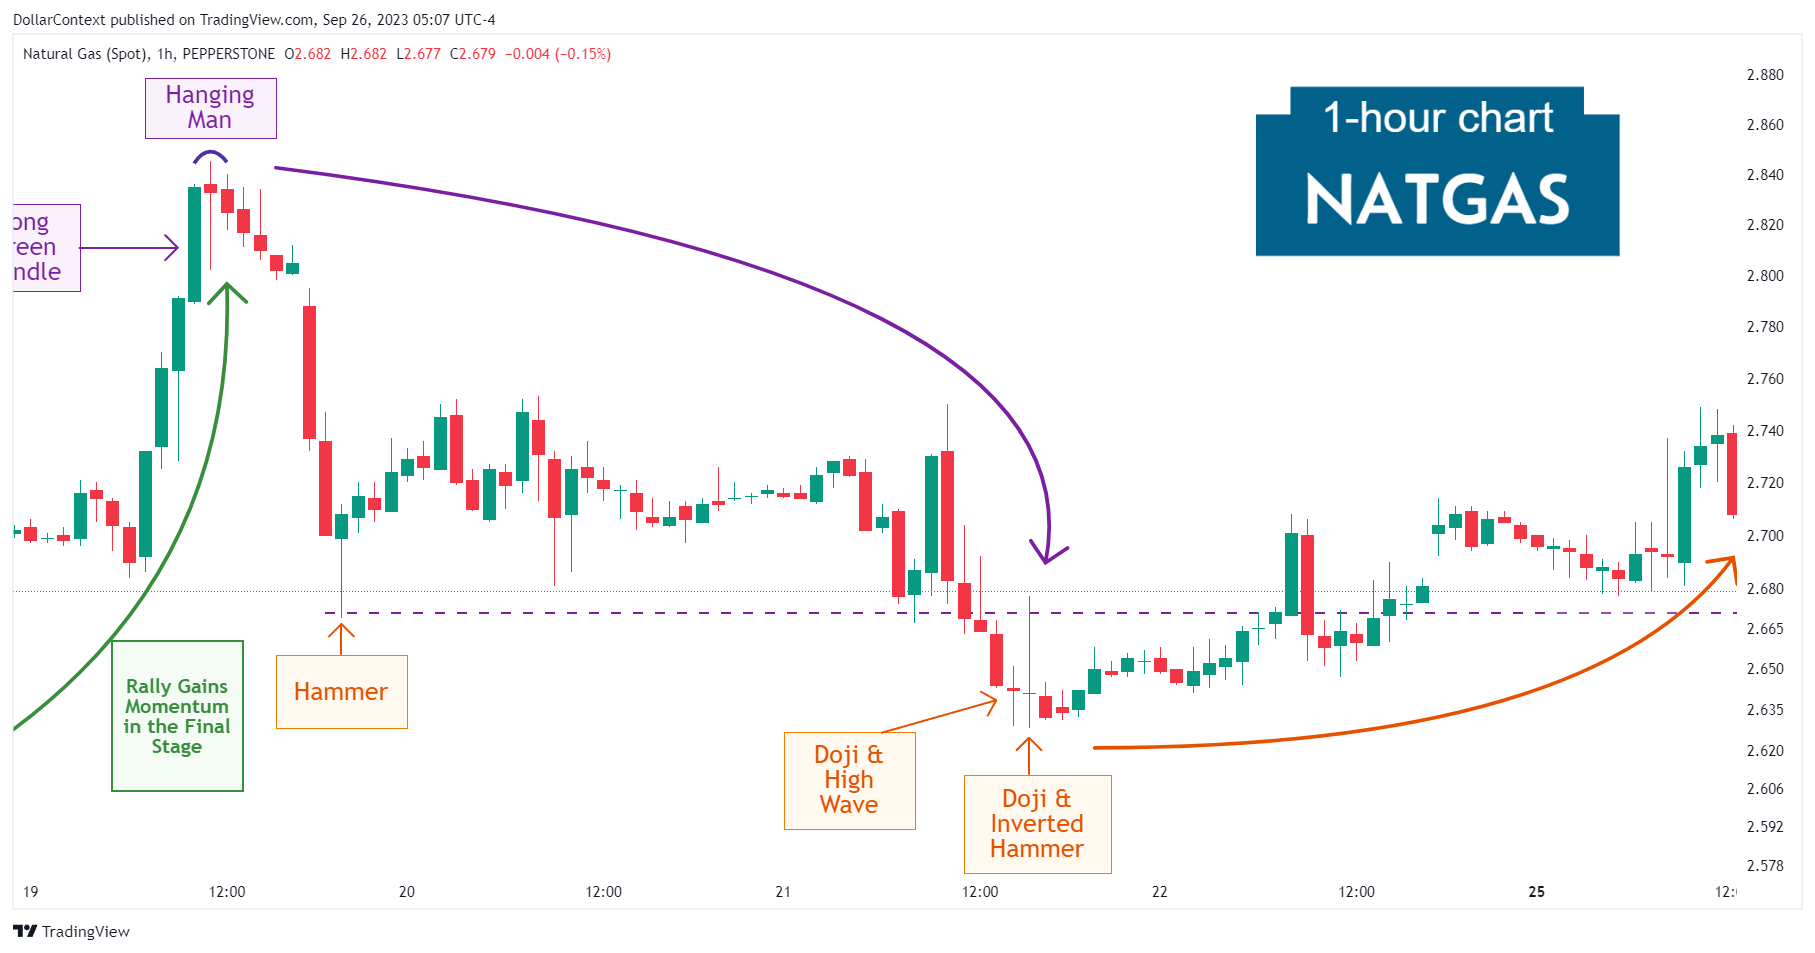
After the extended sideways movement, the initial range breakout loses momentum upon the appearance of two doji candles. These can also be viewed as a high-wave and a variation of an inverted hammer, respectively.
4. Conclusion
4.1 Pattern Development
Following the appearance of the hanging man after such a steep market ascent, the probability of a market reversal was high.
4.2 Outcome Analysis
After a steep decline, the new bearish market experienced a series of bullish patterns that initially stalled, and eventually reversed, the prior trend.


