
Case Study 0004: Hammer After Extended Downtrend (Gold)
In this article, we will discuss the performance of the gold market after the appearance of a hammer pattern.


Data Sheet
- Reference: CS0004
- Security: Gold Spot
- Timeframe: Hourly Chart (September 28, 2023)
- Patterns:
- Hammer
1. Signal Formation
After an extremely oversold market, gold prices displayed a distinct hammer pattern. This hammer session was preceded by a large red candle.
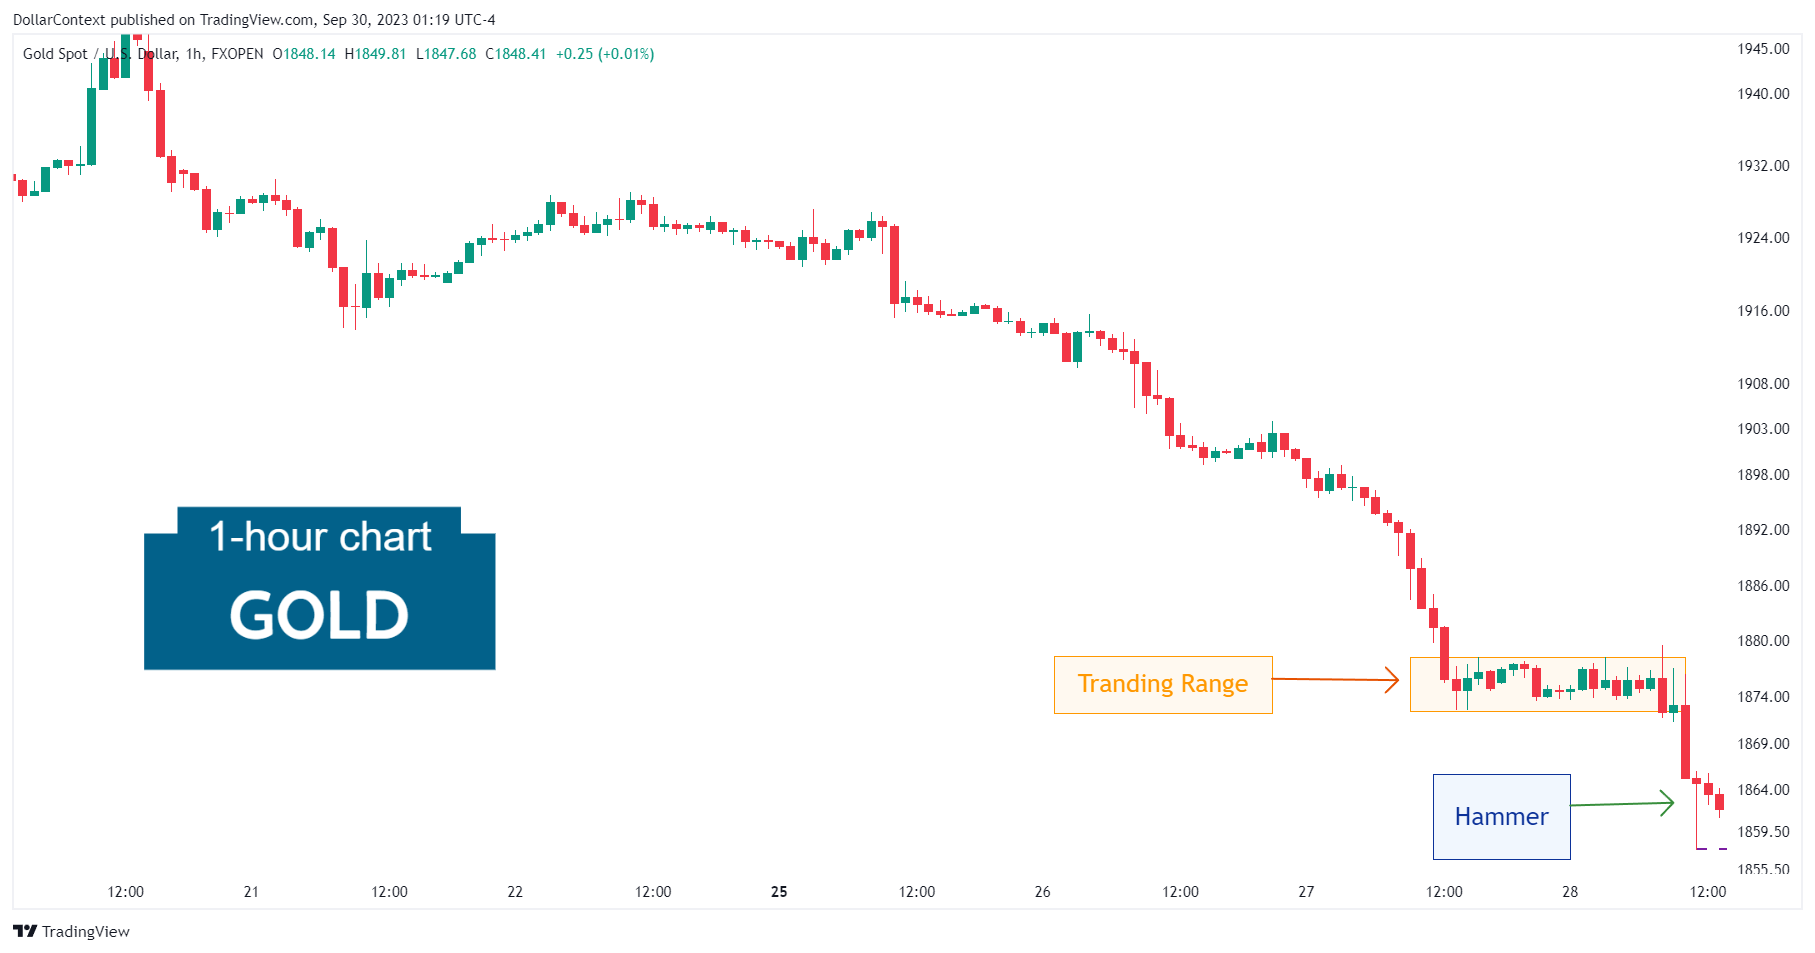
It's worth mentioning that the hammer session emerged after a breakout from an extended trading range. This suggests that while the market was oversold in the long term, it was not so in the shorter-term.
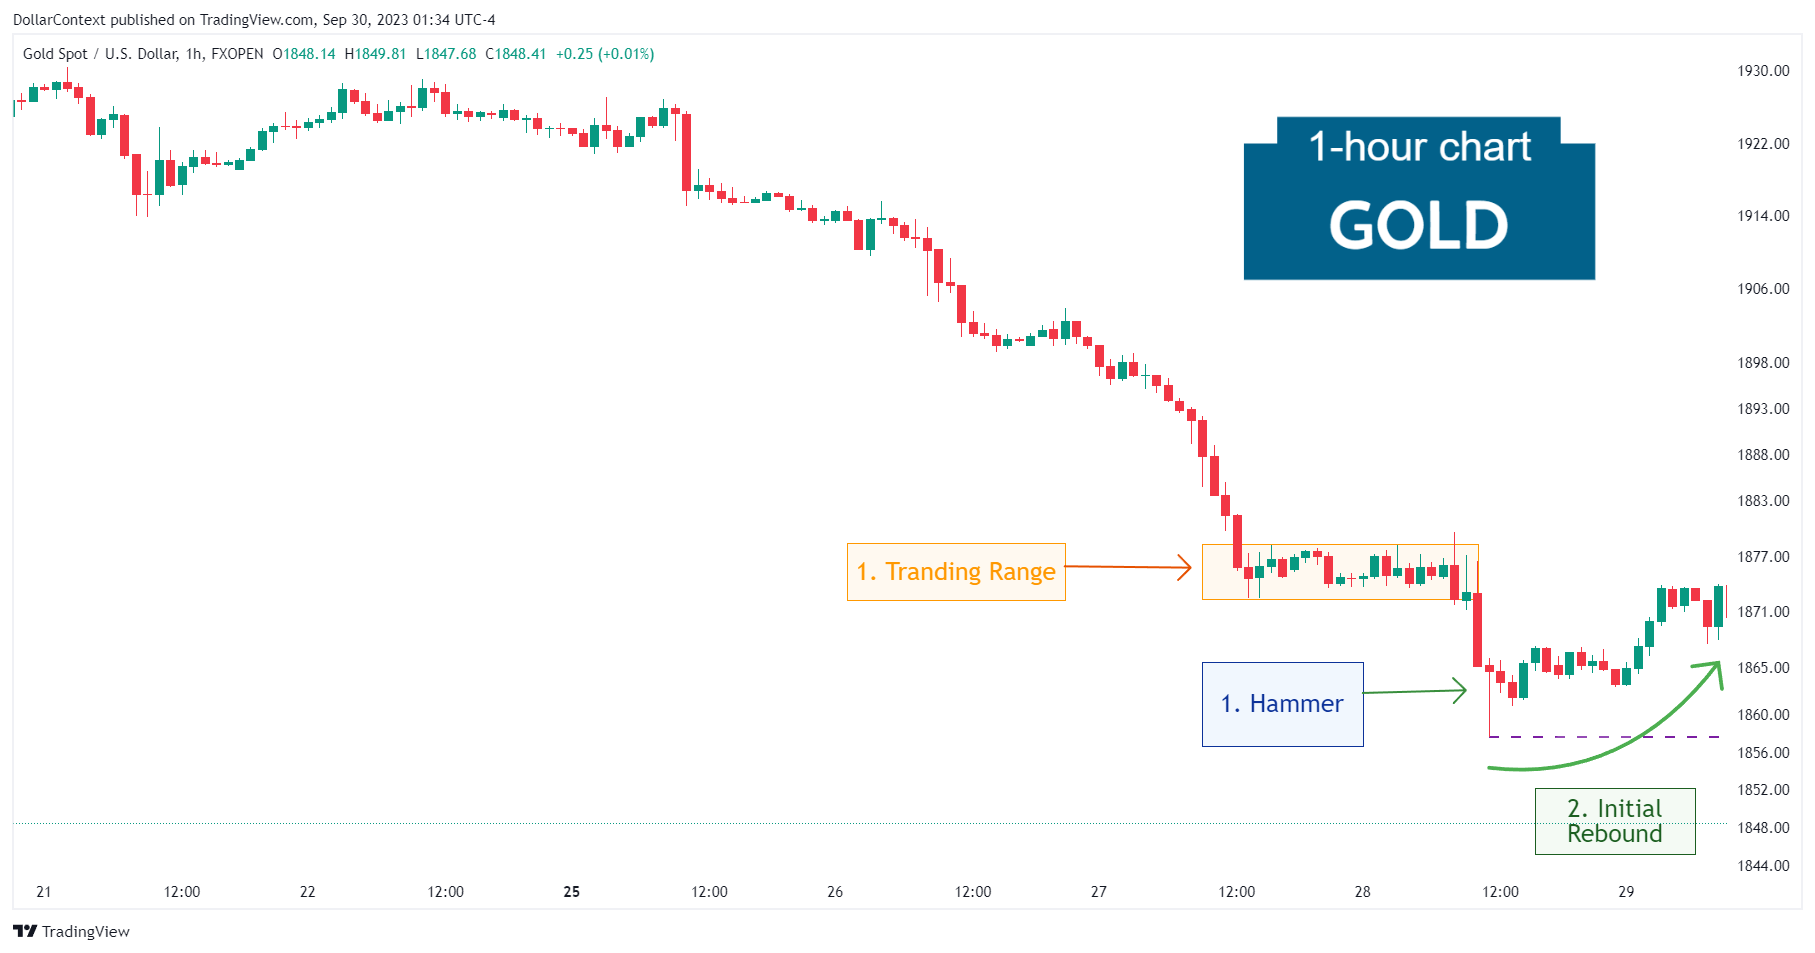
2. Early Market Transition
After the appearance of the hammer, the decline in gold prices promptly halted, and within 11 sessions, the market began to attempt a rally.
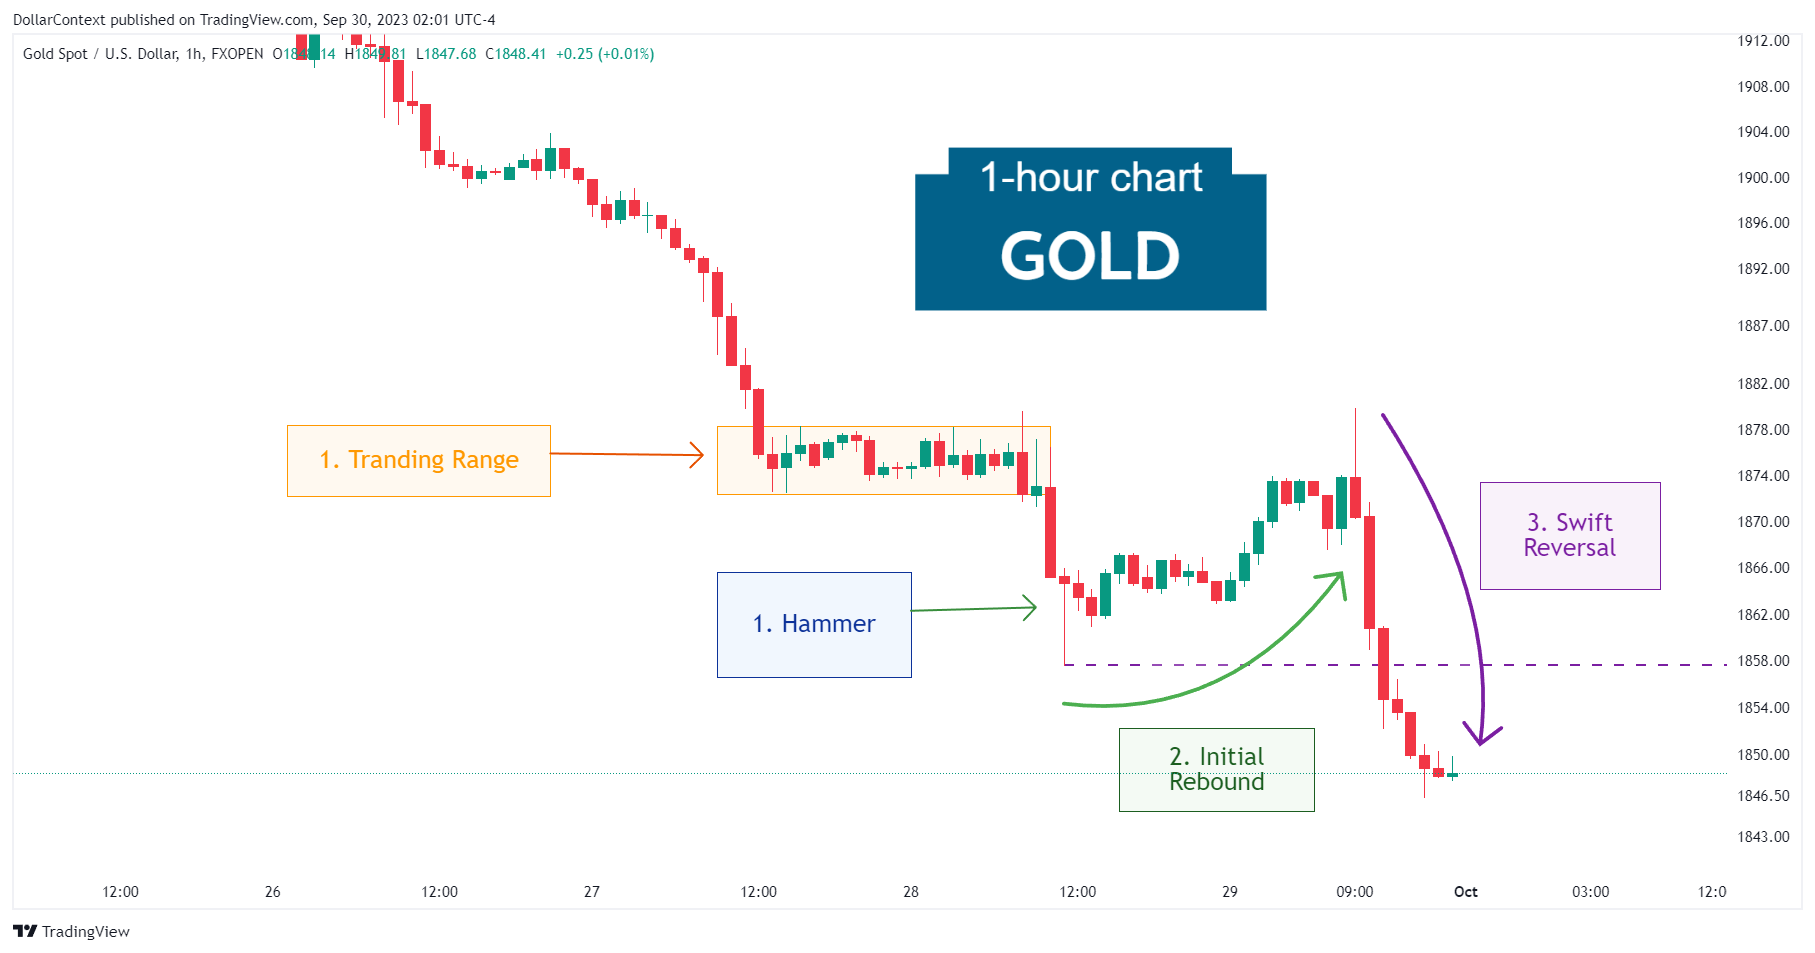
3. Resolution
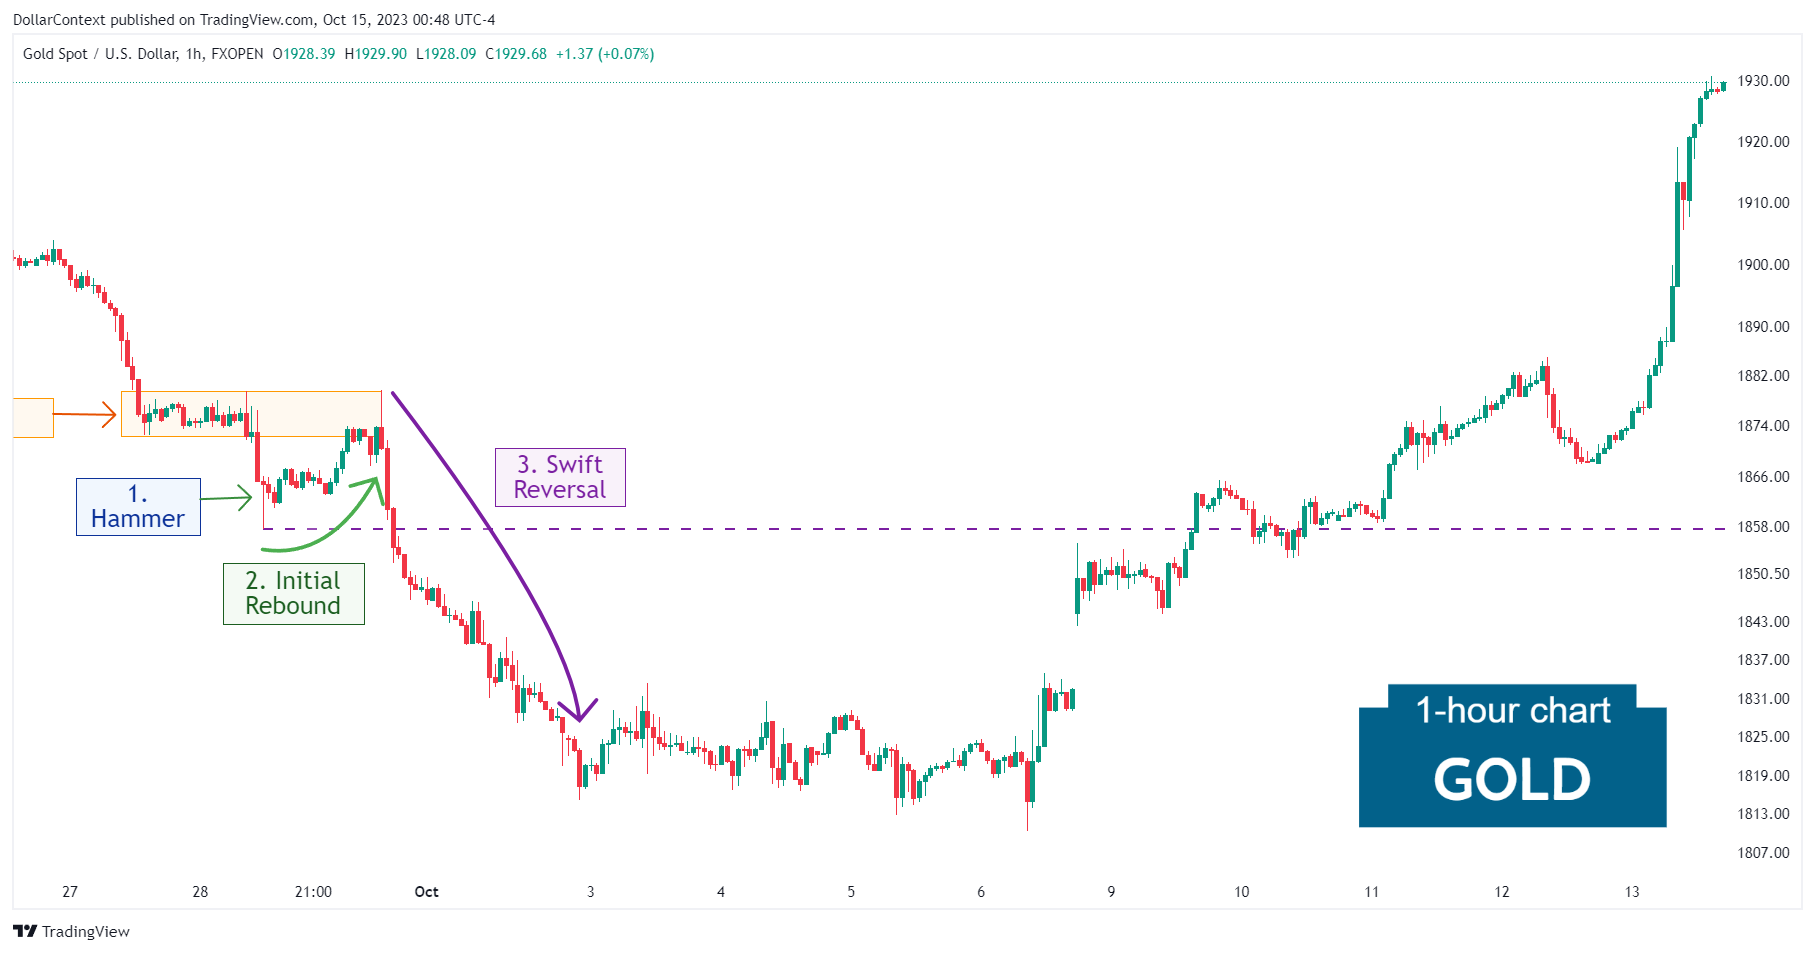
After a short-lived move to the upside, the market quickly reversed and breached the support level set by the lows of the hammer.
Eventually, the downturn reached the 1810 mark before initiating a new uptrend.
4. Conclusion
4.1 Pattern Development
Despite emerging in the context of a long-term oversold market, the hammer pattern was preceded by an extended range-bound. The preceding sideways move could have diminished the importance of the hammer as a reversal signal.
4.2 Outcome Analysis
The short-lived rally after the hammer reflects how unpredictable markets can be, especially after the appearance of a candlestick pattern.
Additionally, this example underscores that when assessing the significance of a candlestick pattern, one should consider not only the duration of the preceding trend but also the immediate sentiment, in terms of fear and greed. In this case, while the gold market was experiencing a mature downtrend in the long term, it wasn't the case in the immediate term. The extended range-bound before the pattern suggests this lack of fear or panic.


