
Case Study 0005: Evening Star Signals the End of a Market Correction (S&P 500)
In this article, we will discuss the performance of the S&P 500 after the appearance of an evening star.

Data Sheet
- Reference: CS0005
- Security: S&P 500
- Timeframe: Hourly Chart (September 29, 2023)
- Patterns:
- Evening Star
1. Signal Formation
Towards the end of September 2023, the S&P 500 embarked on a correction as part of an overarching downtrend. An evening star emerged on September 29, indicating that the recovery could be in danger.
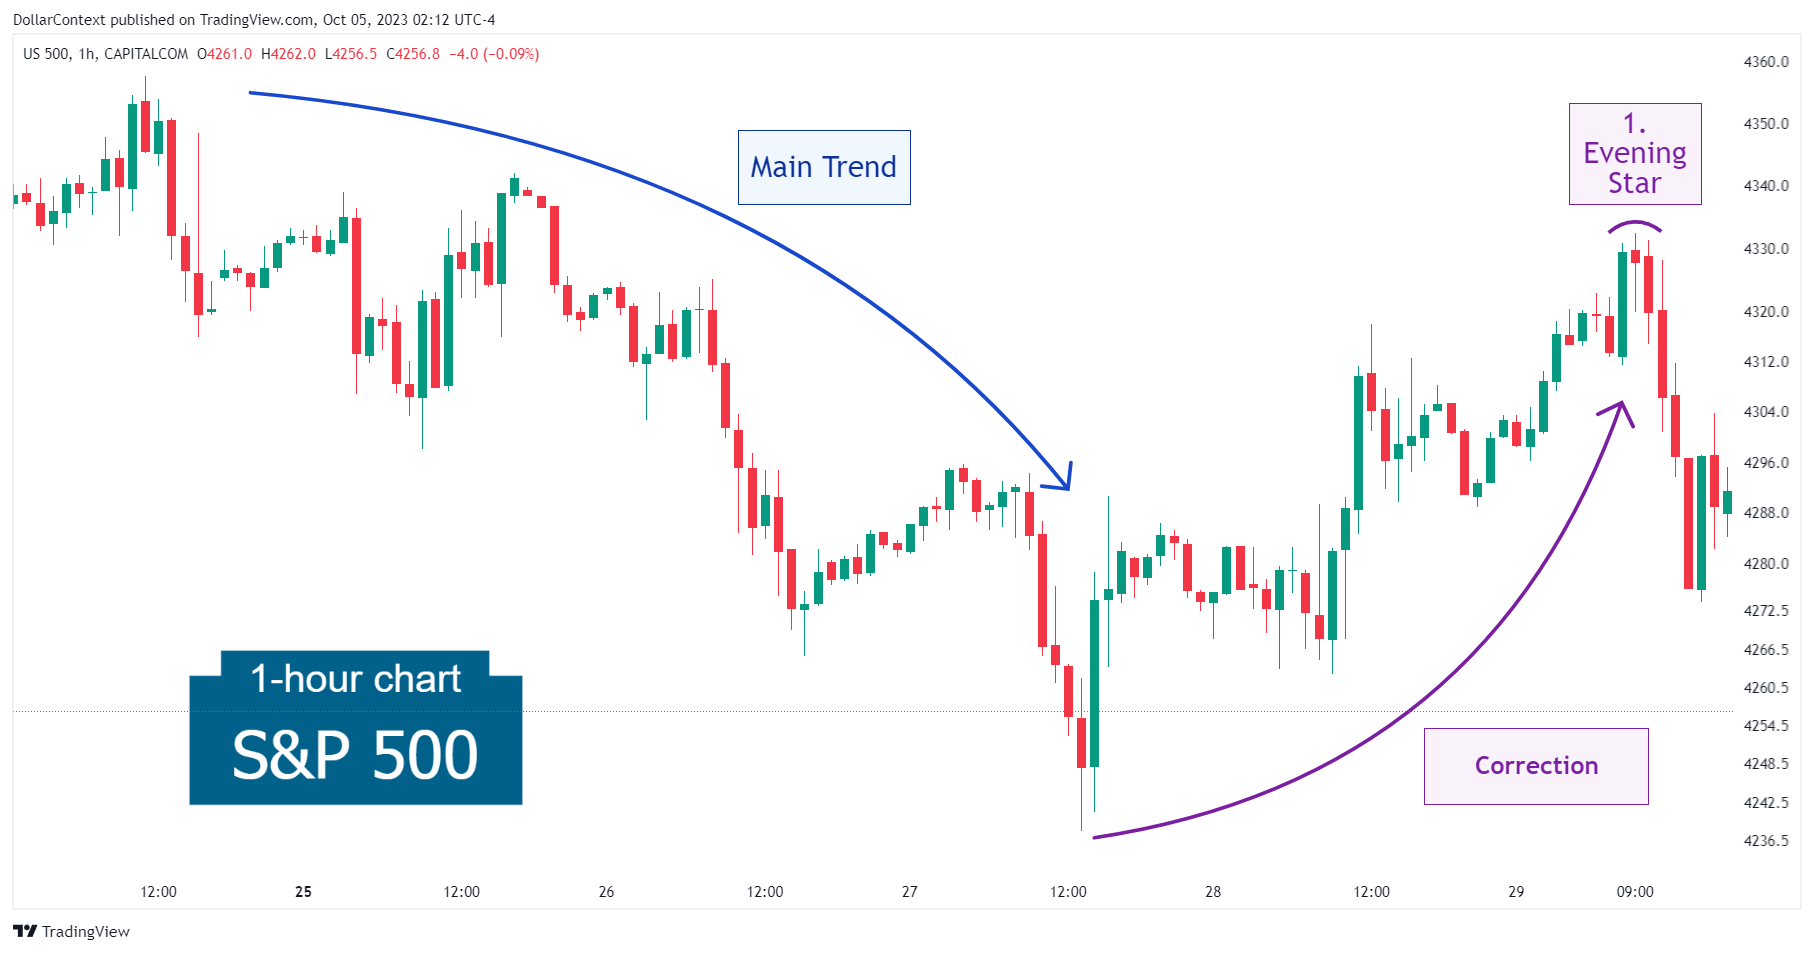
Remember, when working with intra-session timeframes, there should be more flexibility in using and evaluating candlestick patterns. In this case, although it wasn't an ideal evening star pattern (where the three bodies should not touch), the fact that the third candle penetrated well into the first real body reinforced the likelihood of a reversal.
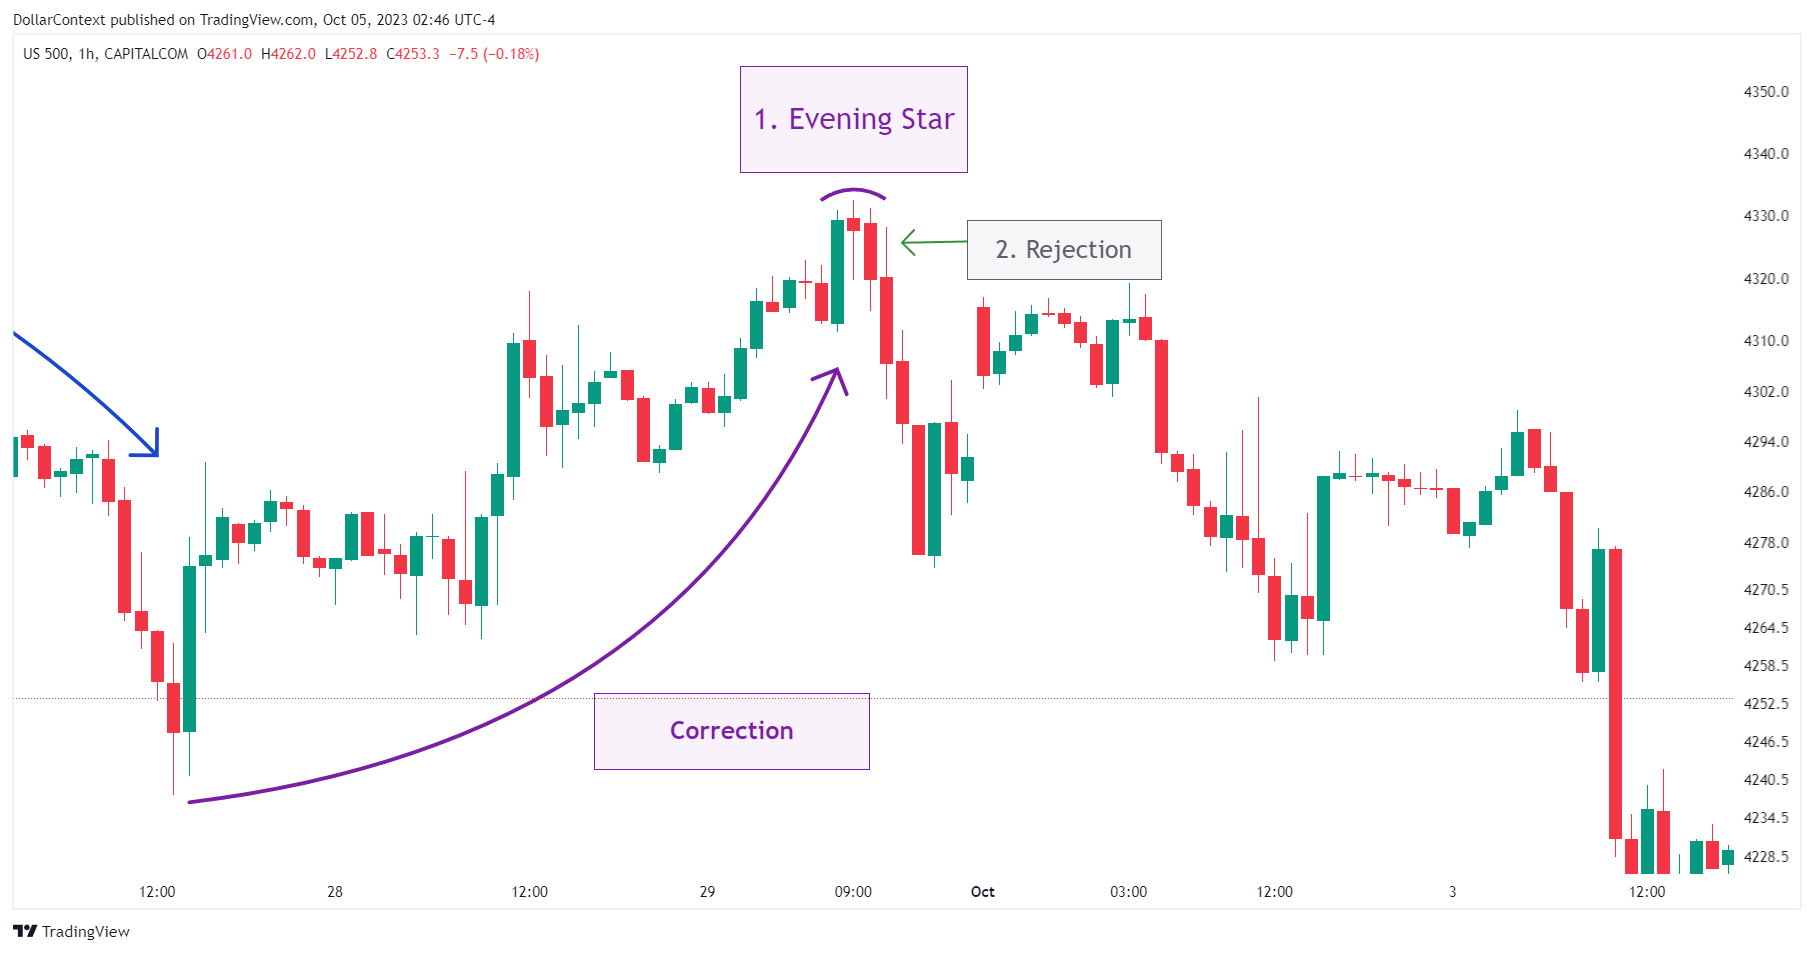
2. Early Market Transition
In the session following the evening star, the S&P 500 attempted to retest the pattern's highs, only to be quickly rebuffed. Thus, we can say that after the reversal pattern, the market started going down almost immediately.
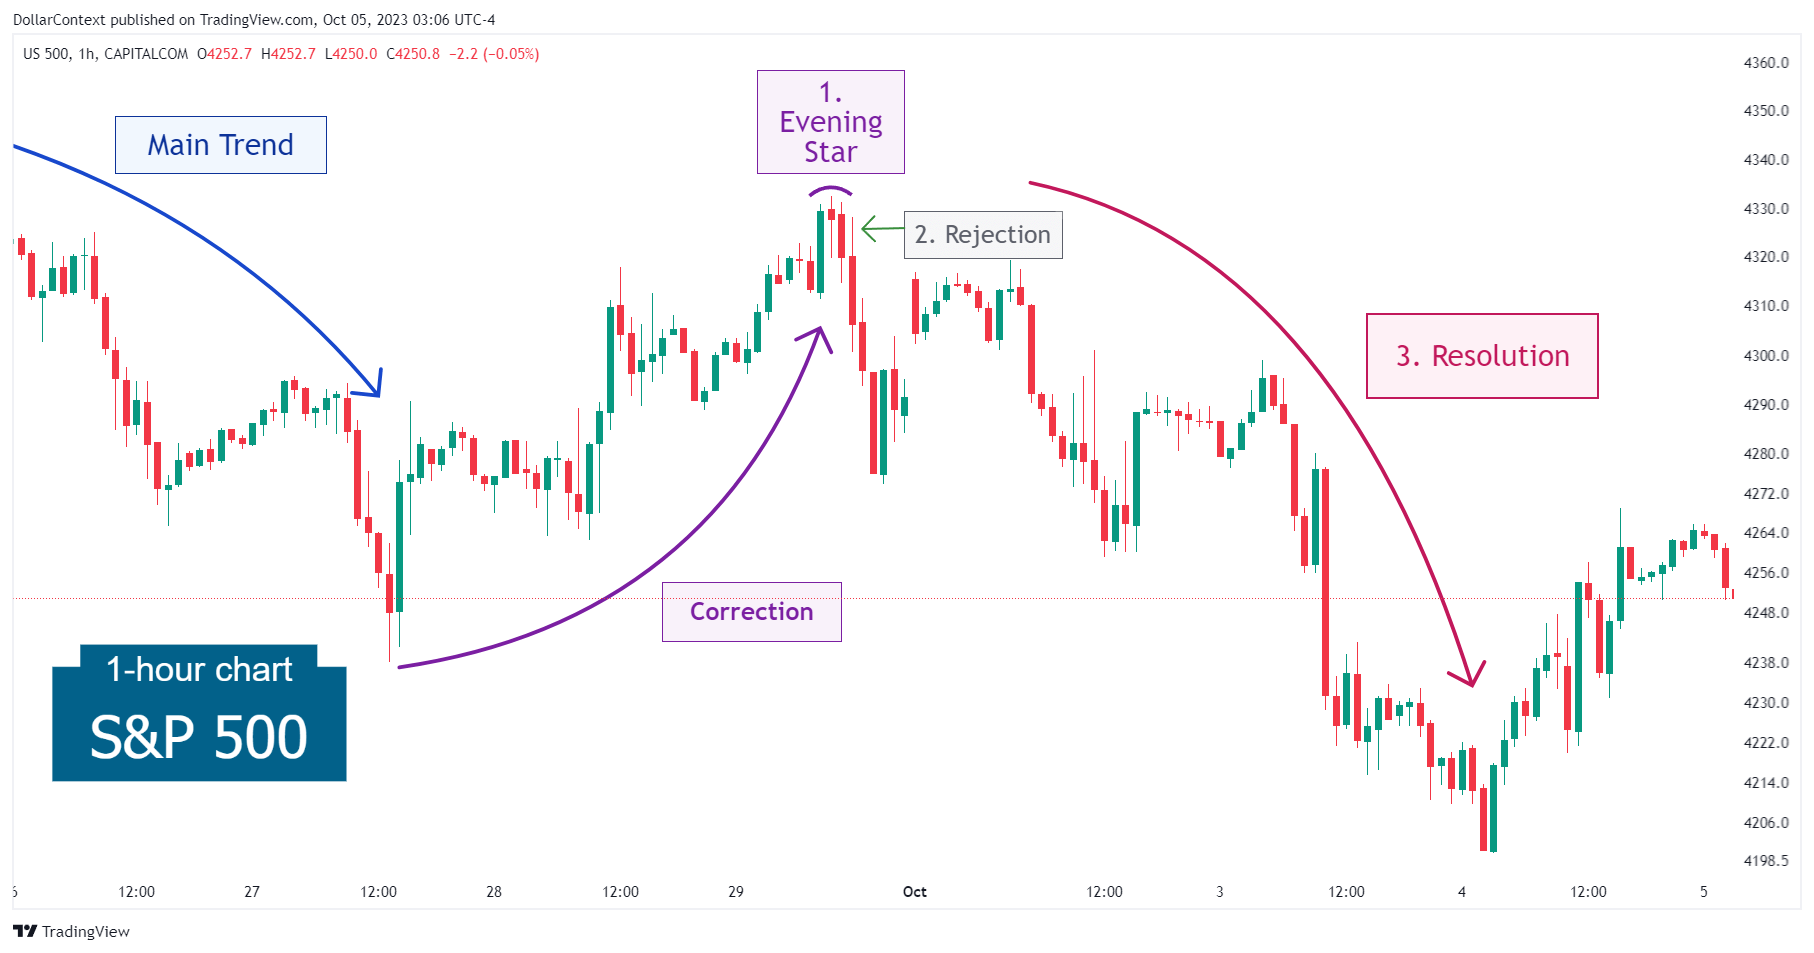
3. Resolution
The S&P 500 confirmed the reversal by experiencing a substantial decline. The downturn effectively broke past the previous lows, thereby affirming the ongoing macro-level downtrend.

4. Conclusion
4.1 Pattern Development
Considering the limitations of an hourly timeframe analysis in candlestick charting, the evening star formation after a pronounced market ascent was clear.
4.2 Outcome Analysis
This example illustrates that a candlestick pattern can be used not only to pinpoint market reversals but also to determine the possible end of a market correction. This scenario unfolded in early October, as the market resumed its prior trend after the emergence of the evening star.


