
Case Study 0006: Doji After a Long White Candlestick (WTI)
In this article, we will examine the performance of the WTI market after the emergence of a doji pattern.

Data Sheet
- Reference: CS0006
- Security: WTI Crude Oil
- Timeframe: Hourly Chart (September 27, 2023)
- Patterns:
- Doji
- Long Upper Shadow
- Spinning Top
1. Signal Formation
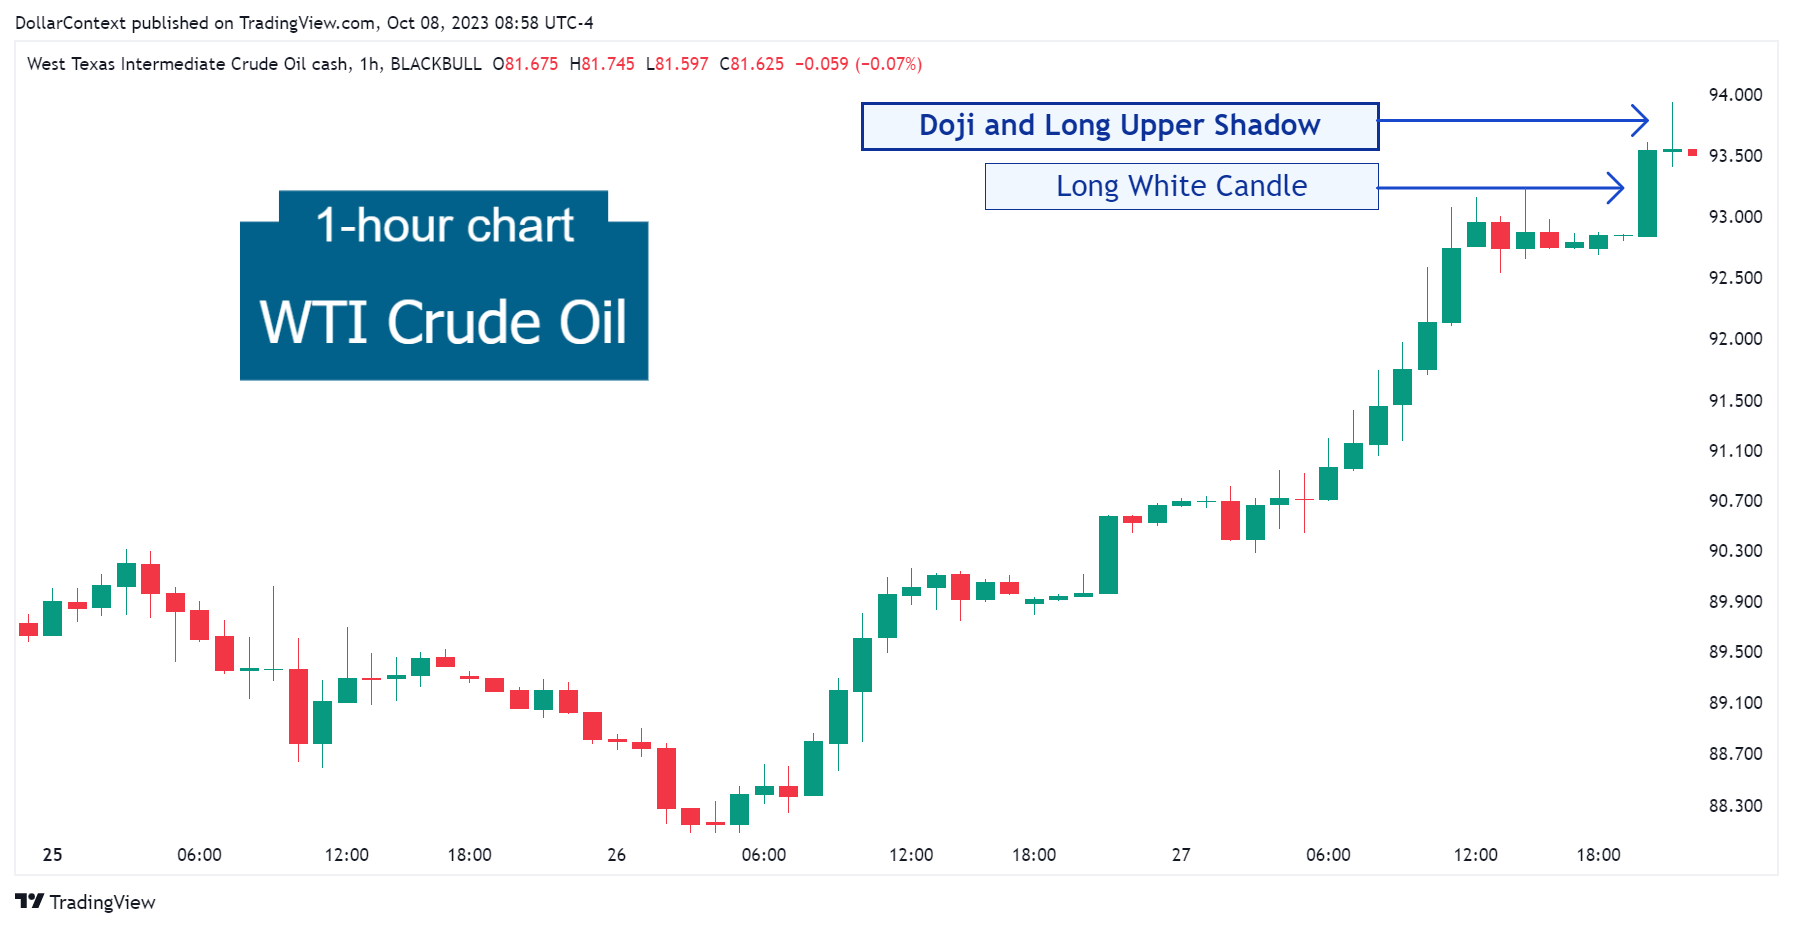
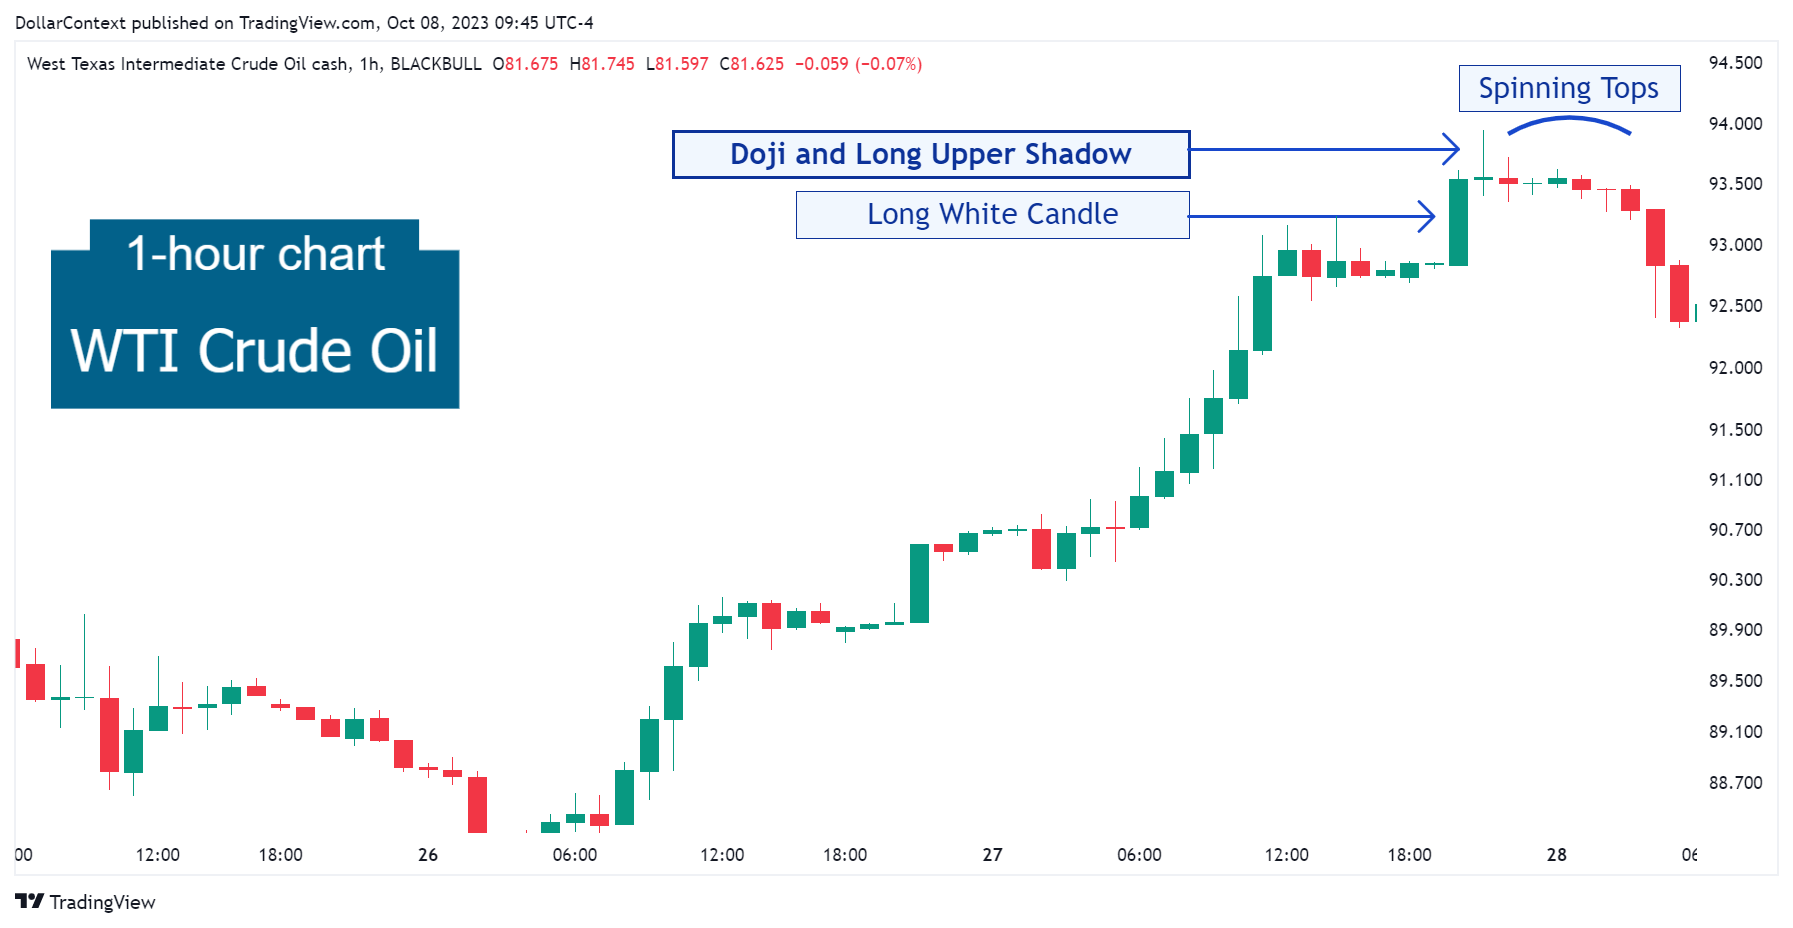
On September 27, 2023, following a clear ascending trend, the WTI market displayed a tall white candle, underscoring the aggressiveness of the bulls. The next week, however, a doji candlestick echoed a disparity about the state of the market. This could be interpreted as the bulls struggling to maintain the upward momentum.
The elongated upper wick of the doji session suggests that this candlestick could also be viewed as a long upper shadow candle.
2. Early Market Transition
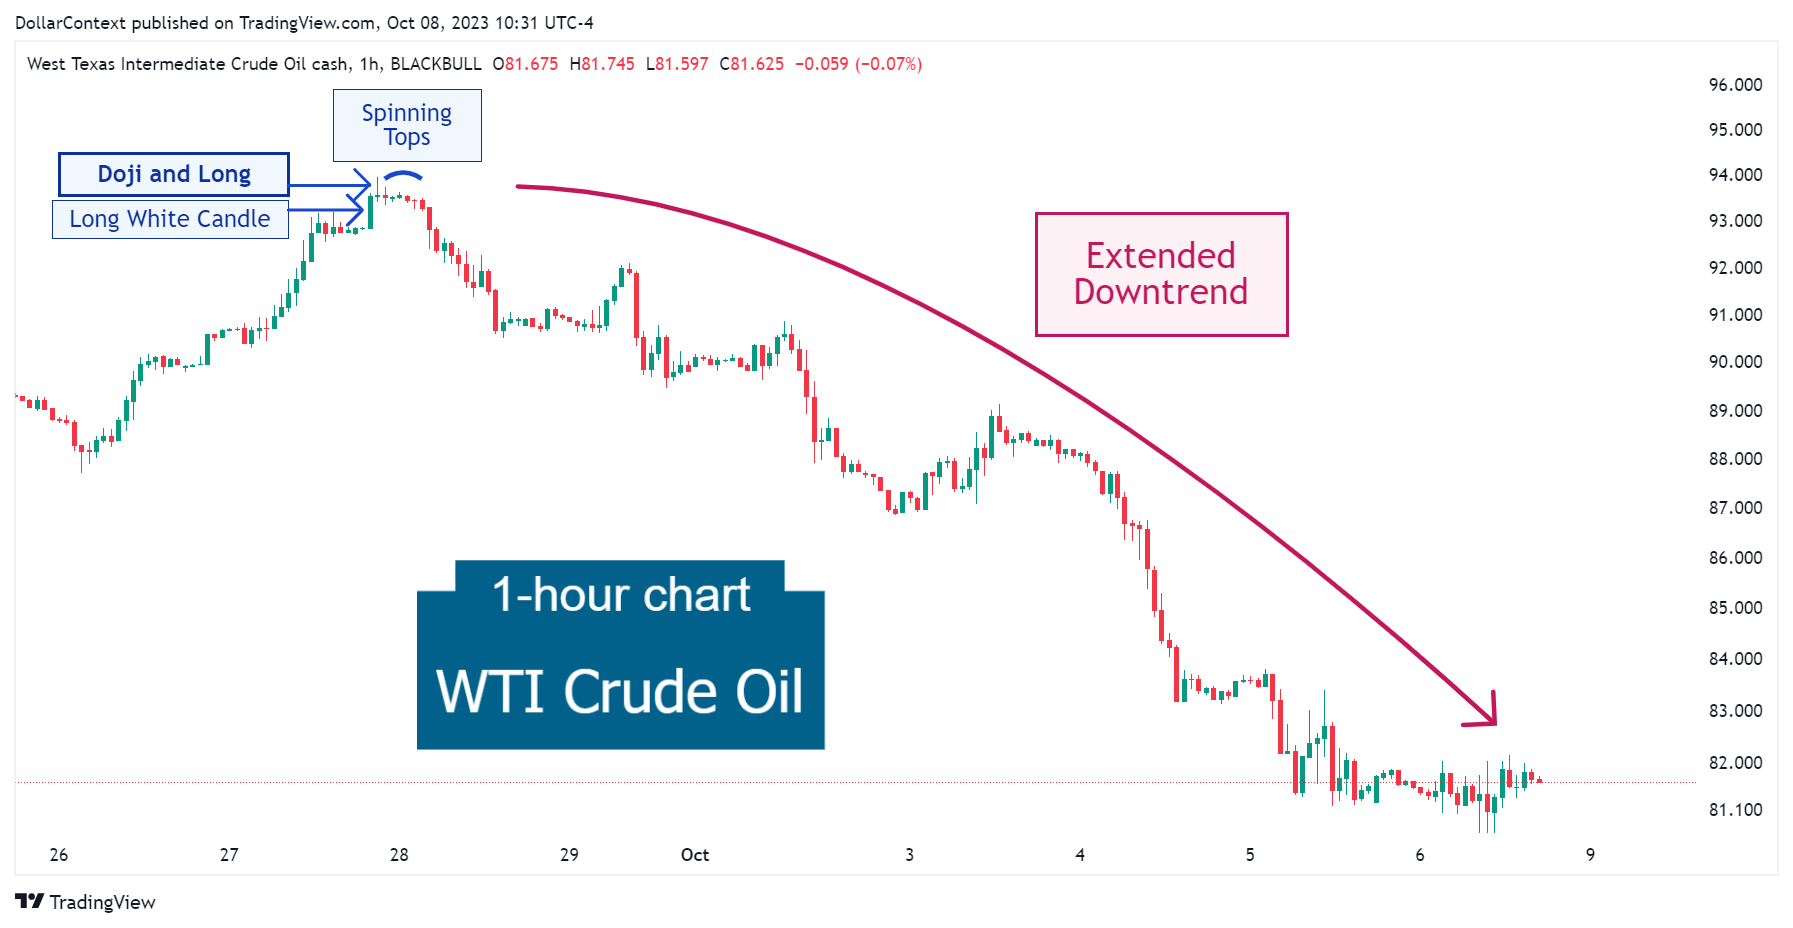
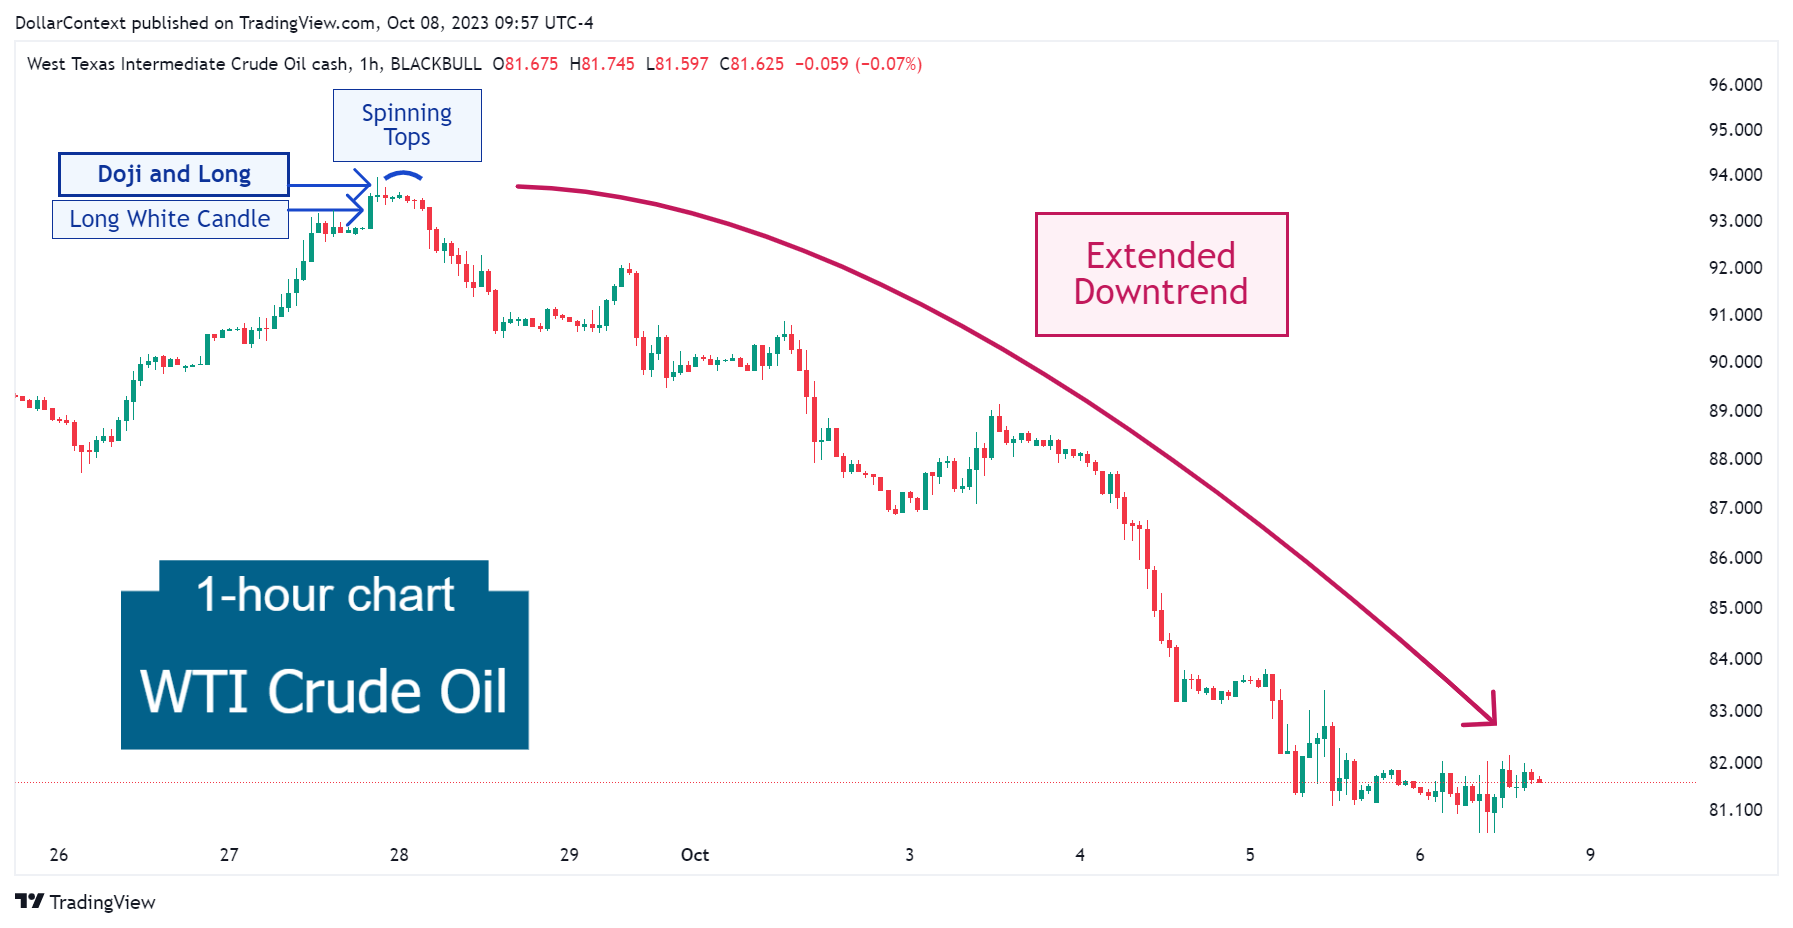
A series of spinning tops after the doji session reinforced the probability of a market reversal. This scenario was confirmed by the long red (or black) candles on September 28.
3. Resolution
The market transitioned into an extended downward trend that lasted for over a week.
4. Conclusion
4.1 Pattern Development
Emerging after a prolonged bullish market, a doji preceded by a long white body successfully marked the end of the uptrend and the beginning of a downward move.
4.2 Outcome Analysis
The significant size of the decline emphasizes the importance of paying close attention to a doji candlestick that follows a tall white candle.


