
Case Study 0007: Tower Top with a Delayed Impact (Natural Gas)
In this article, we will examine the performance of the natural gas market after the emergence of a tower top.


Data Sheet
- Reference: CS0007
- Security: Natural Gas
- Timeframe: Hourly Chart (October 09, 2023)
- Patterns:
- Tower Top
- Shooting Star
- Dark Cloud Cover
- Long Black Real Body
- High-Wave
- Long Upper Shadow
1. Signal Formation
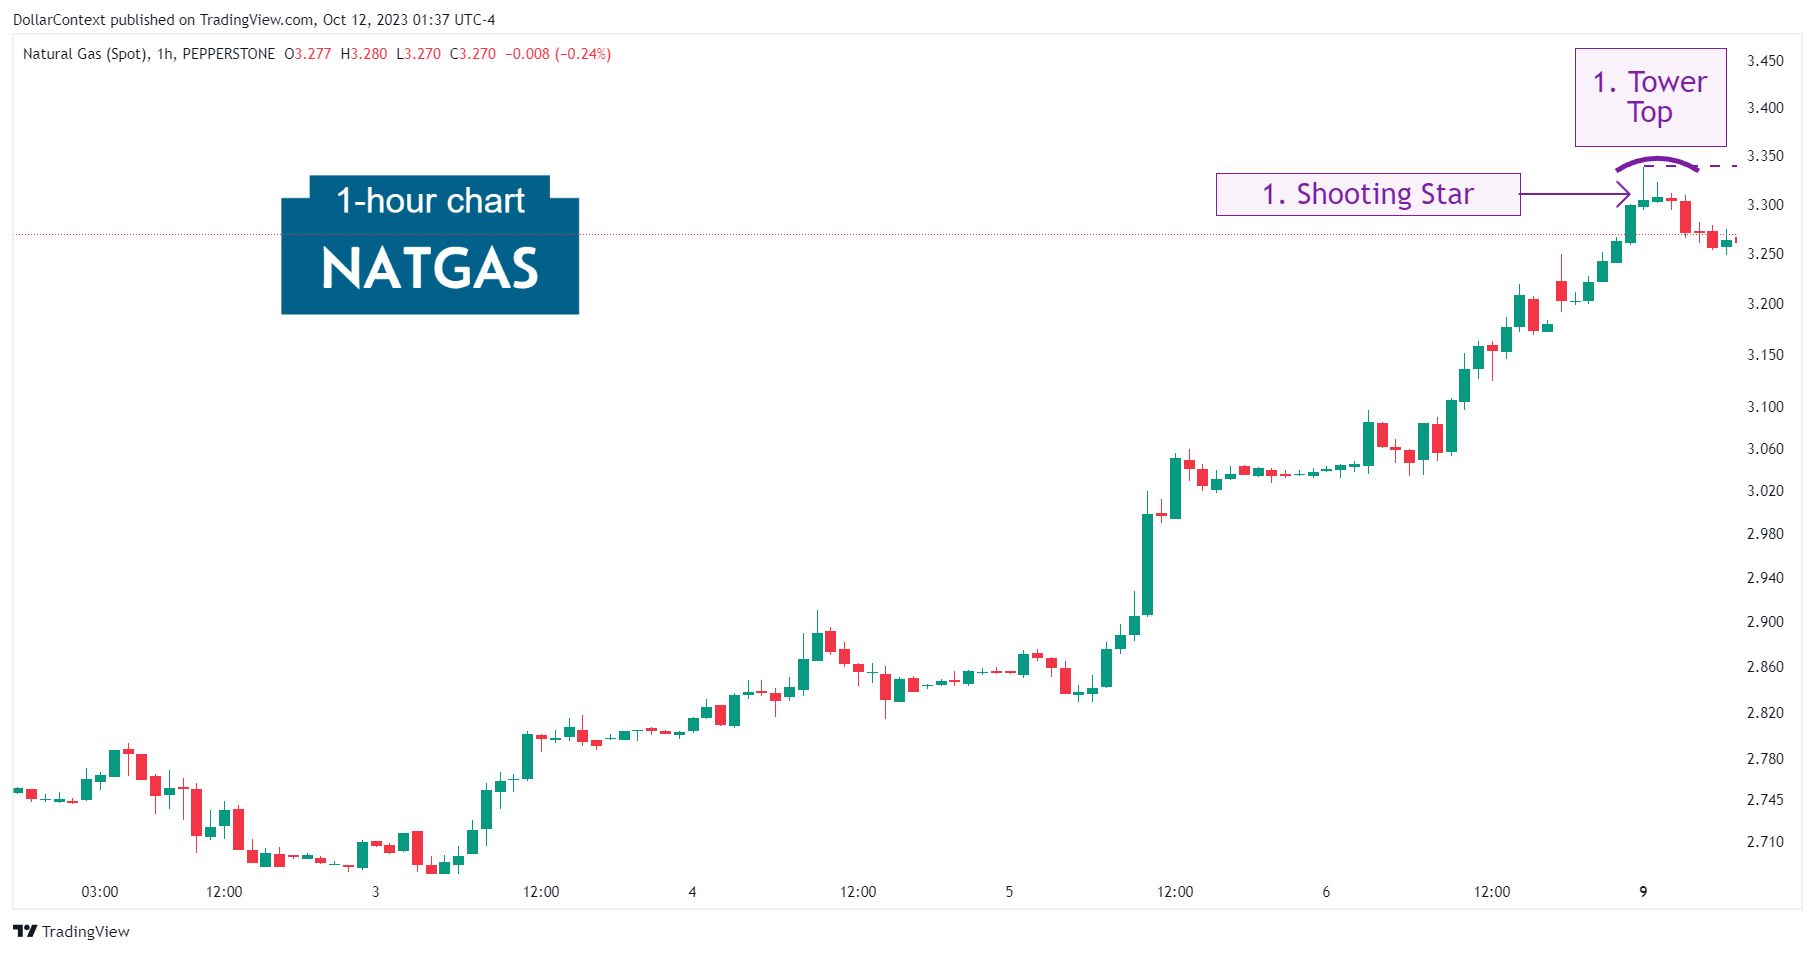
After an extended and robust uptrend (not fully shown in the chart below), the natural gas market displayed a long green candlestick on October 9, 2023. The bullish session was followed by a brief pause that spanned three sessions; ultimately, a prominent red candlestick appeared, establishing a tower top.
Note how the first of the three "lull" session is a shooting star candlestick.
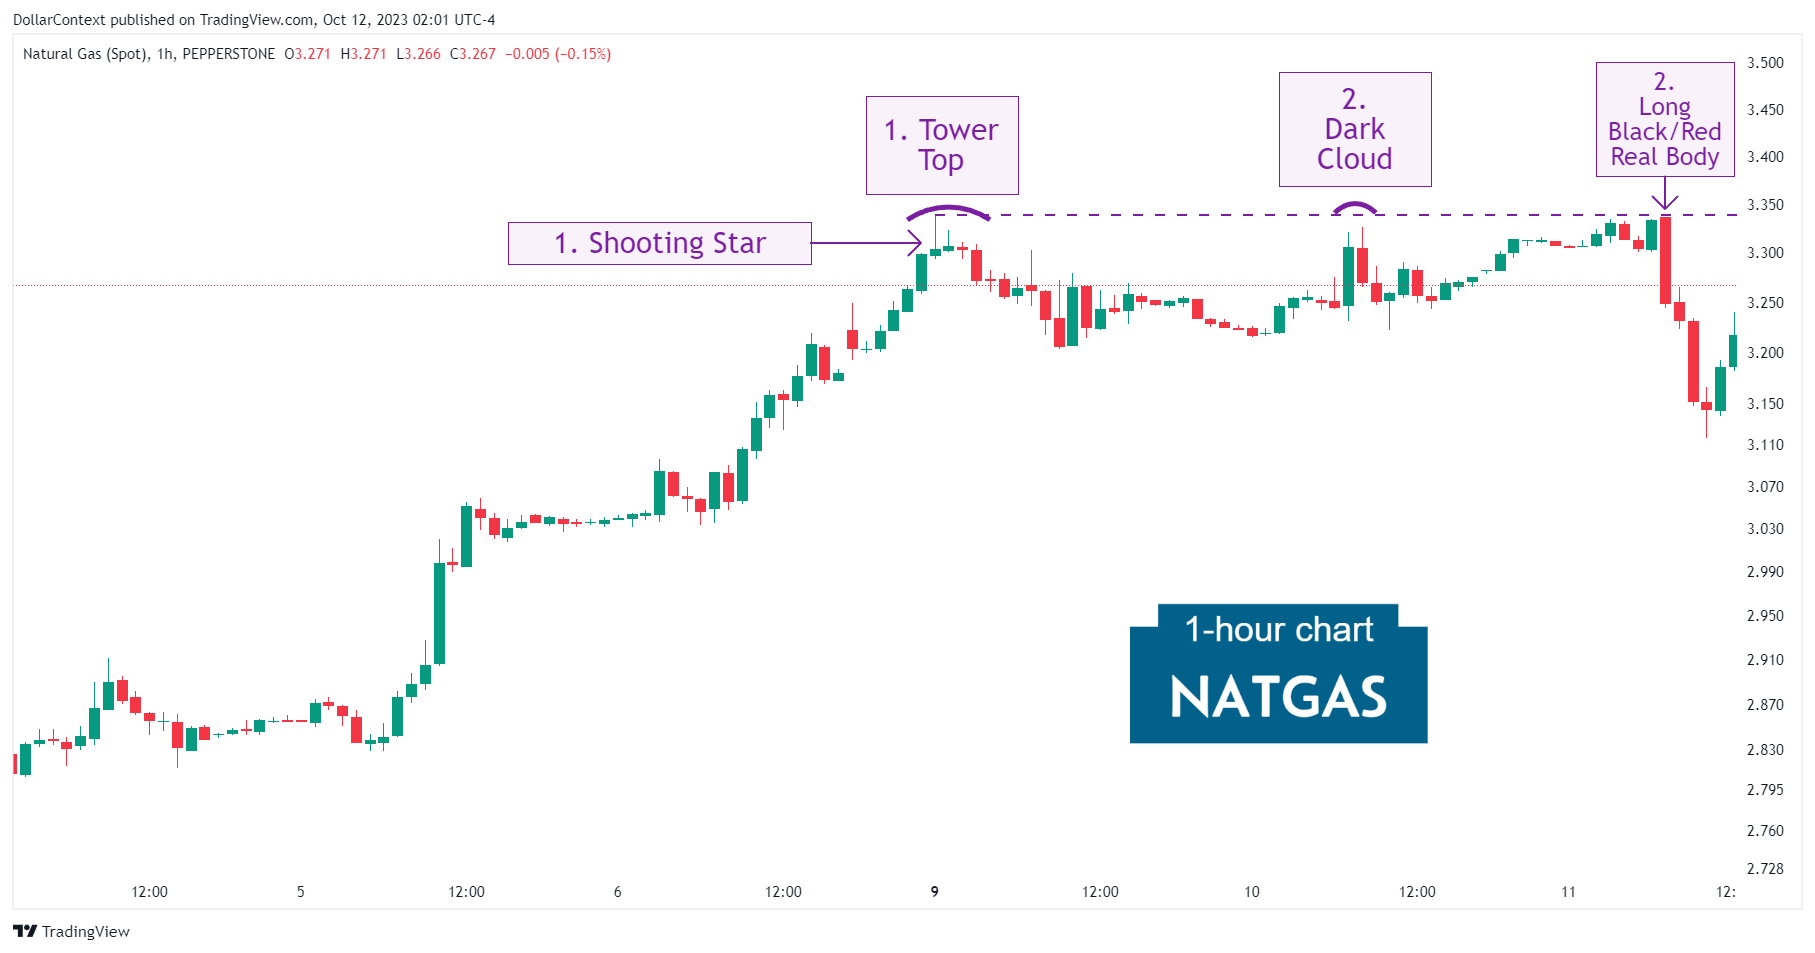
2. Early Market Transition
After the tower top formation, there was a short-lived pullback before the market settled into a range-bound pattern. The resistance level established by the tower top was respected within the trading range and strengthened by a dark cloud cover and a long black real body.
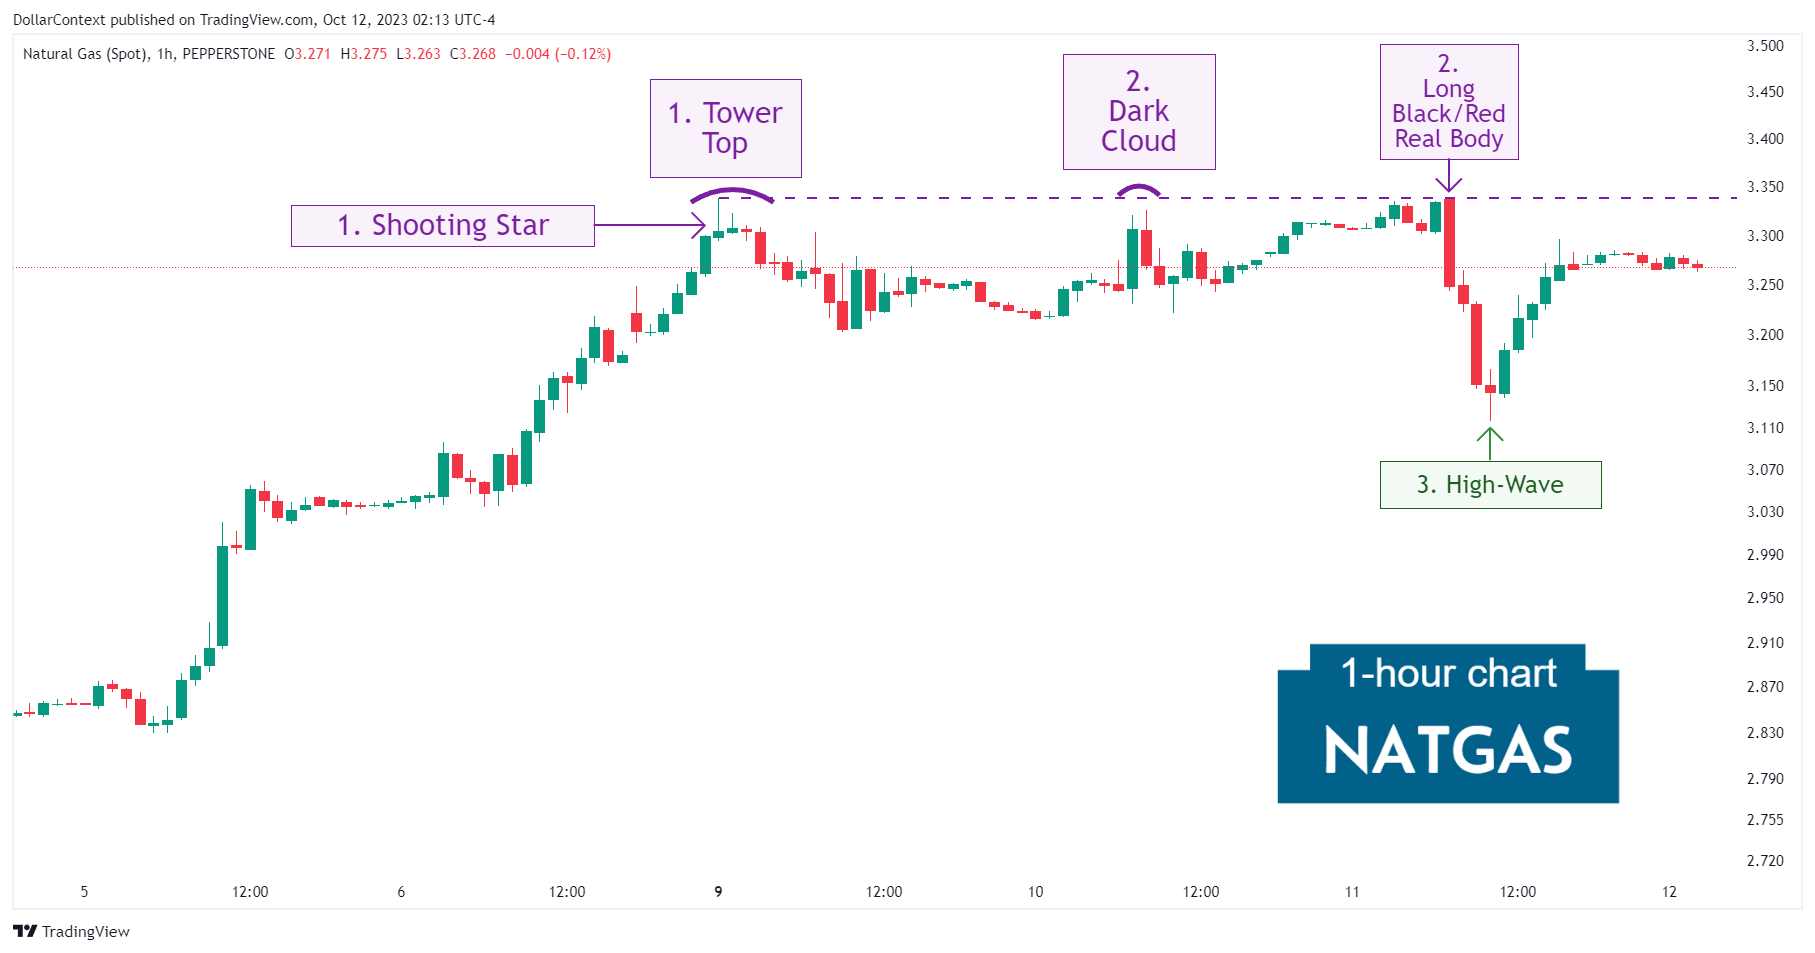
3. Resolution
The long black real body marked the beginning of a short but steep decline that stalled with a high-wave candle.
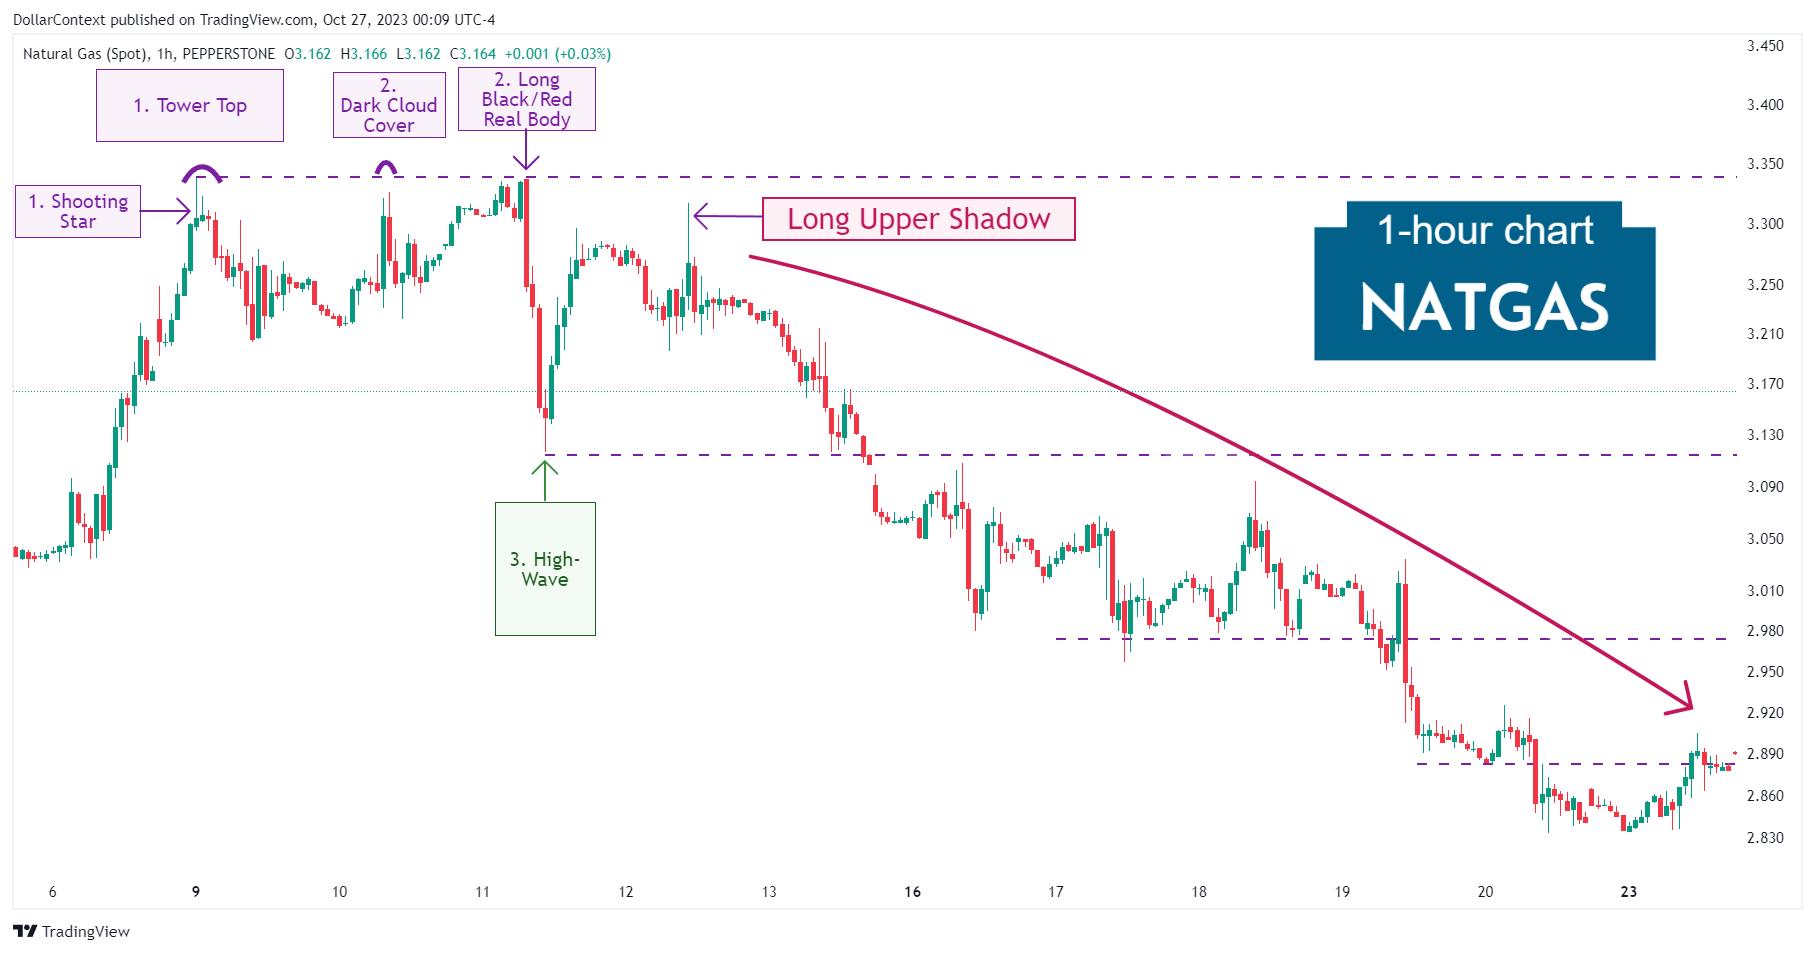
Eventually, a long upper shadow confirmed the resistance level established by prior candlestick formations, signaling the start of a significant downtrend.
4. Conclusion
4.1 Pattern Development
The signals given by the initial reversal patterns, the tower top and the shooting star, evolved into an extended trading range rather than a direct reversal. The dark cloud cover further emphasized the robustness of the resistance set by the tower top, amplifying the chances of a market downturn from those points.
4.2 Outcome Analysis
The long black real body heightened the likelihood of a downward breakout. This scenario played out, although the decline was quickly interrupted by a high-wave session.
The subsequent emergence of a long upper shadow near the key resistance zone defined by previous reversal patterns indicated the onset of a prolonged downtrend.


