
Case Study 0008: High-Wave and Engulfing Pattern at the Bottom of a Window (WTI)
In this article, we will cover the performance of the WTI market after the emergence of a high-wave and an engulfing pattern.


Data Sheet
- Reference: CS0008
- Security: WTI Crude Oil
- Timeframe: Hourly Chart (October 12, 2023)
- Patterns:
- Rising Window (Gap)
- High-Wave
- Bullish Engulfing Pattern
- Long White Real Body
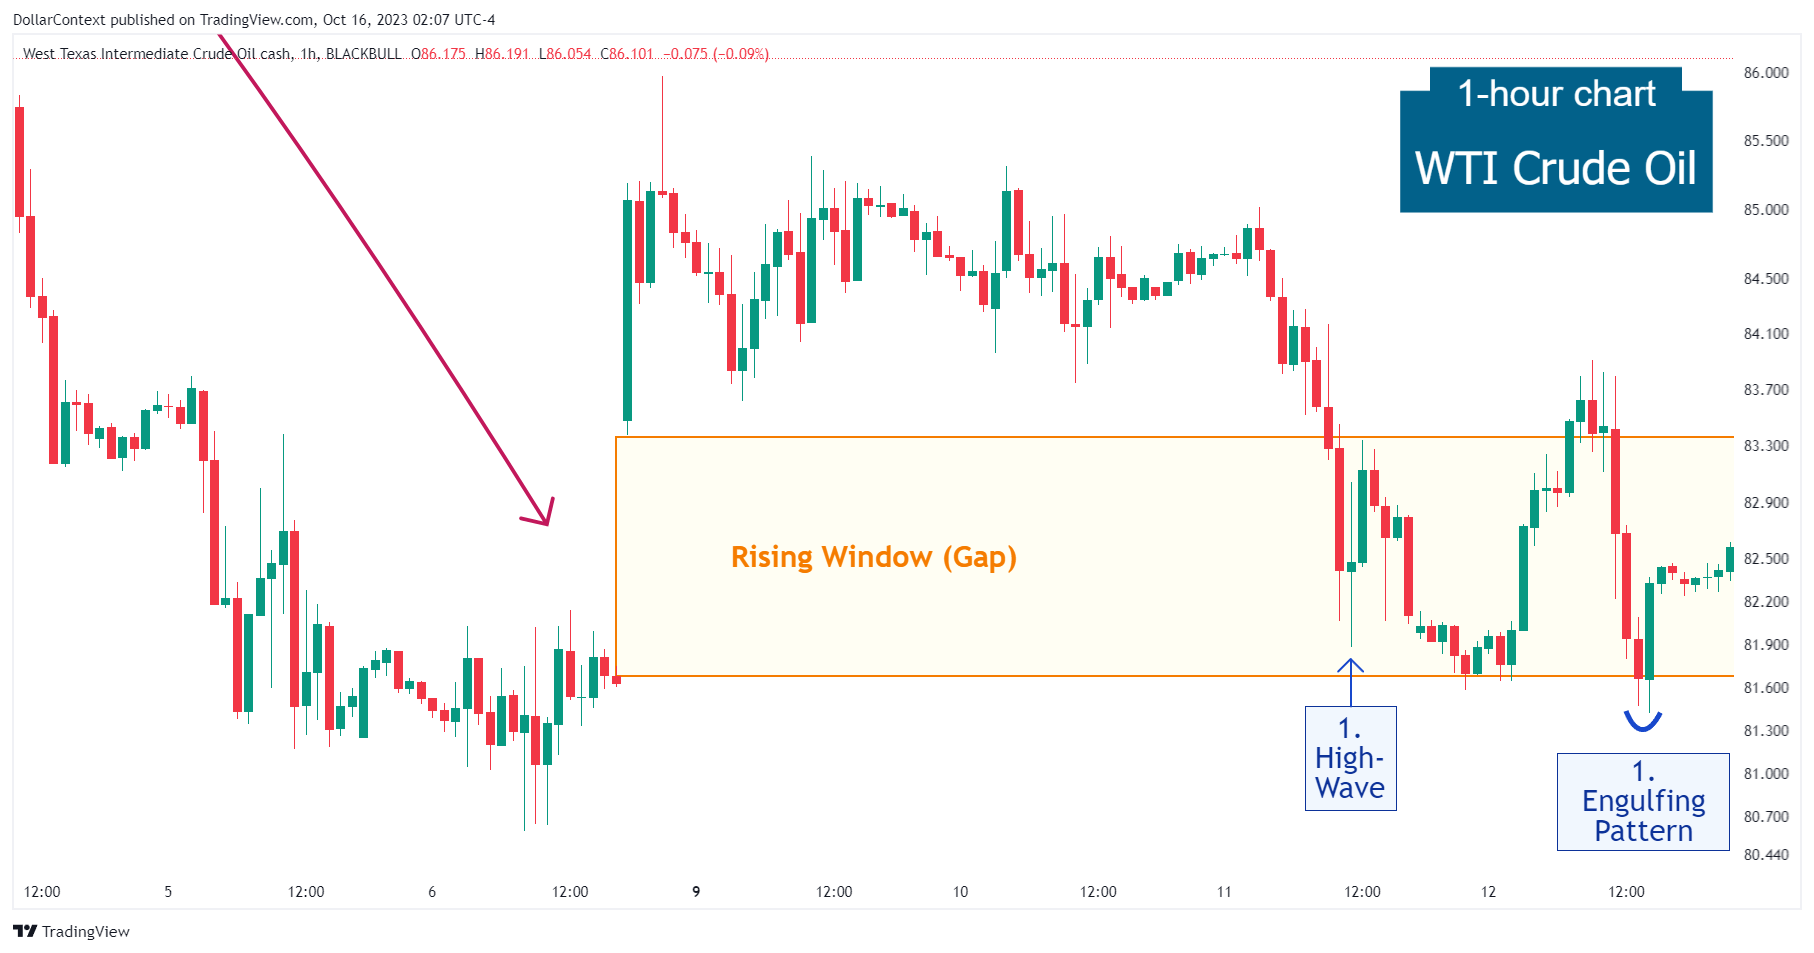
1. Signal Formation
On October 6, 2023, the WTI oil market displayed a notable rising window (gap). Three days later, a high-wave candle emerged near the bottom of the window, confirming its significance as a support zone. On the next day, a bullish engulfing pattern, which includes a long white real body, further reinforced the likelihood of a bullish reversal.
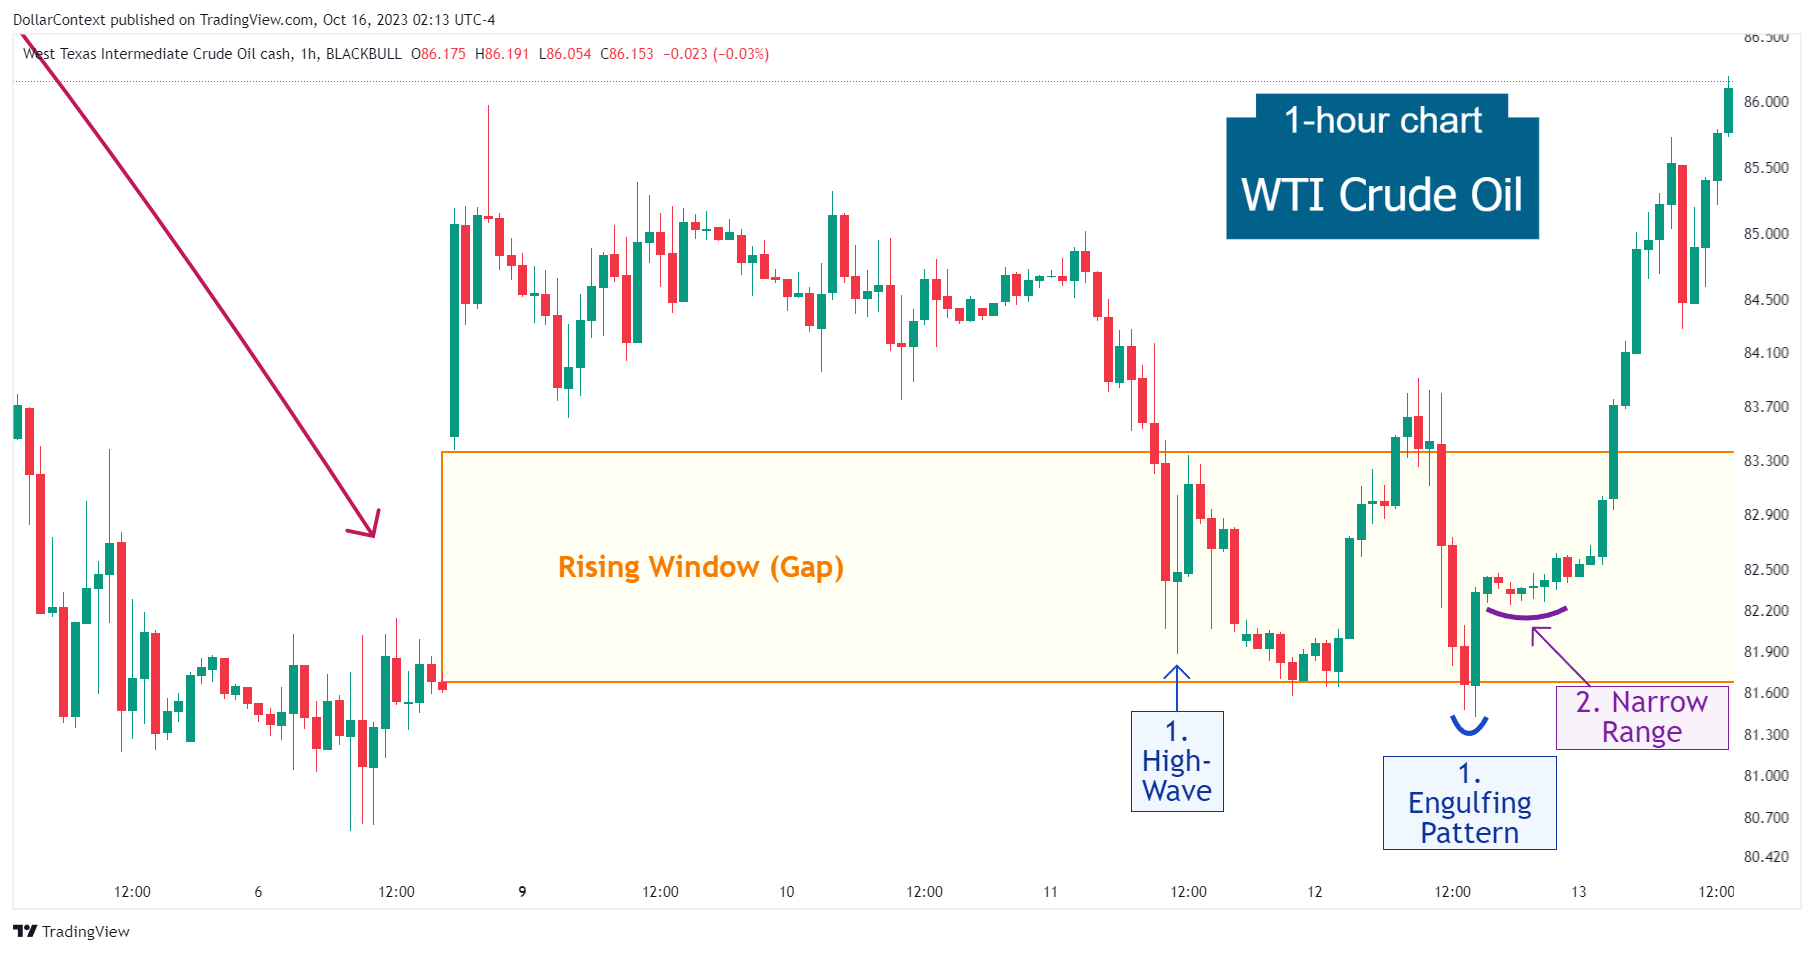
2. Early Market Transition
Following the engulfing pattern, the oil market exhibited a narrow range before initiating a steep upward move.
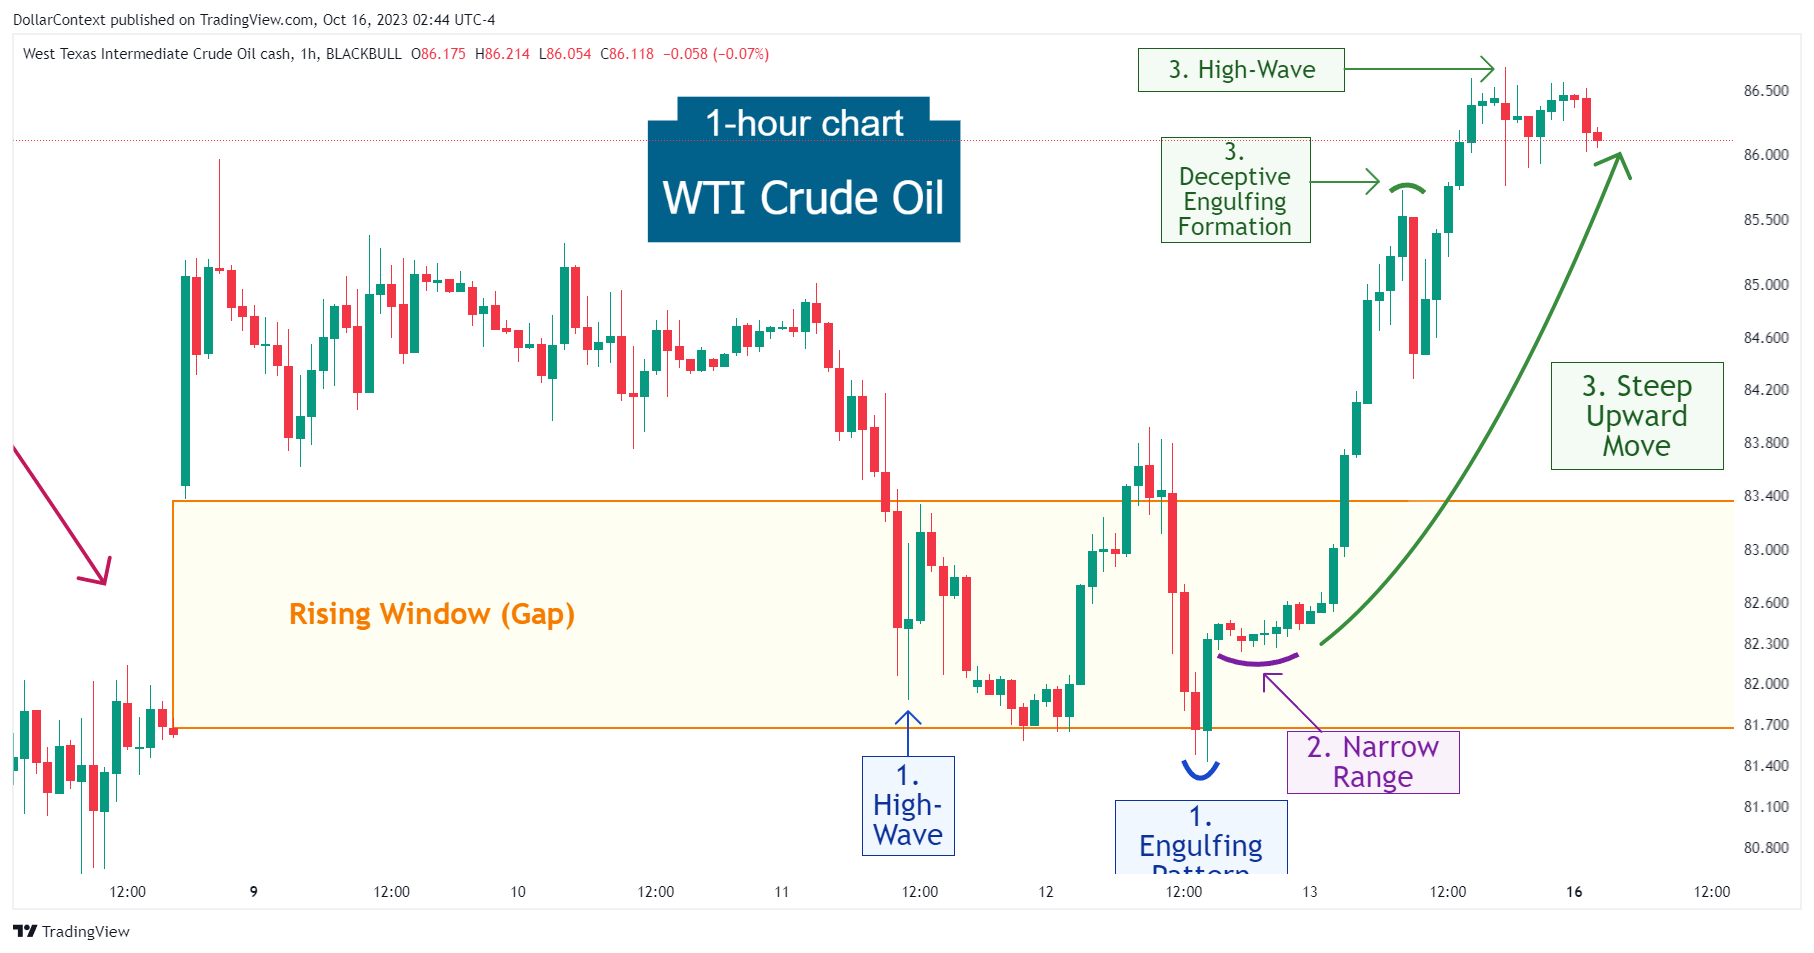
3. Resolution
After the narrow trading range, the market transitioned into an accelerated rise. Note the deceptive engulfing pattern emerging within the upward trajectory. After such an emerging uptrend, this engulfing formation would have appeared too early to be considered a valid reversal pattern. Remember, candlestick reversal patterns should appear after a mature or extended trend has developed. Otherwise, they should be subject to further confirmation before initiating a position.
A high-wave candlestick near the $86 level marked an initial peak in the WTI market, potentially signaling a temporary shift to a sideways trading range.
4. Conclusion and Subjective Review
4.1 Pattern Development
In the realm of Japanese candlestick analysis, the confluence of a sequence of important reversal indicators around the same price level should always be taken seriously. This is what happened in October 2023 in the oil market, when a rising window, a high-wave, and finally an engulfing pattern signaled a possible bullish reversal.
4.2 Outcome Analysis
As indicated by the reversal patterns mentioned above, the market experienced a steep upward move, the end of which we cannot conclusively determine at the time of writing.


