Case Study 0009: Evening Star Transitions Into a Consolidating Phase (S&P 500)
In this article, we will discuss the performance of the S&P 500 after the appearance of an evening star.
Data Sheet
- Reference: CS0009
- Security: S&P 500
- Timeframe: Hourly Chart (October 10, 2023)
- Patterns:
- Evening Star
- Upthrust
- Spinning Tops
- High-Wave
1. Signal Formation
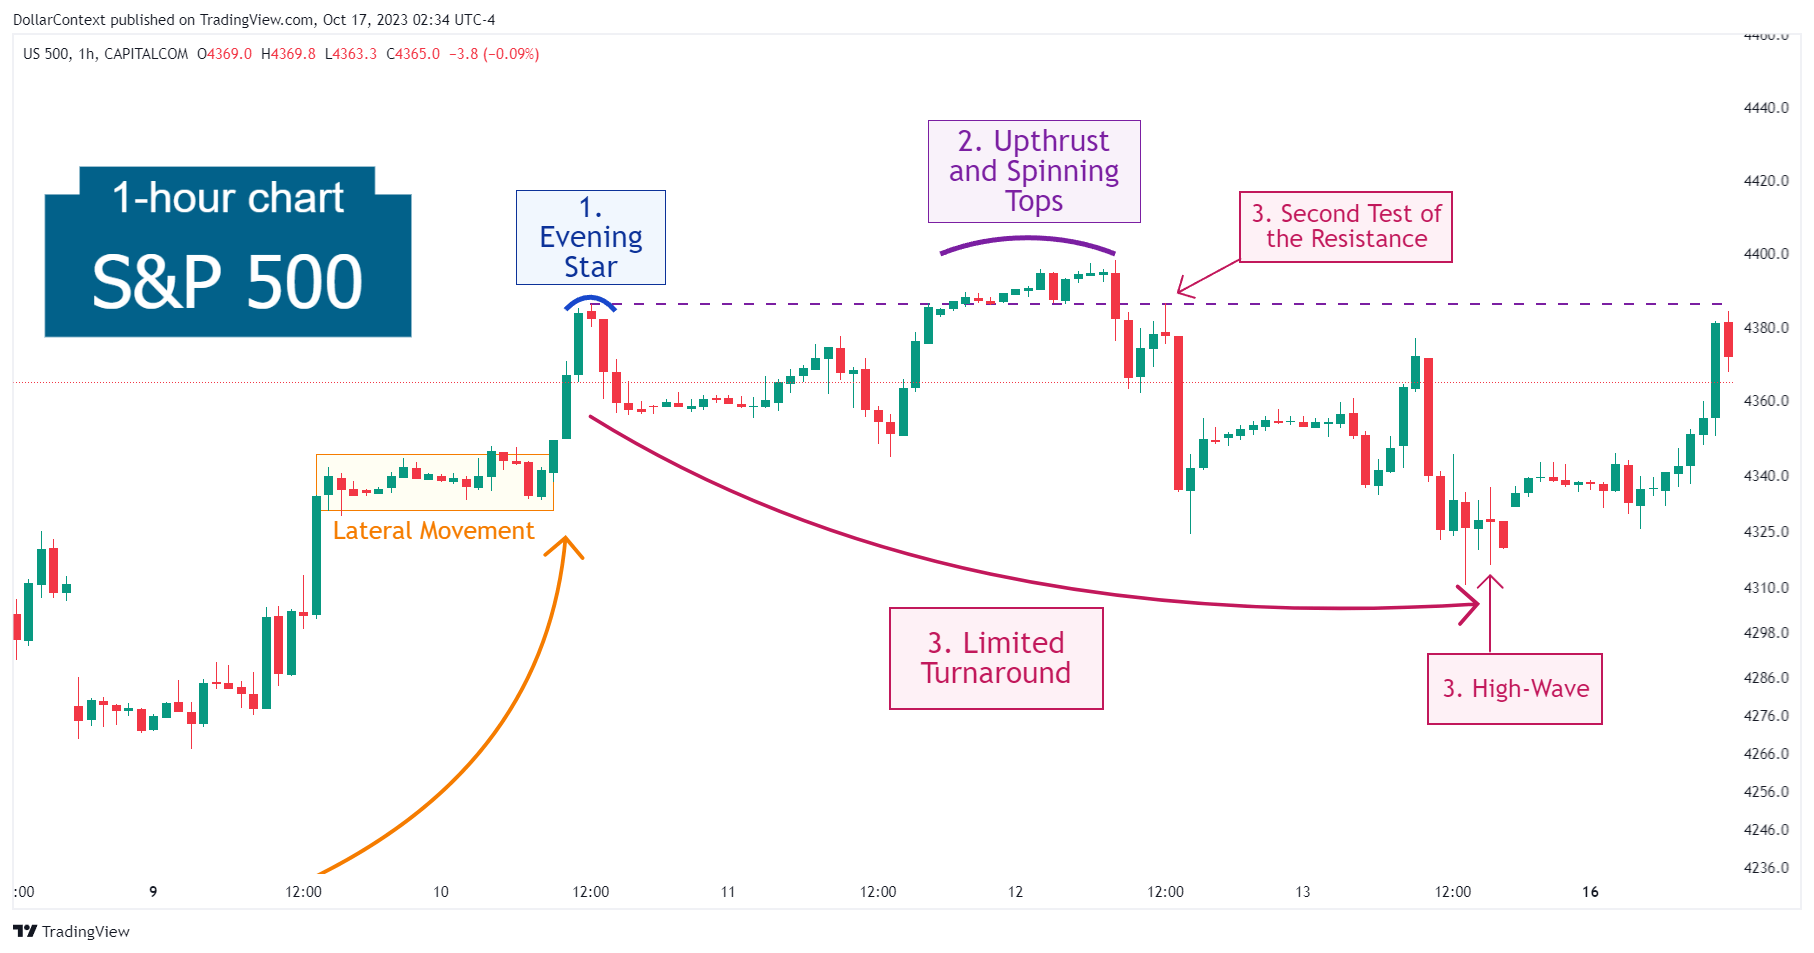
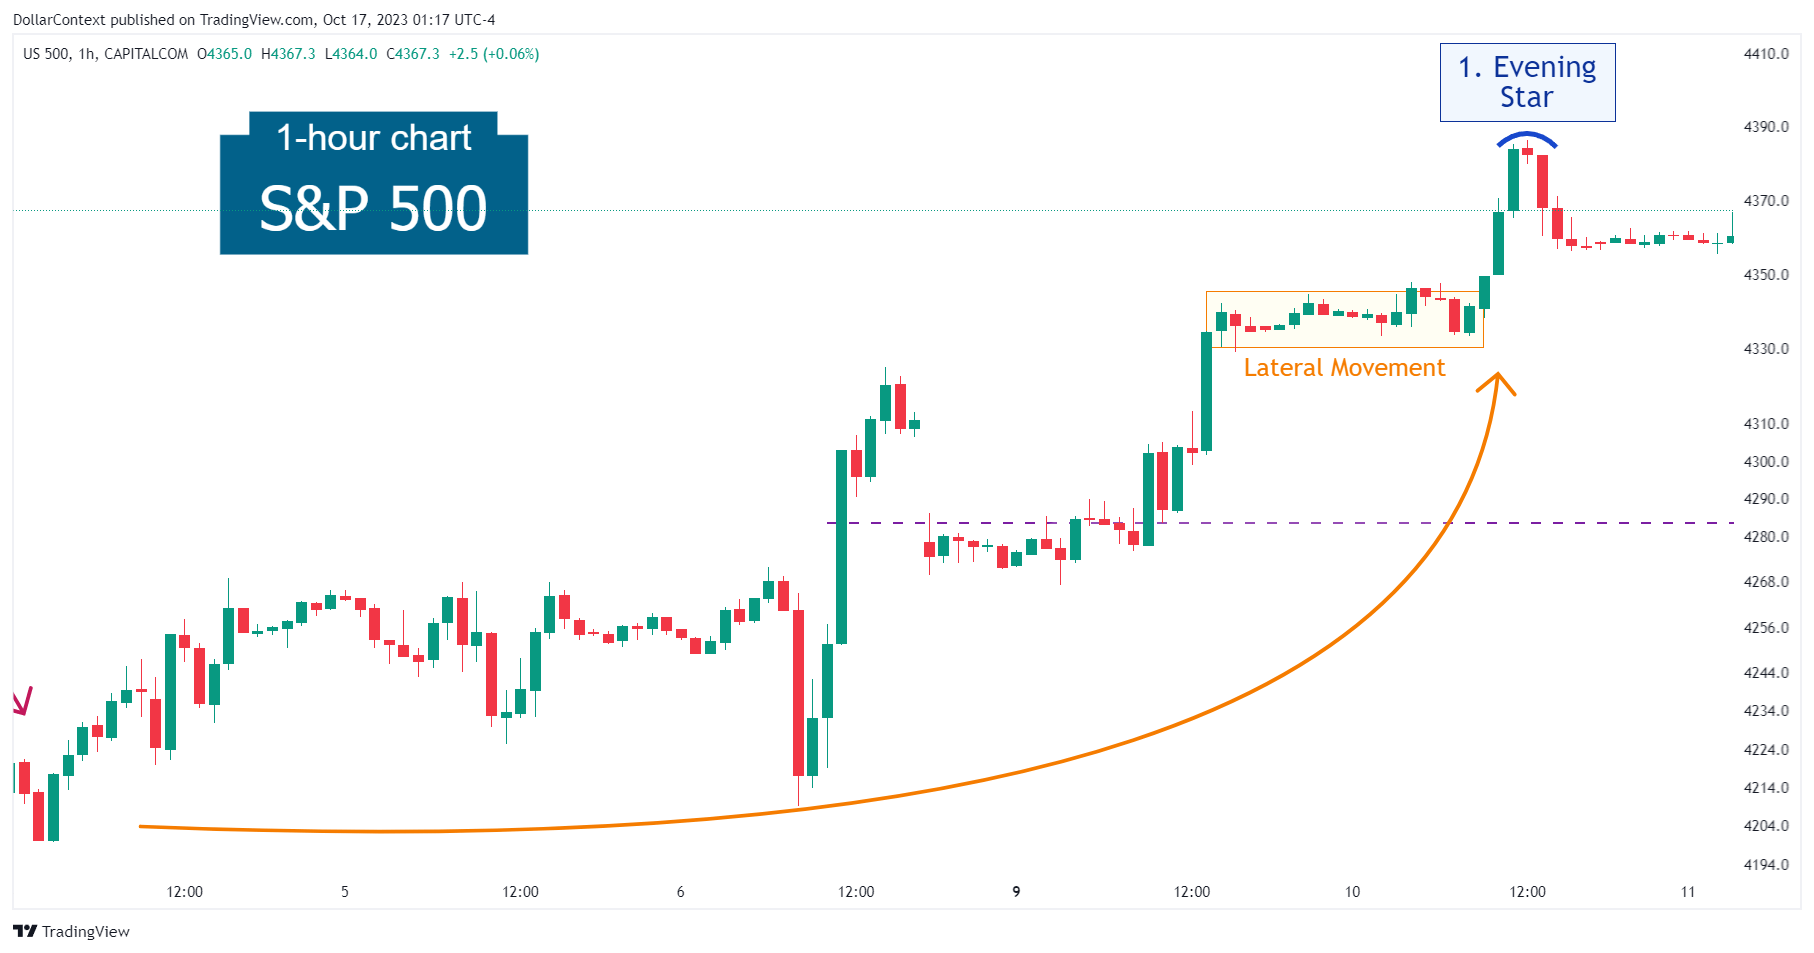
After an extended, albeit not pronounced, uptrend, the S&P 500 displayed an evening star pattern on October 10, 2023.
It's worth noting that the evening star was preceded by a consolidating phase or lateral movement.
2. Early Market Transition
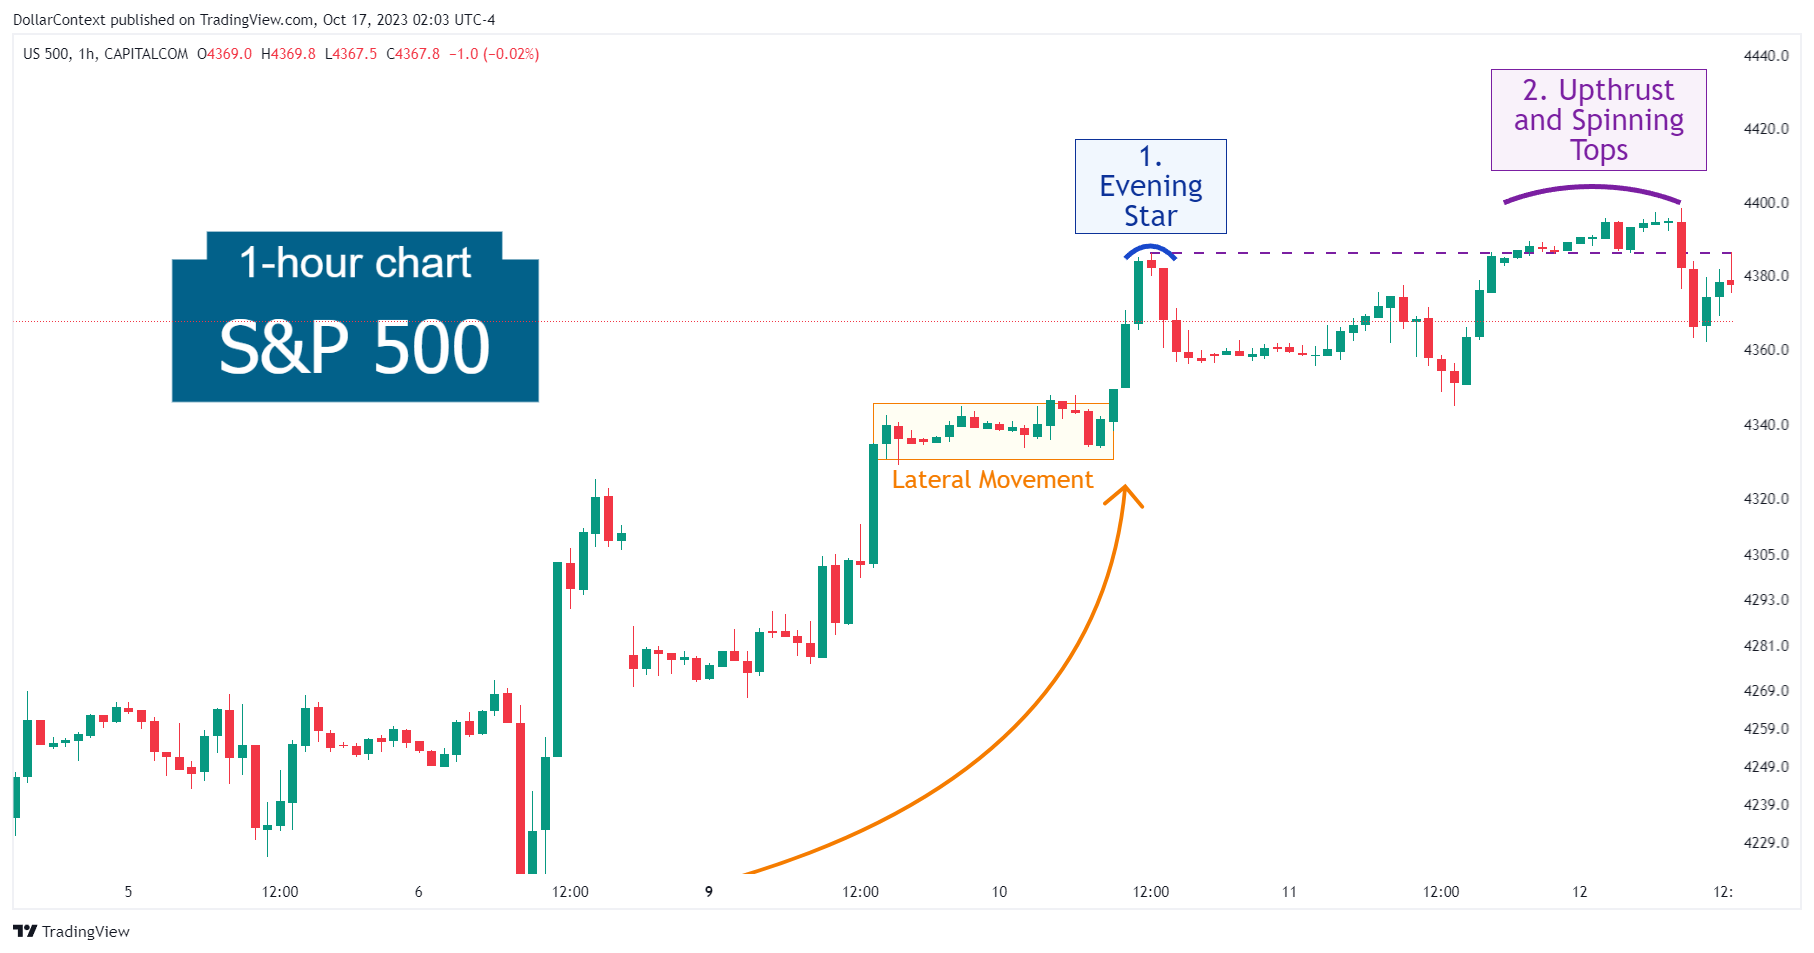
Instead of reversing immediately, the market decided to test, and briefly surpass, the resistance area set by the evening star. Eventually, the S&P 500 exhibited a prolonged upthrust (false breakout) basically characterized by a series of spinning tops.
3. Resolution
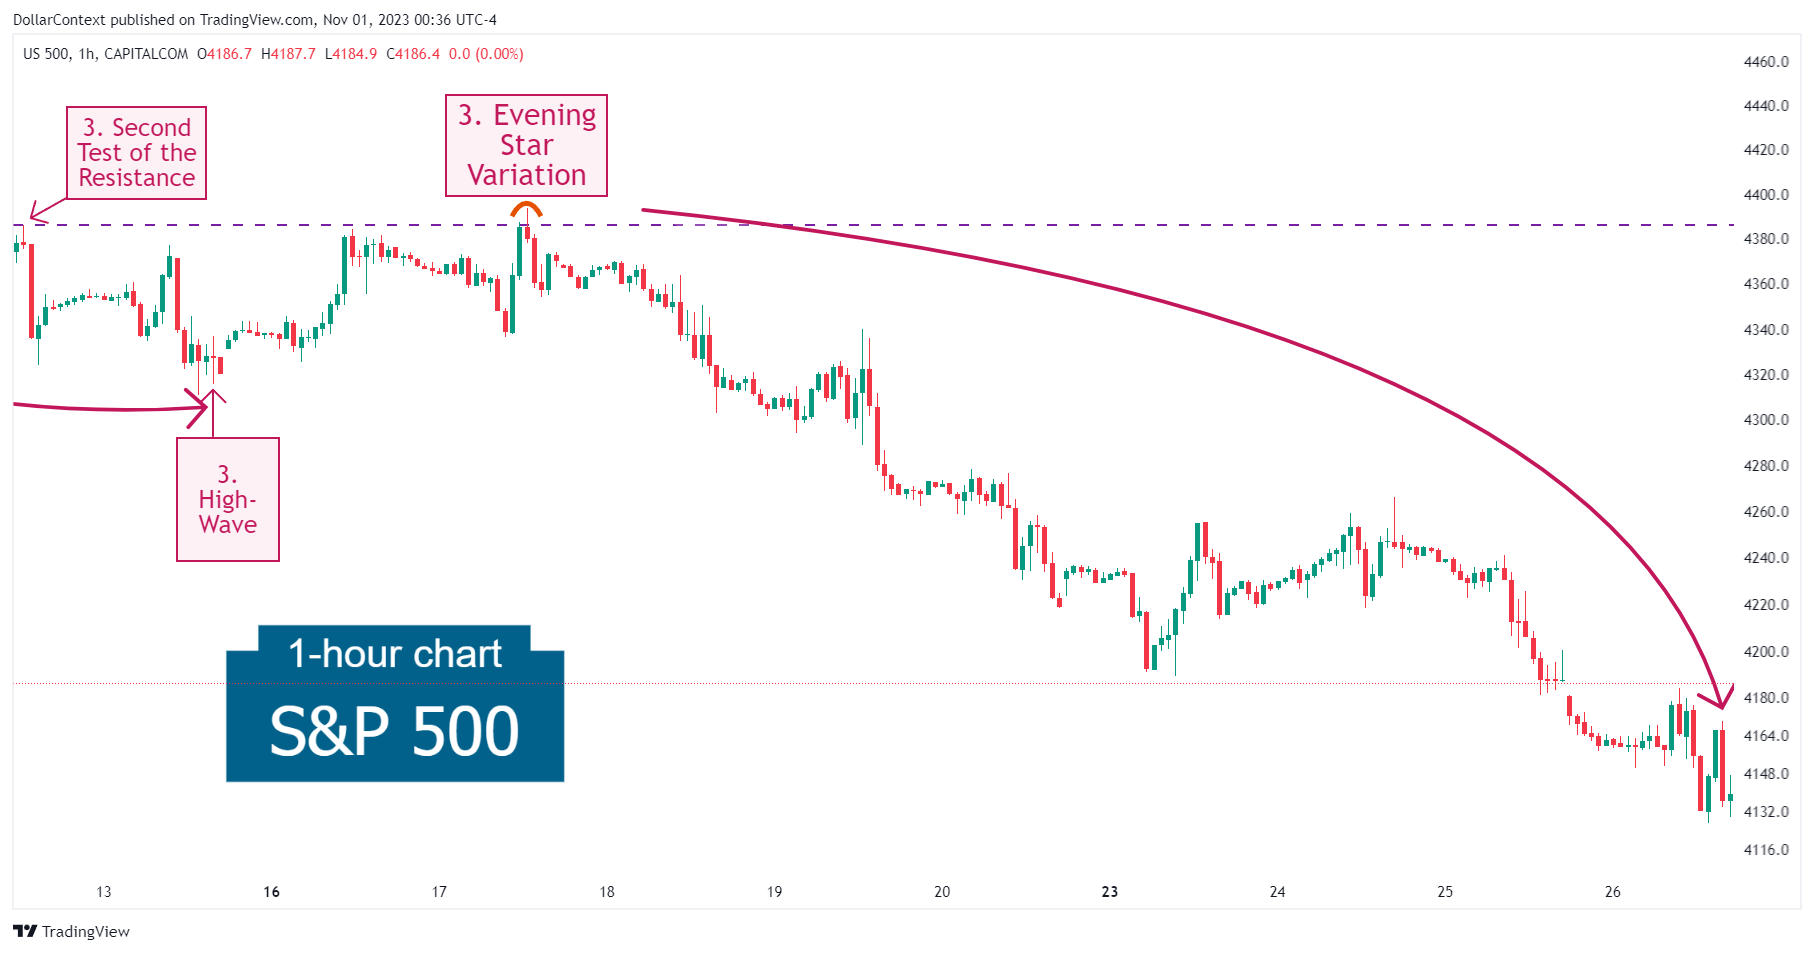
After the upthrust, the market began its downward move. Note how the index retested the high set by the evening star pattern, and this time successfully got rejected.
Initially, the scope of the downturn was not very significant in terms of price, and the downward move concluded with a high-wave candlestick.
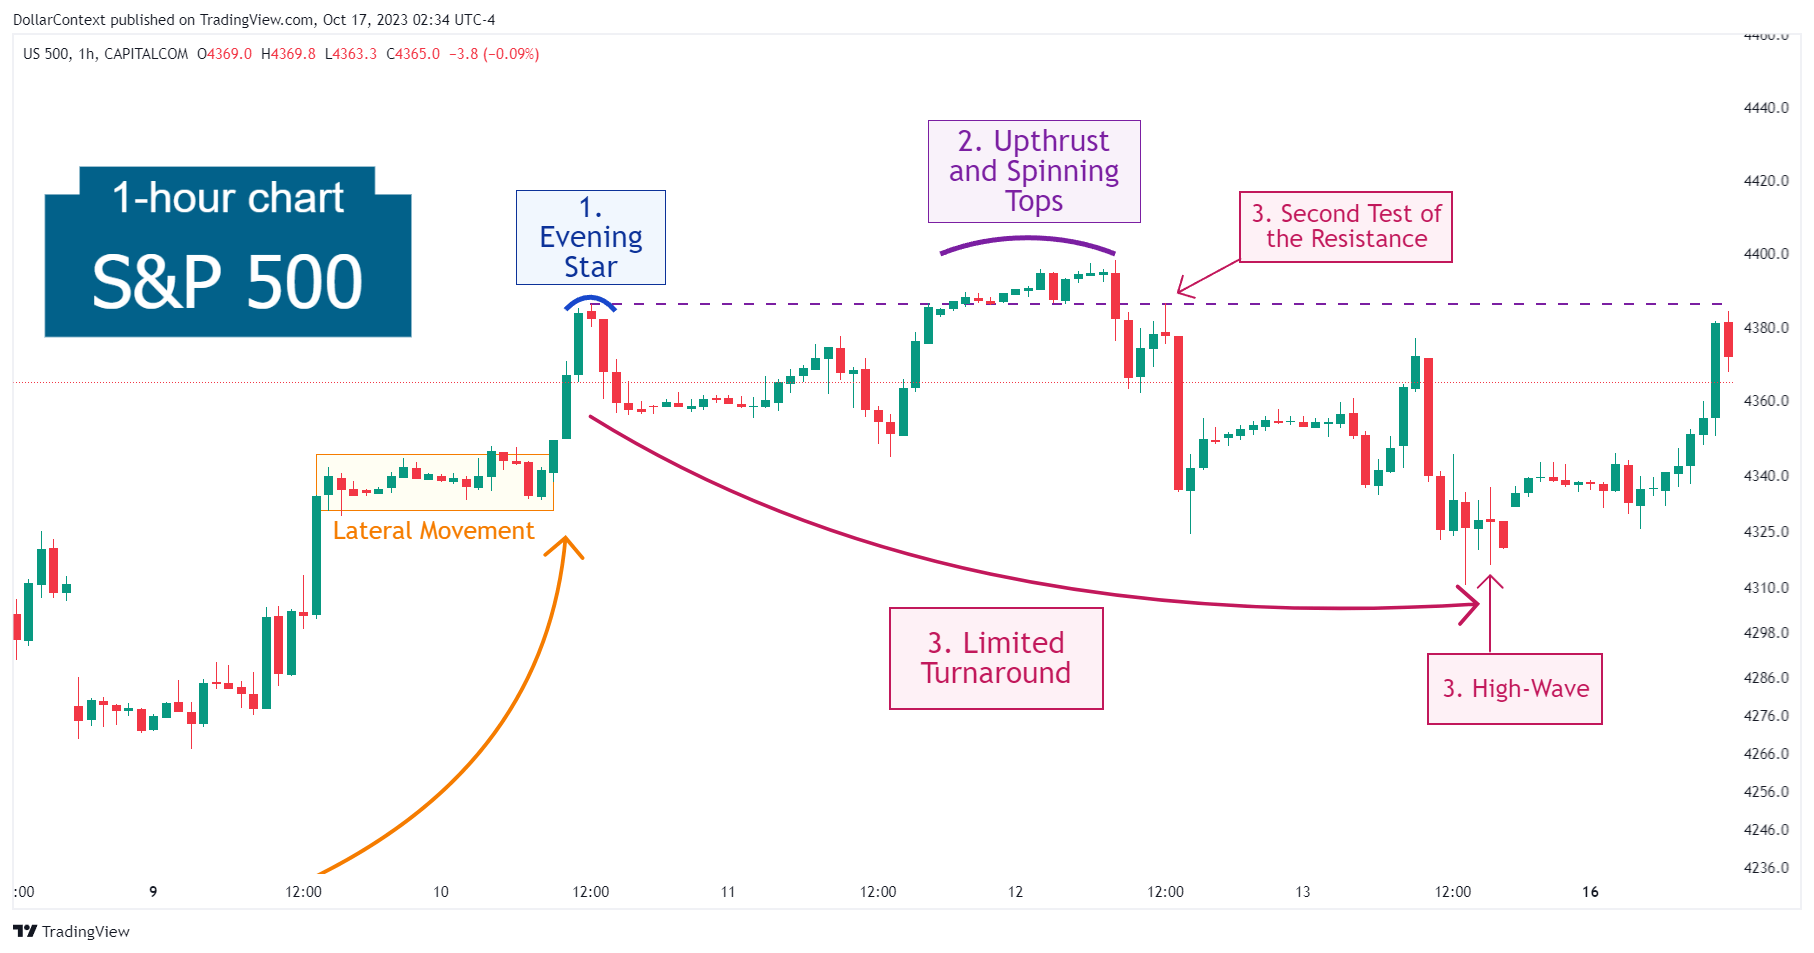
After testing the resistance level two more times, with the final test manifesting as another variation of the evening star pattern, the index embarked on a sustained and extended decline.
4. Conclusion and Subjective Review
Often, an evening star that is preceded by a sideways market signals a lengthy market transition with limited price resolution. However, if a second bearish pattern appears within the resistance zone established by the evening star, a bearish reversal becomes much more likely.
In this case, the market first exhibited an extended but shallow downtrend before embarking on a more significant downward movement.


