Case Study 0010: Evening Star and Shooting Star Patterns Yield Immediate Results (AUD/USD)
In this article, we will cover the performance of the AUD/USD market after the appearance of an evening star and shooting star pattern.

This case study examines a historical market setup observed in the AUD/USD in October 2023. It is intended for educational purposes and illustrates how specific candlestick patterns behaved in real market conditions.
Case Study Data Sheet (Historical)
- Reference: CS0010
- Security: AUD/USD
- Timeframe: Hourly Chart (October 18, 2023)
-
Patterns:
- Evening Star
- Shooting Star
- Doji
- Long-Legged Doji / High-Wave Doji
- Hanging Man
1. Signal Formation
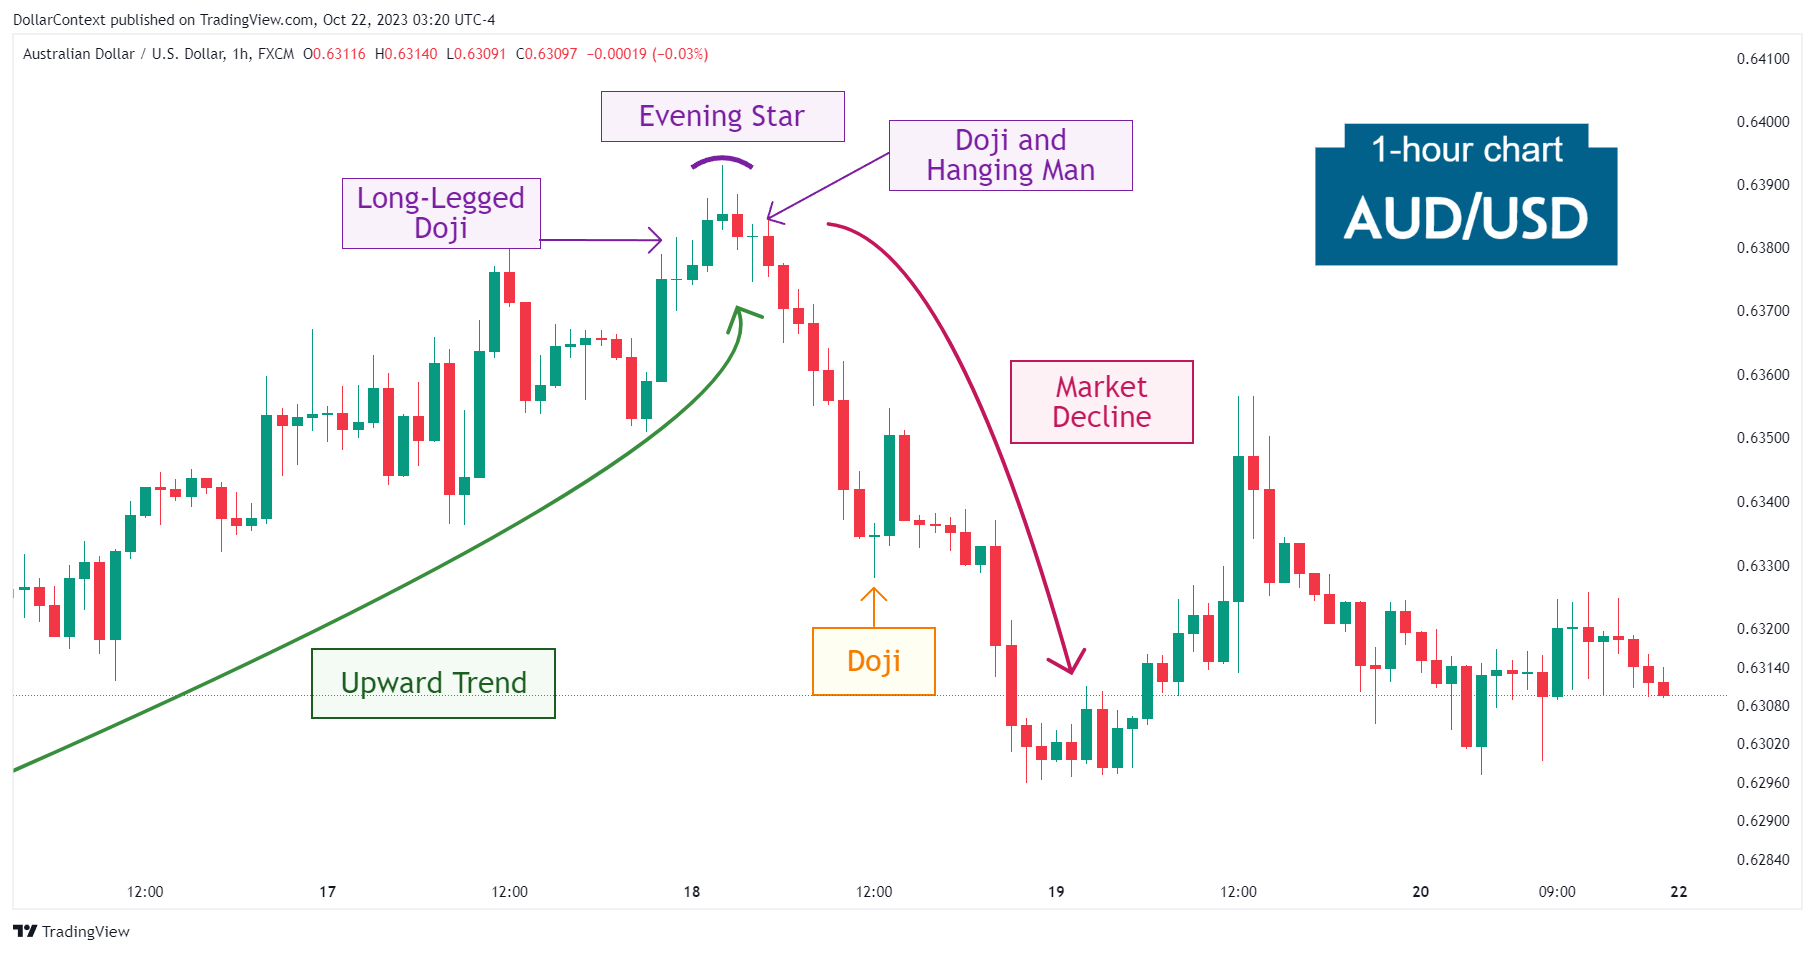
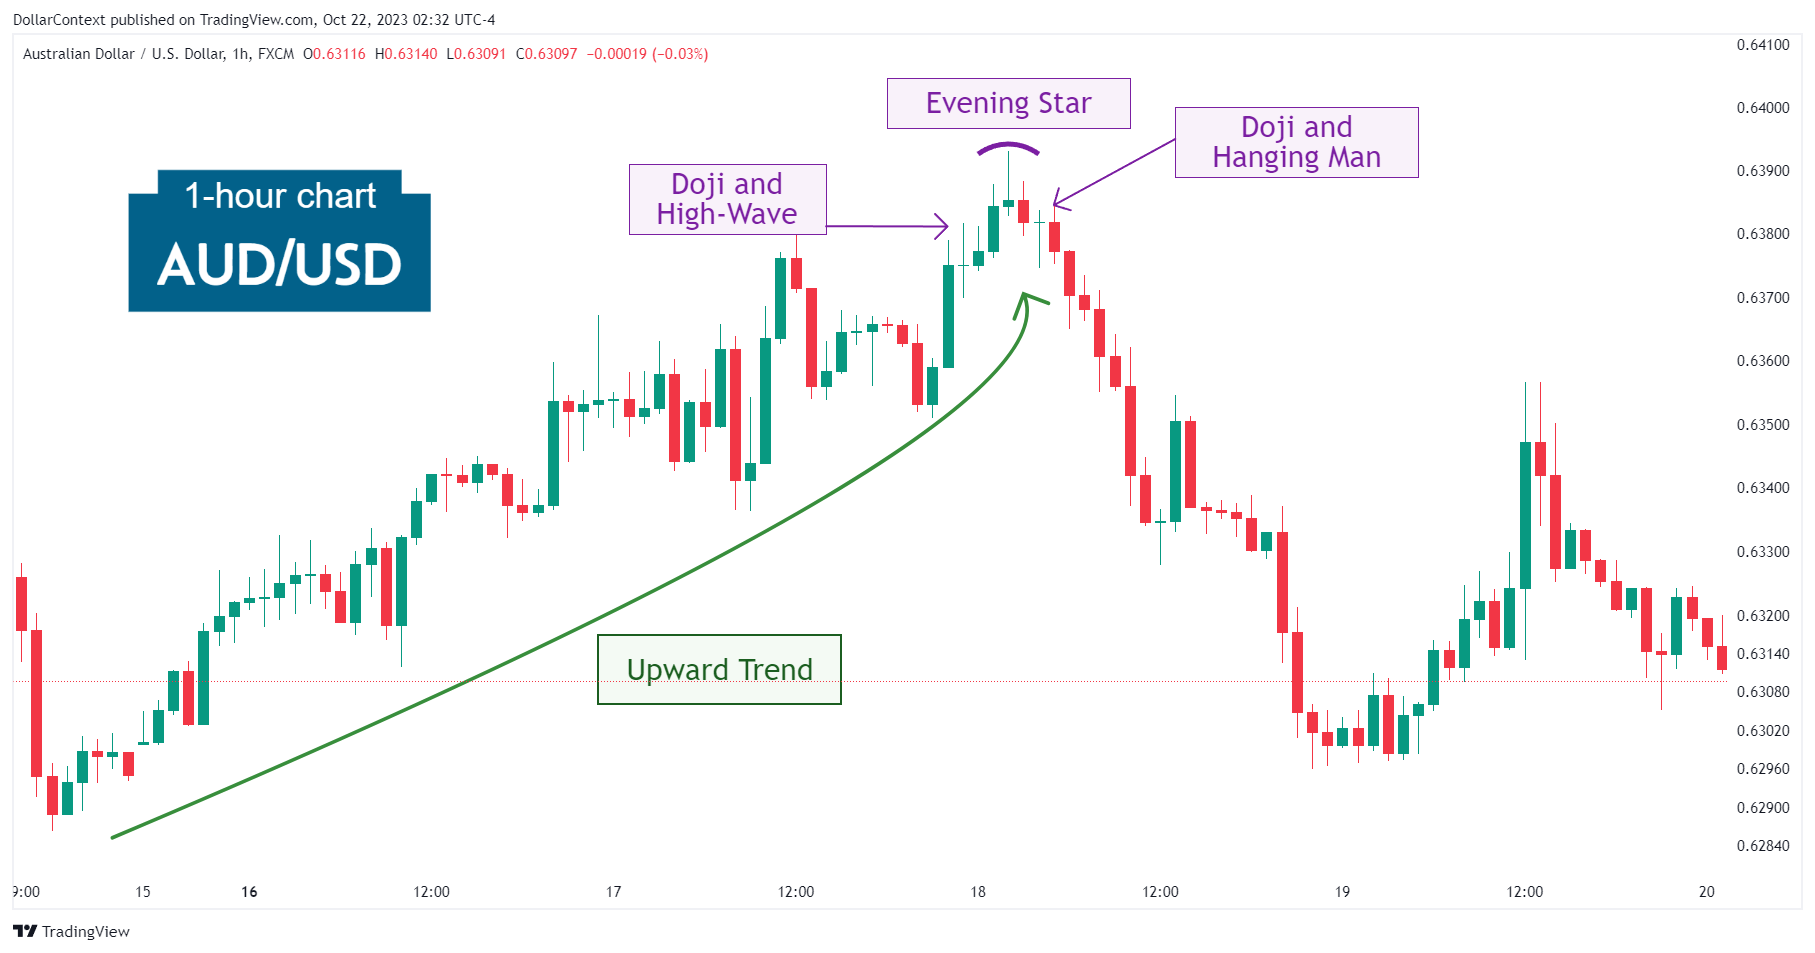
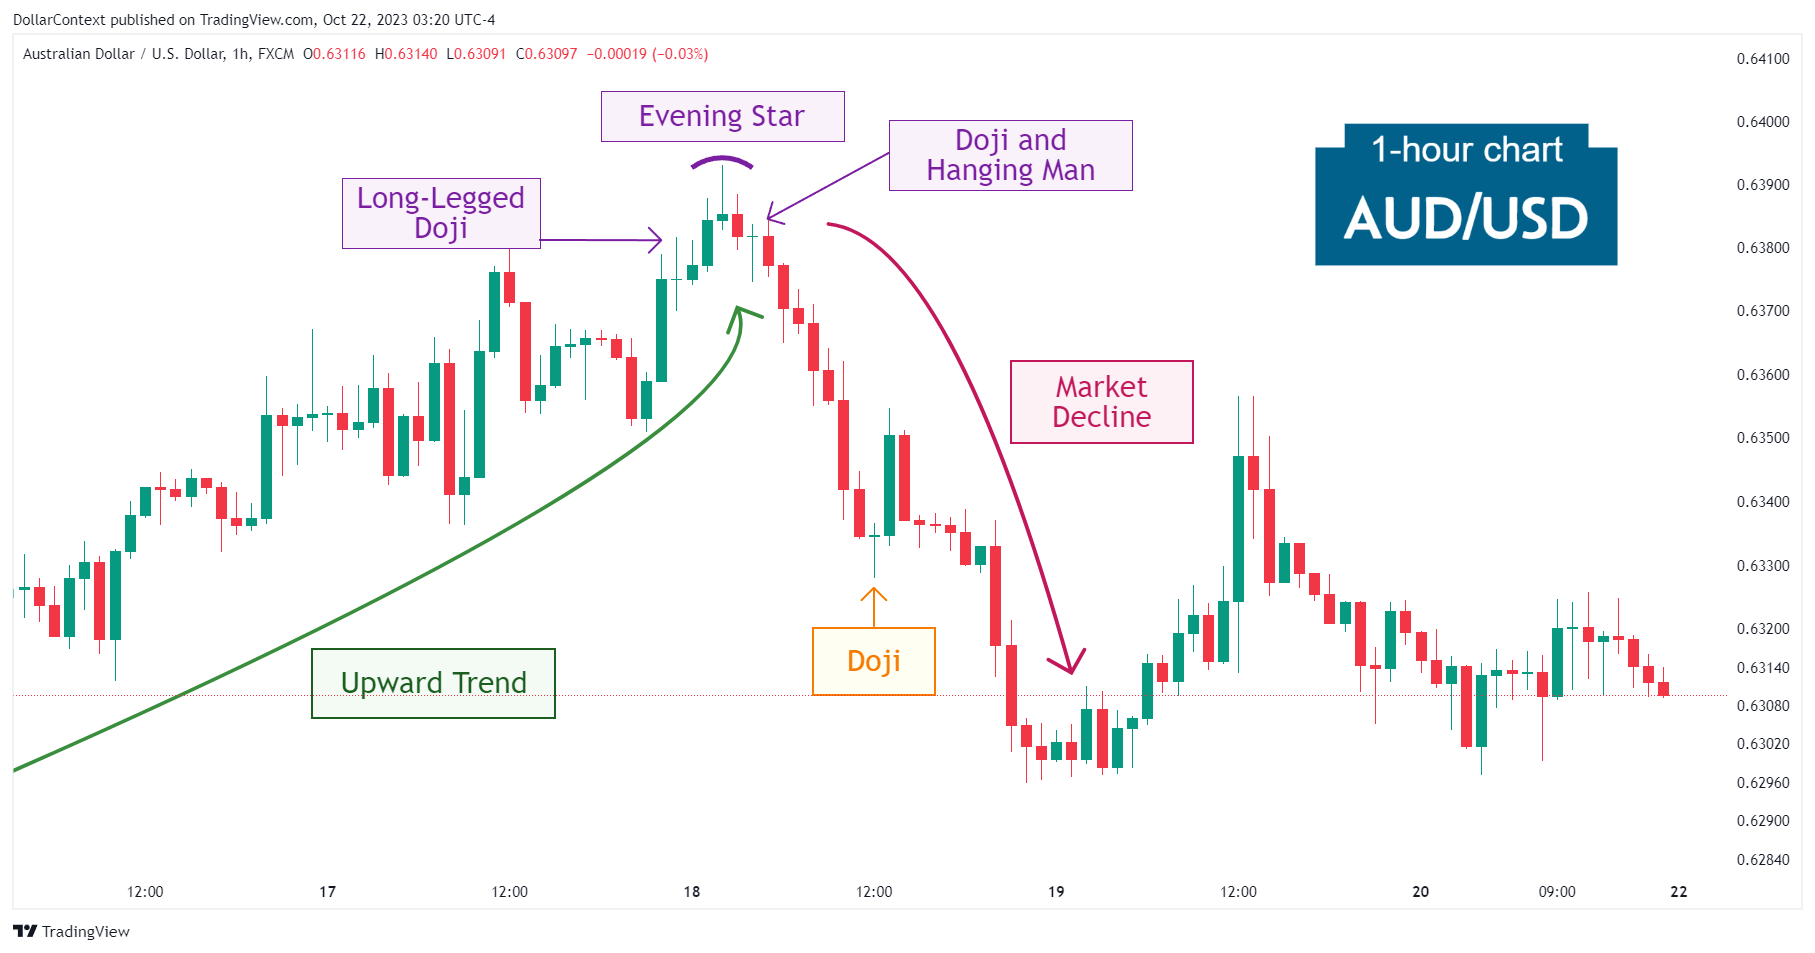
The rally in the AUD/USD that began on October 13 gave its first sign of peaking with a long-legged doji.
While the market temporarily challenged, and actually surpassed, the highs of the doji session, the appearance of a new pattern, the evening star, strongly stressed that the previous trend might be over. Note that the second session of the three-candle formation was a shooting star itself.
The evening star was followed by another doji session near the highs of the initial long-legged doji. With its extended lower shadow, this doji candle could also be viewed as a hanging man.

2. Early Market Transition
After the series of bearish reversal patterns described above, the market rapidly began to decline without further testing of the highs.
3. Resolution
Near the middle of the downward trajectory, the decline was temporarily interrupted by a doji and a tall white candle. Apparently, the downtrend was not yet exhausted and resumed its decline afterward.

4. Conclusion and Retrospective Assessment
The appearance of a reversal pattern following a prolonged uptrend doesn't necessarily guarantee an immediate trend reversal. However, it should serve as a cautionary sign to be vigilant, as a subsequent pattern could form just above the price range of the initial signal.
This exact sequence of events played out in the AUD/USD: the initial long-legged doji acted as a preliminary warning, later confirmed by an evening star that formed just above it. This evening star, which itself included a shooting star, ultimately proved to be the decisive signal for a trend reversal.


