
Case Study 0011: Three Doji Candles and Tower Top (EUR/USD)
In this article, we will discuss the performance of the EUR/USD after the emergence of a series of doji sessions and a tower top.

Data Sheet
- Reference: CS0011
- Security: EUR/USD
- Timeframe: Daily Chart (July 18, 2023)
- Patterns:
- Doji
- Long Upper Shadow
- High-Wave
- Shooting Star
- Tower Top
1. Signal Formation
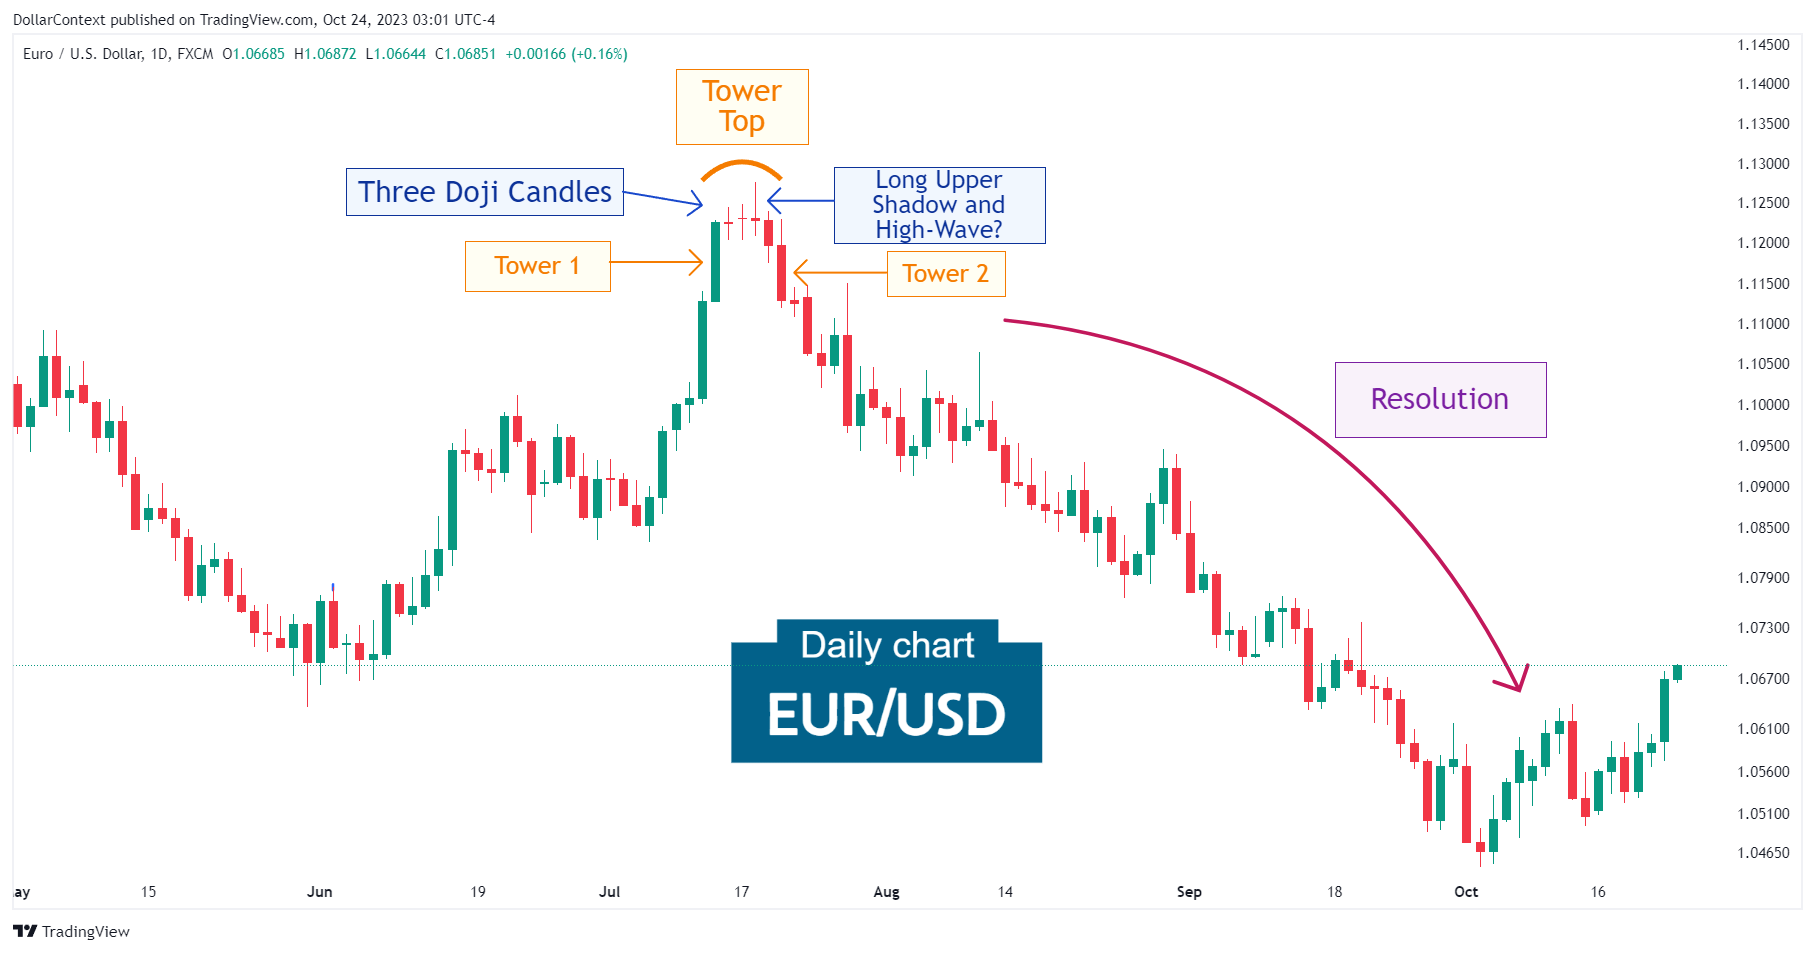
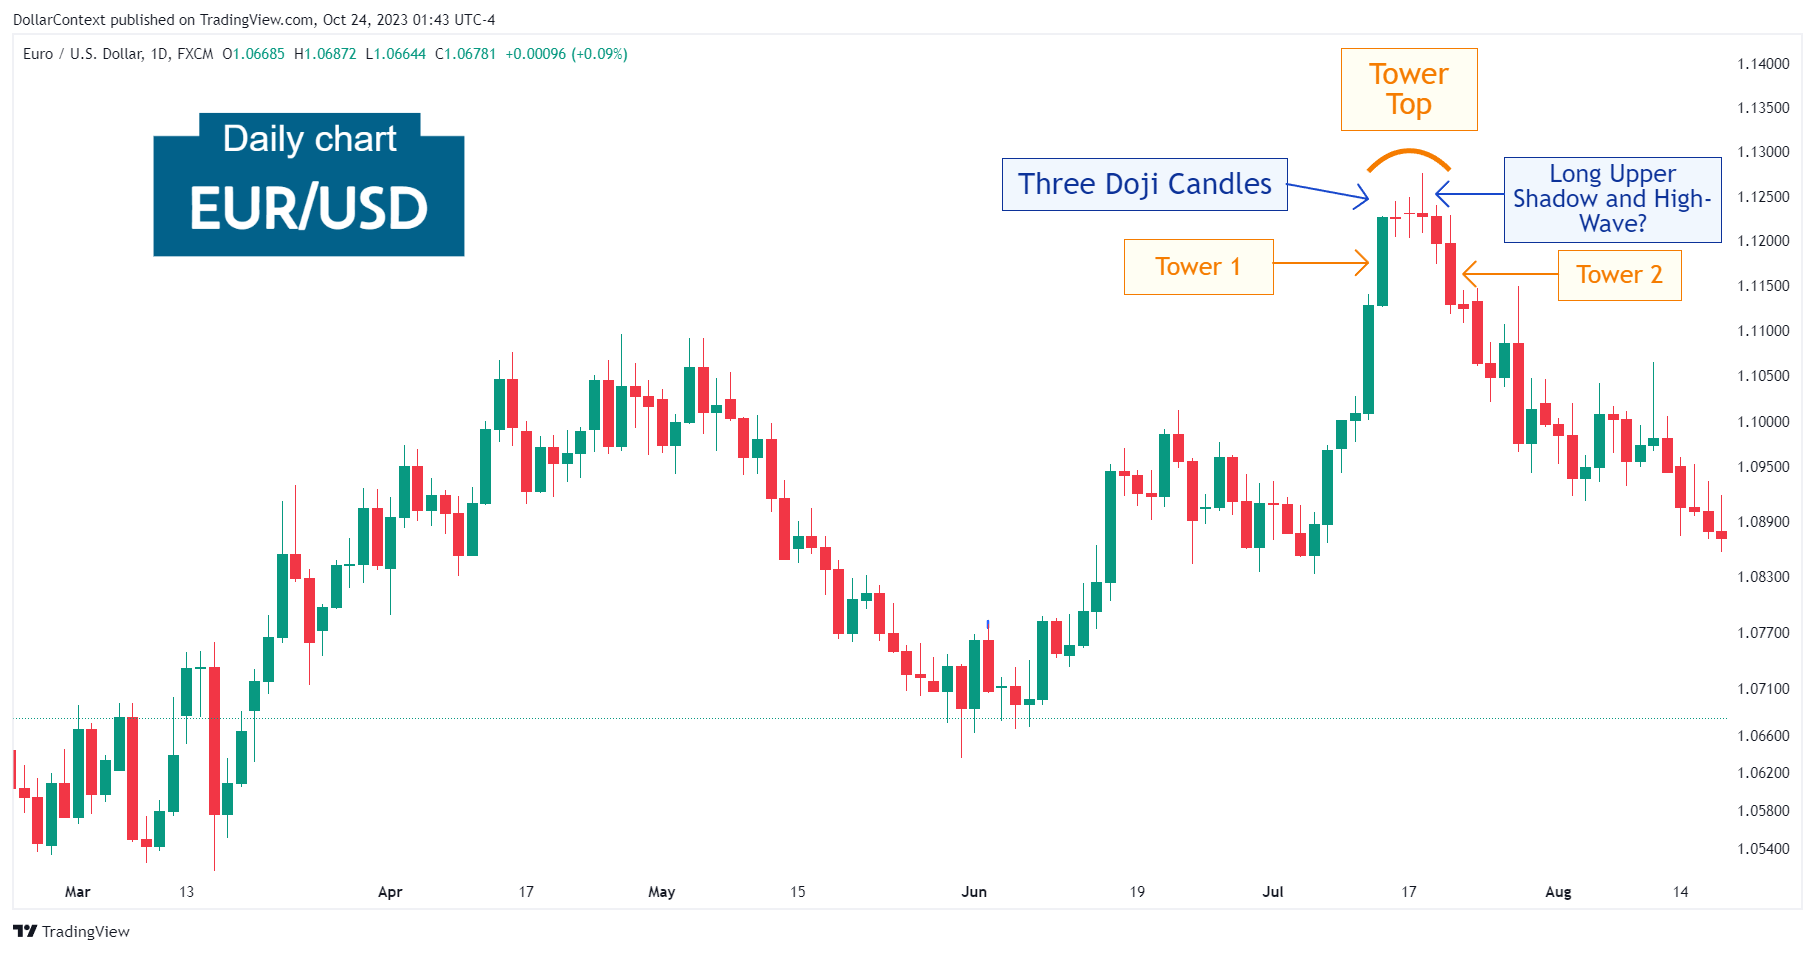
In the final stretch of an upward trend, the EUR/USD staged a steep move characterized by two consecutive tall green candles.
However, the bullish momentum faced a challenge with the appearance of three consecutive doji candles, which often foreshadow the end of a trend, particularly when they come after a large green candle. Observe that the third doji candlestick can also be viewed as a variation of a long upper shadow and even a high-wave.

2. Early Market Transition
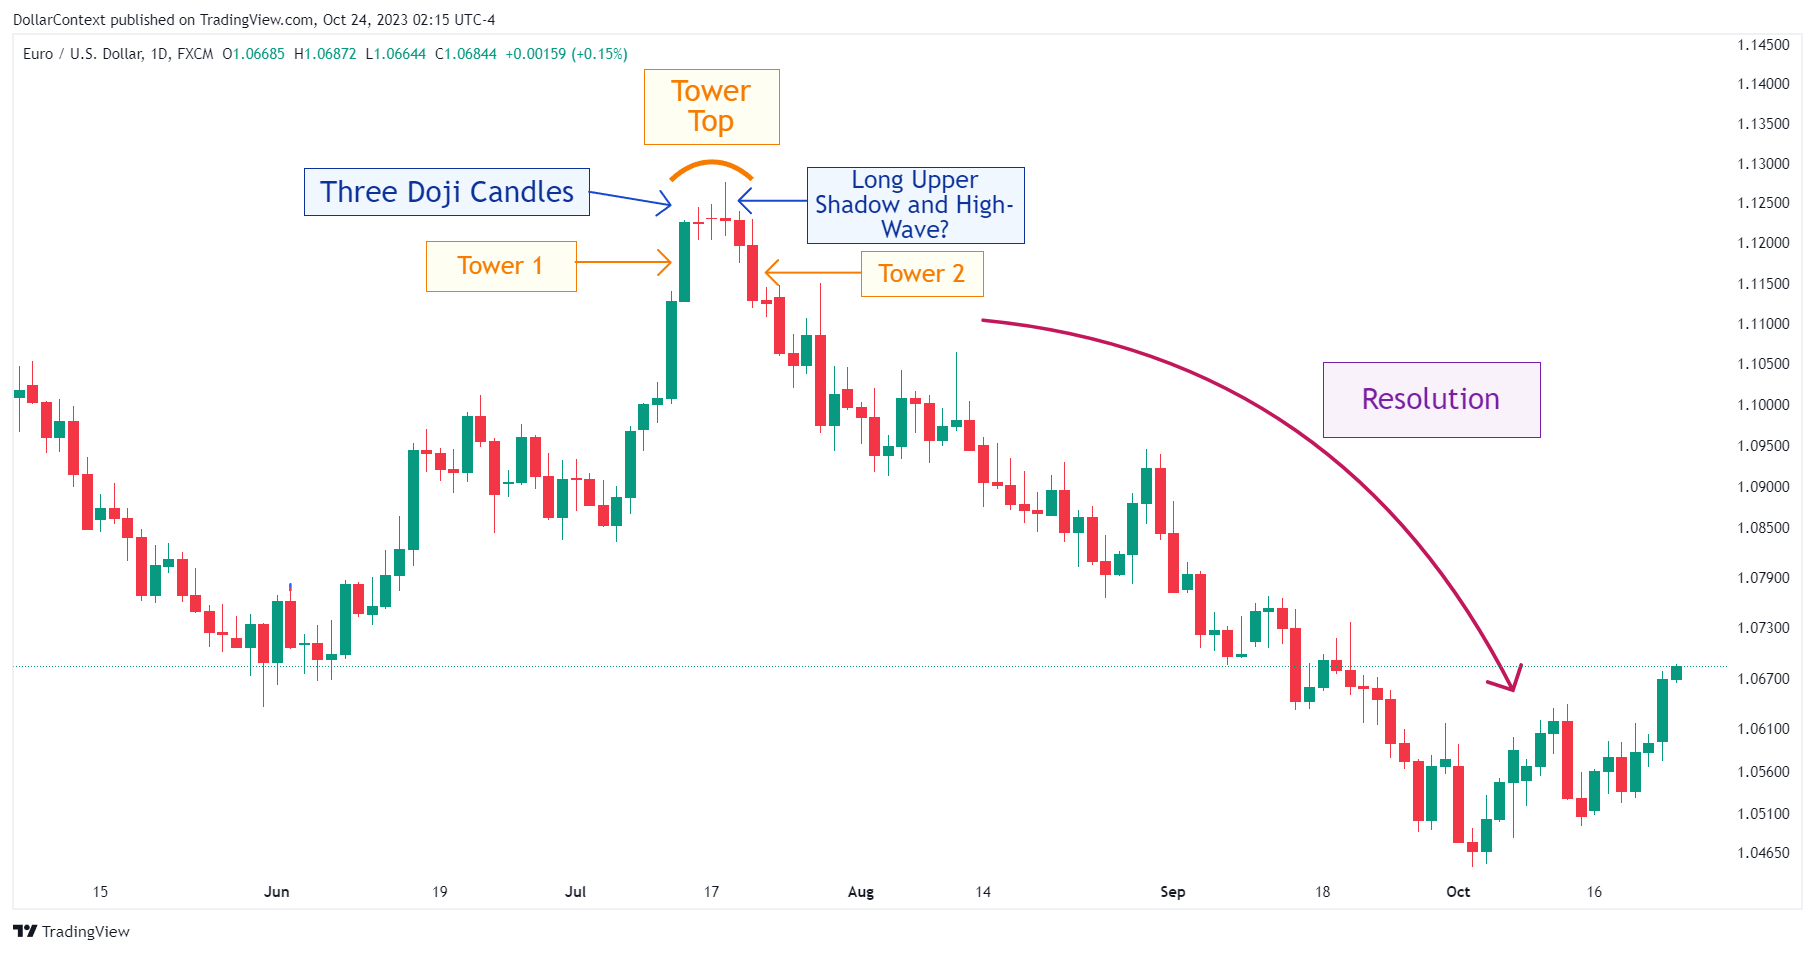
Two days after the doji sessions, the EUR/USD showcased a long red candle, completing a tower top formation.
How to recognize a tower top pattern? After a large green (or white) candlestick, there is a short-term lull. Then one or more large red candlesticks emerge. This creates a top with towers on both sides. That is, at least one long candlestick on the way up and one long candlestick on the way down.
3. Resolution
The tower top was succeeded by a prolonged and sharp downtrend that persisted for more than two months.
4. Conclusion and Subjective Review
It's interesting how the confluence of a wide range of candlestick patterns concentrated within a short space of time may signal such an impressive top reversal and the subsequent extended downward trend.
Also, it's worth noting the multifaceted nature of some of the candlesticks involved near the peak of the previous trend:
- On one hand, the third doji session could be interpreted as a high-wave or a long upper shadow. Arguably, it could also be viewed as a variation of the shooting star pattern.
- On the other hand, all these doji candlesticks collectively formed part of a larger multi-session pattern: the tower top.


