Case Study 0012: A Small High-Wave After a Market Nosedive (DXY)
In this article, we will discuss the performance of the DXY after the market plunge in mid-July 2023.

Data Sheet
- Reference: CS0012
- Security: U.S. Dollar Index (DXY)
- Timeframe: Daily Chart (July 18, 2023)
- Patterns:
- High-Wave
- Spring
1. Signal Formation
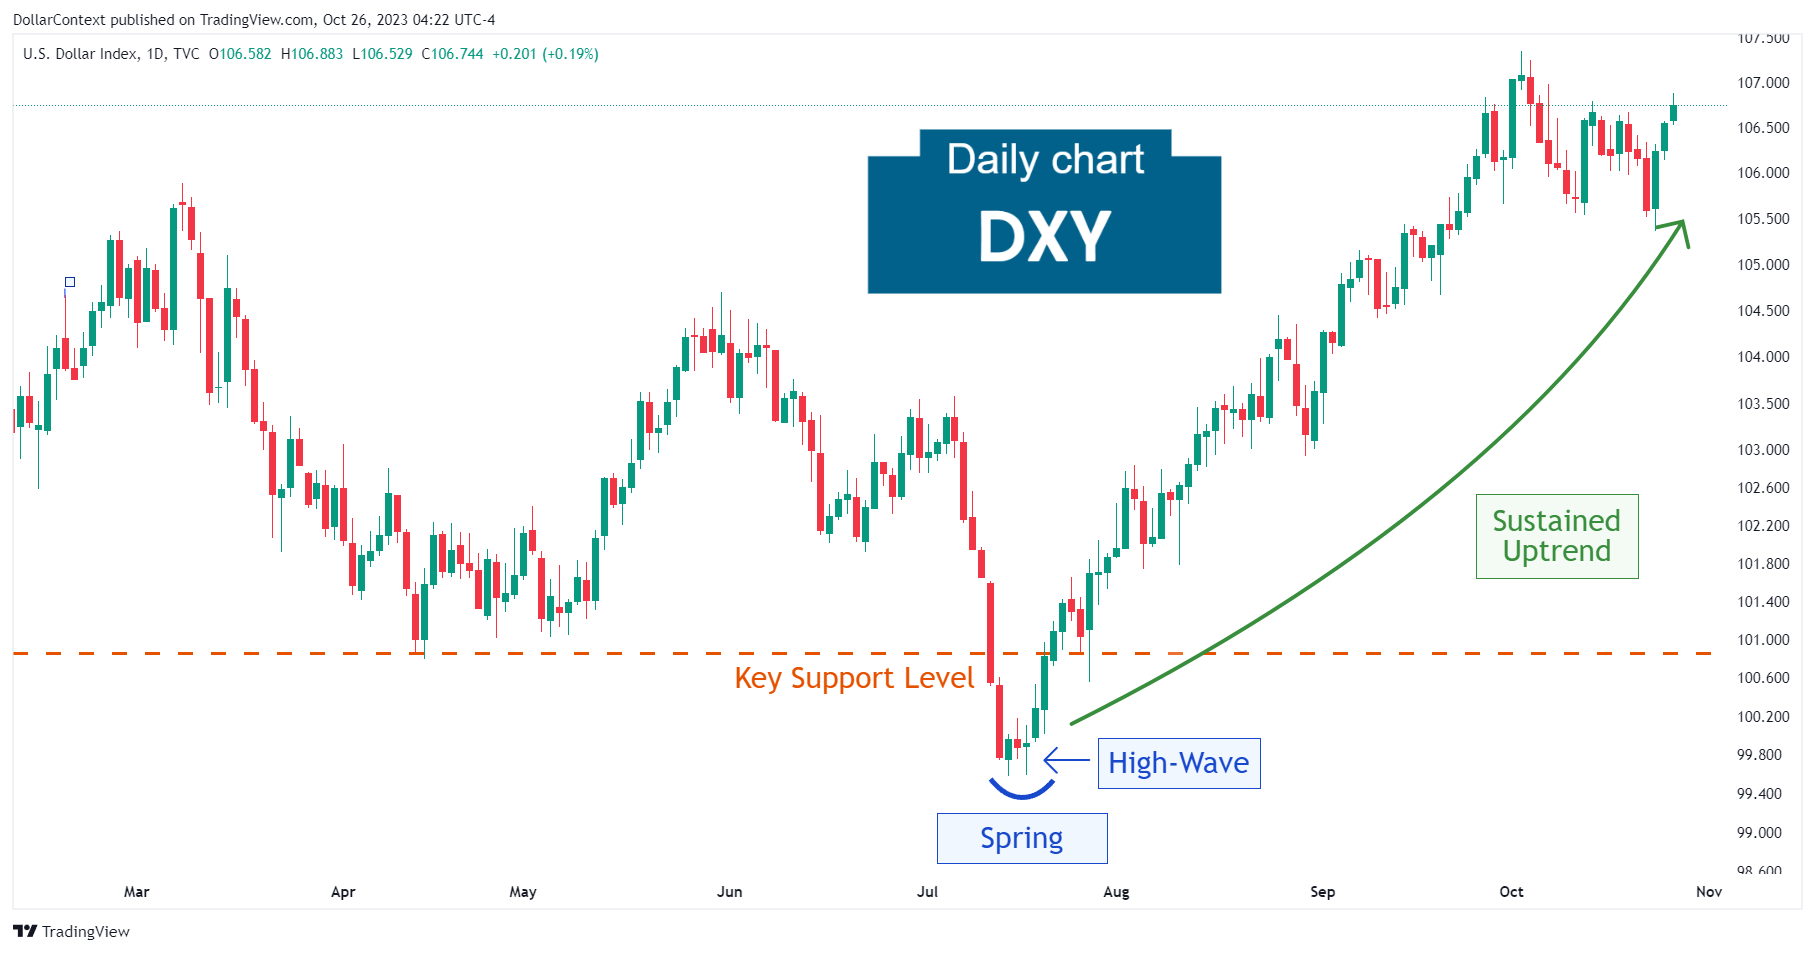
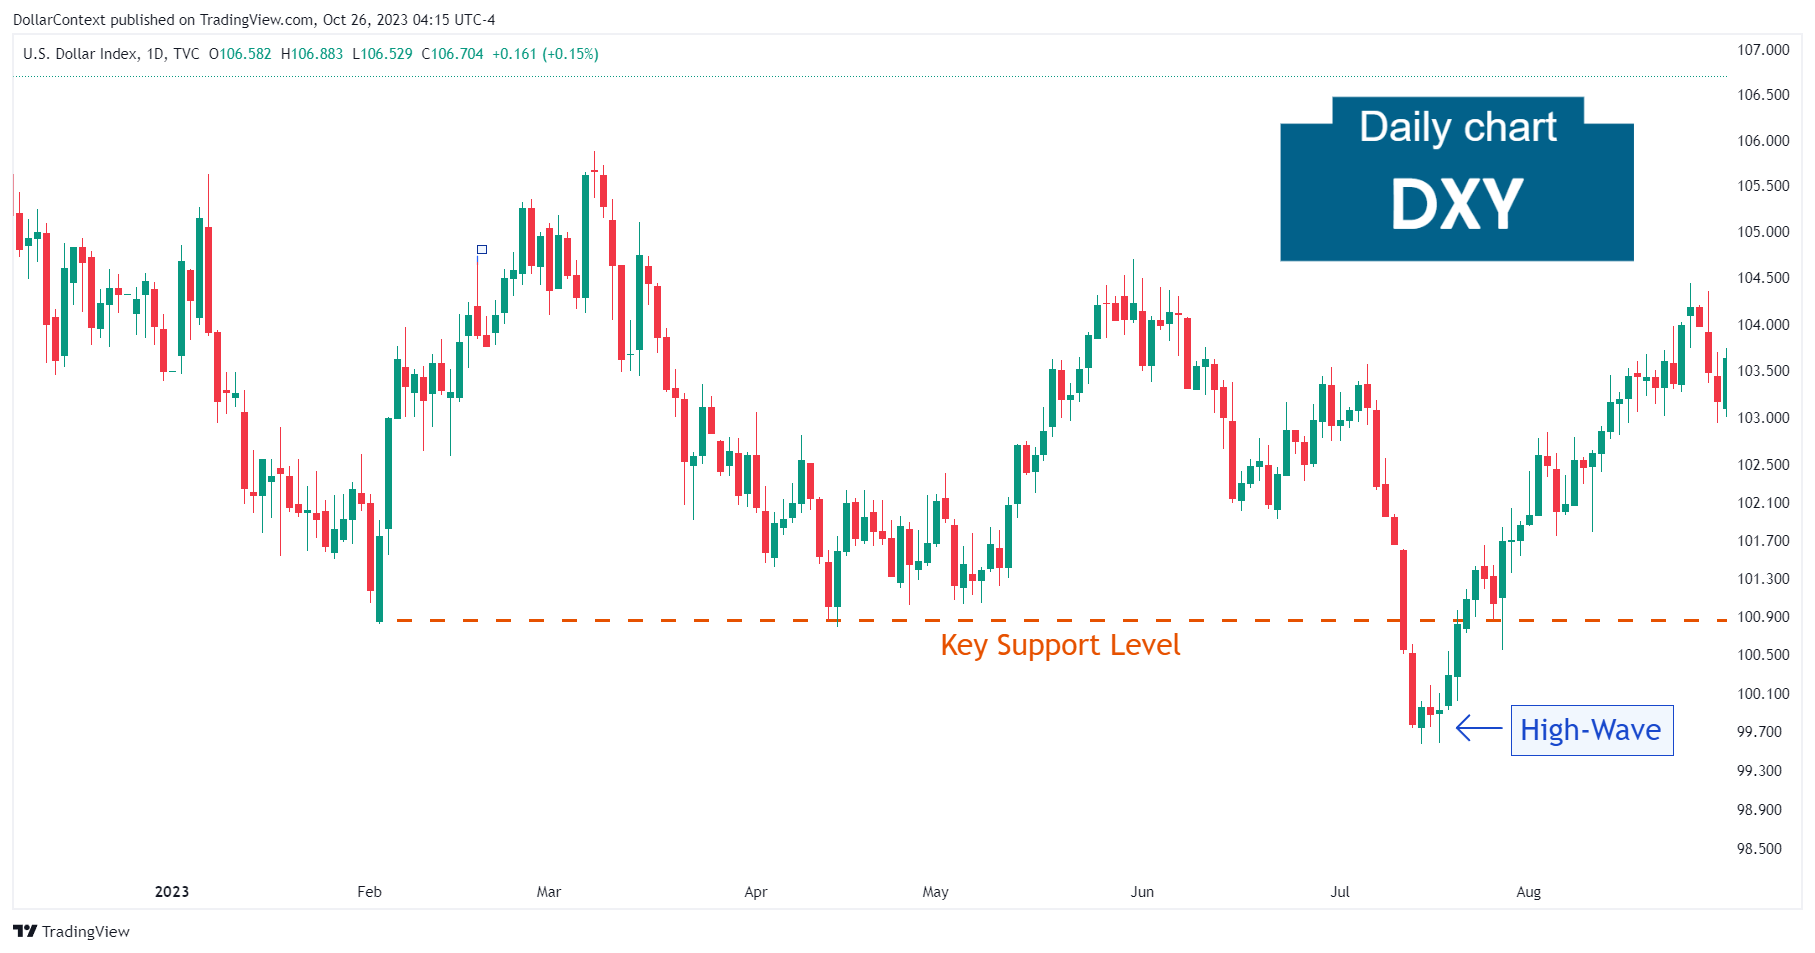
After an extended downtrend that began in October 2022, the U.S. Dollar Index displayed a horizontal correction from February to June 2023. The market then experienced a meltdown in July, breaking through the support level near the 100.8 mark.
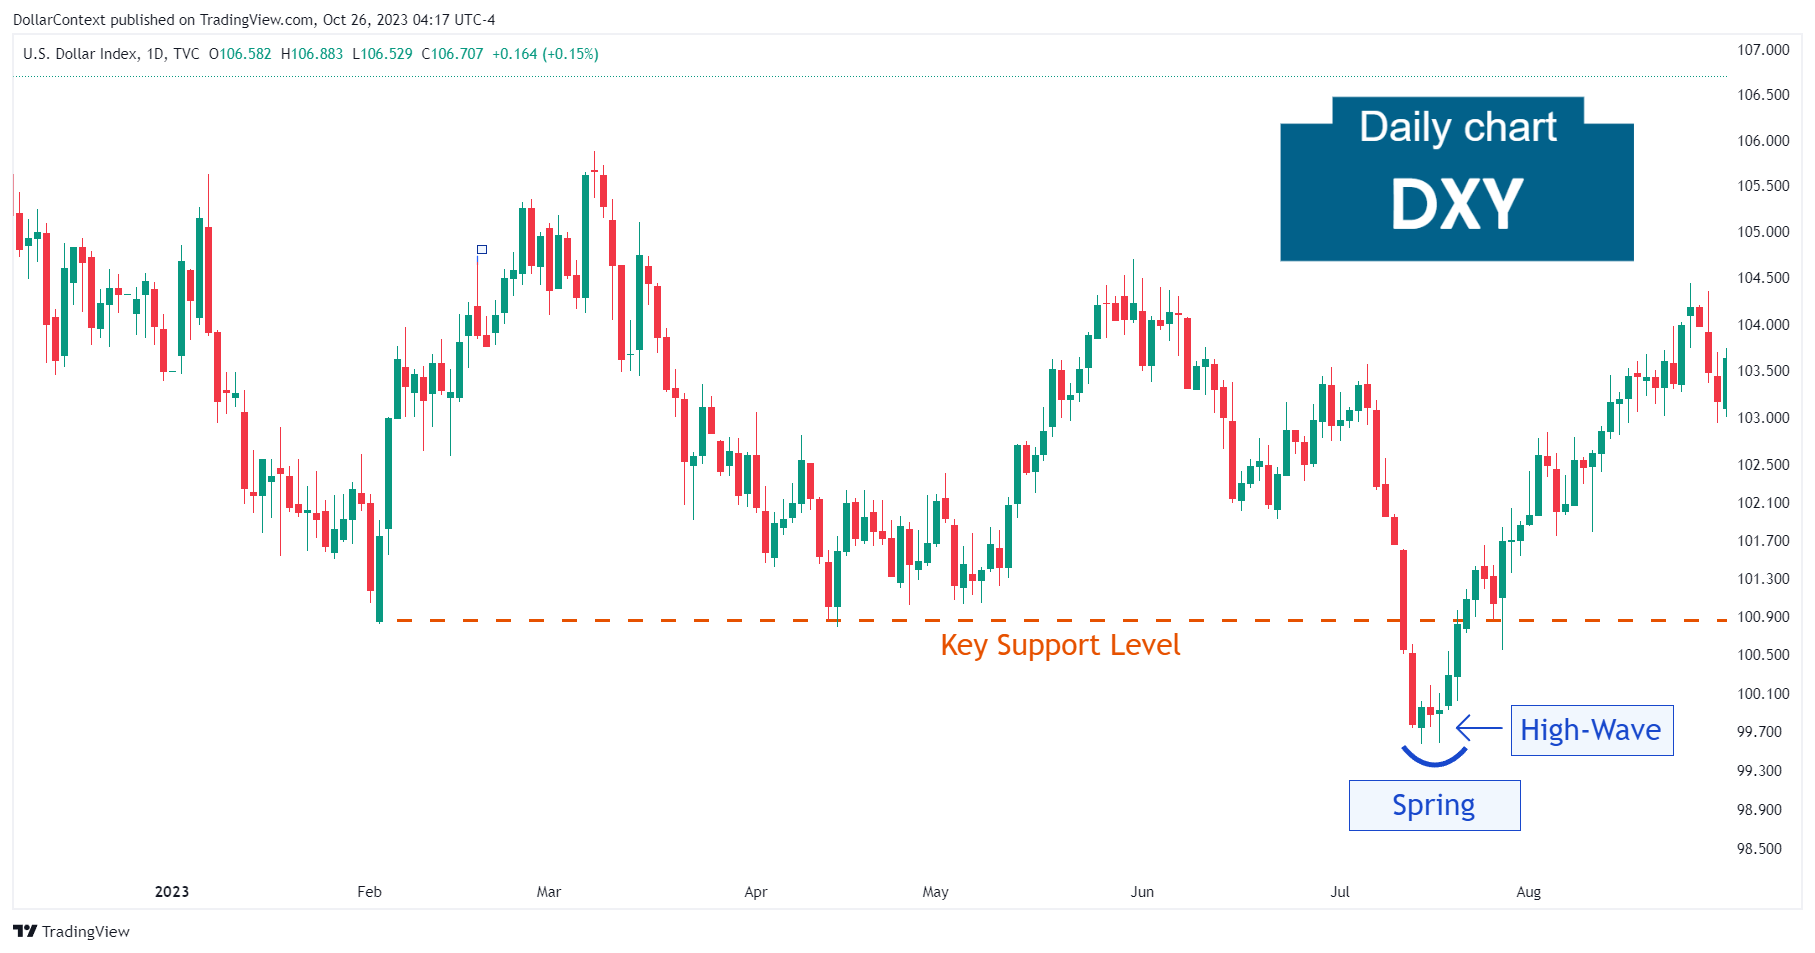
Rather than reinforcing the downturn, the downward momentum began to wane, as evidenced by two small-bodied sessions followed by a small high-wave candle.

2. Early Market Transition
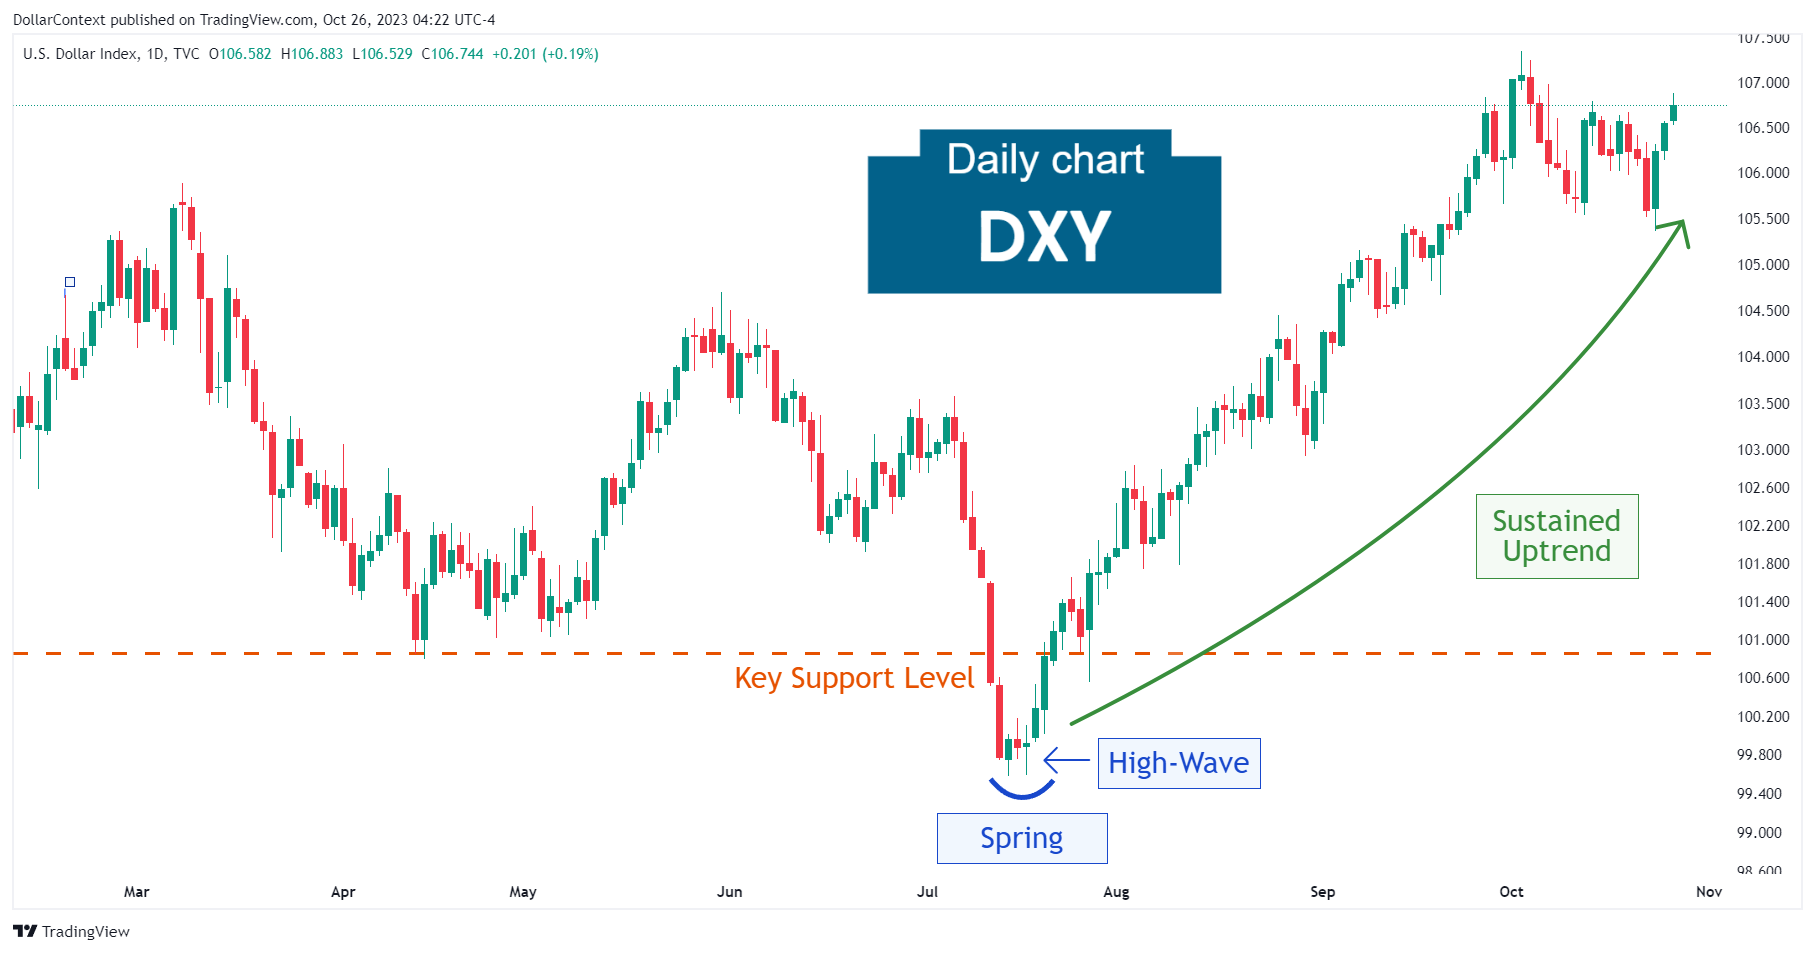
Eventually, the DXY reversed and started to move back in the opposite direction. This false breakout of the key support level can be described as a spring.

3. Resolution
The high-wave session and the subsequent spring was succeeded by an extended and pronounced uptrend that persisted for more than three months.

4. Conclusion and Subjective Review
Interestingly enough, a small high-wave candlestick in the DXY chart marked the end of a prolonged downtrend and the beginning of a significant bull market.
In a situation like this, the focus should not solely be on the high-wave candlestick. Instead, the critical elements to consider are the preceding market collapse and the subsequent rebound, especially after an overextended and mature downtrend. These factors could act as vital guides for future trading conditions.
However, if a similar scenario unfolds during the early stages of a downtrend, the chances of the market reaching a turning point are significantly lower.


