
Case Study 0015: Dark Cloud Cover and Shooting Star Herald the End of a Correction (S&P 500)
In this article, we will cover the performance of the S&P 500 after the emergence of a dark cloud cover and a shooting star.

Data Sheet
- Reference: CS0015
- Security: S&P 500
- Timeframe: Hourly Chart (October 23, 2023)
- Patterns:
- Dark Cloud Cover
- Shooting Star
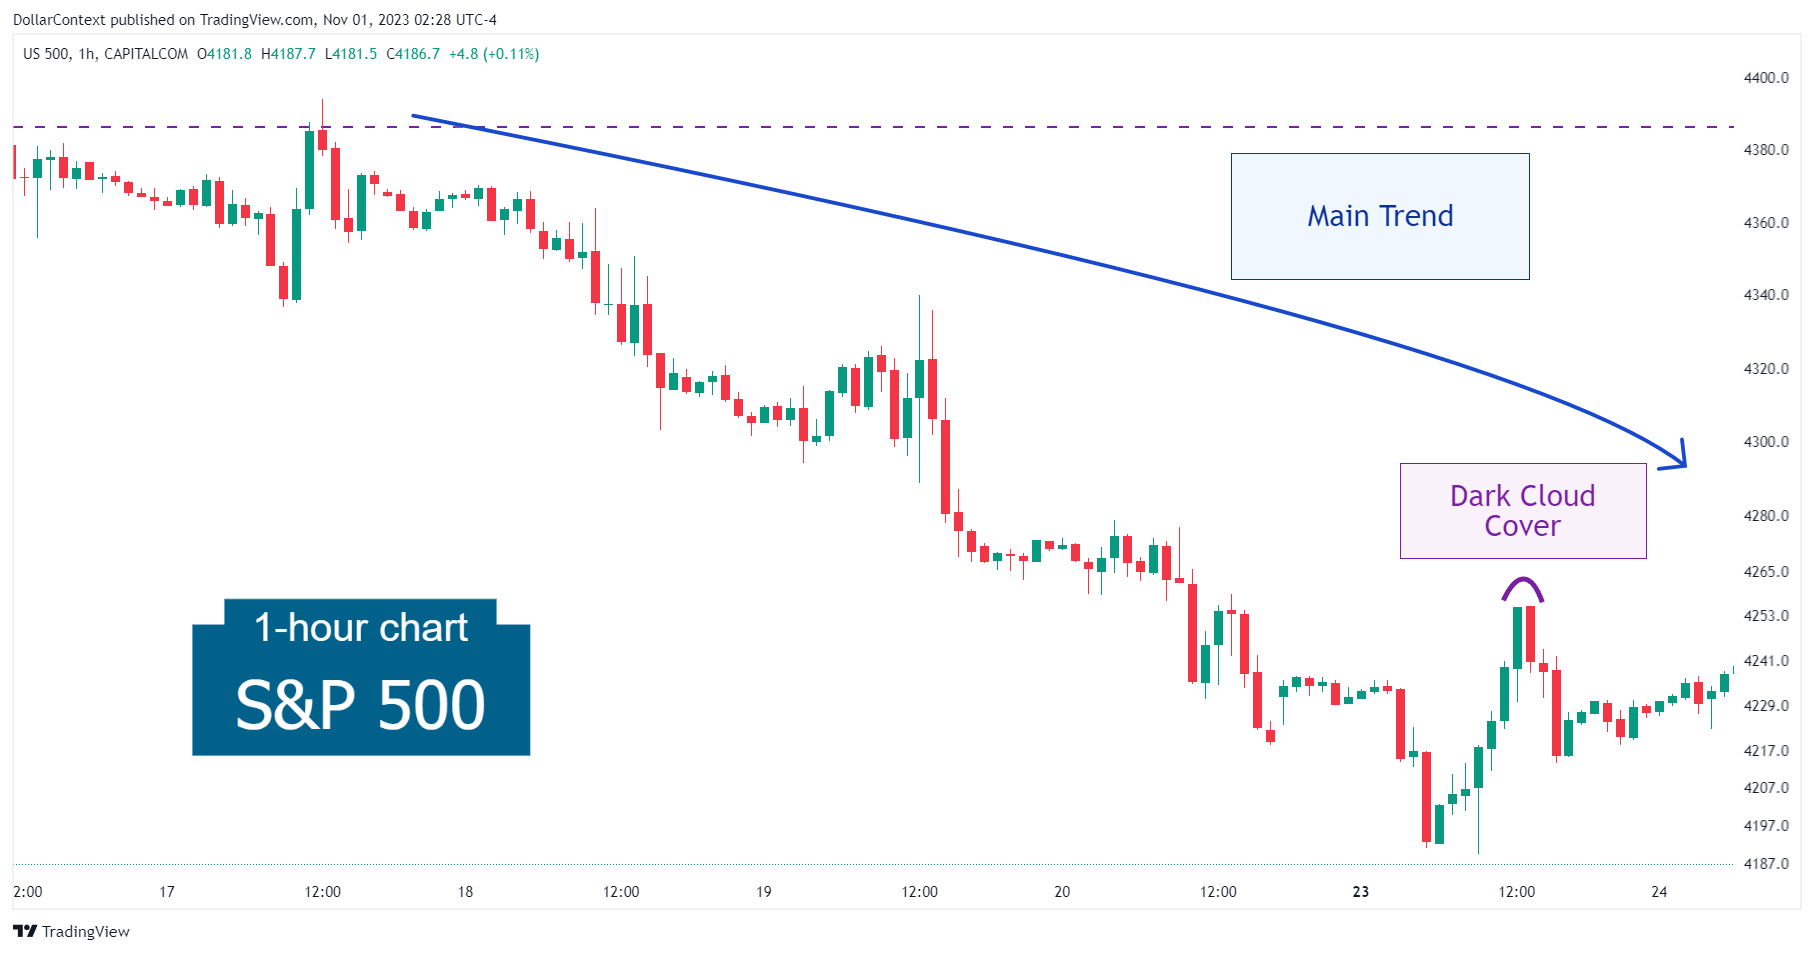
1. Signal Formation
As part of an overarching downtrend, the S&P 500 initiated a rally that was quickly halted by a dark cloud cover pattern near the 4,253 mark.
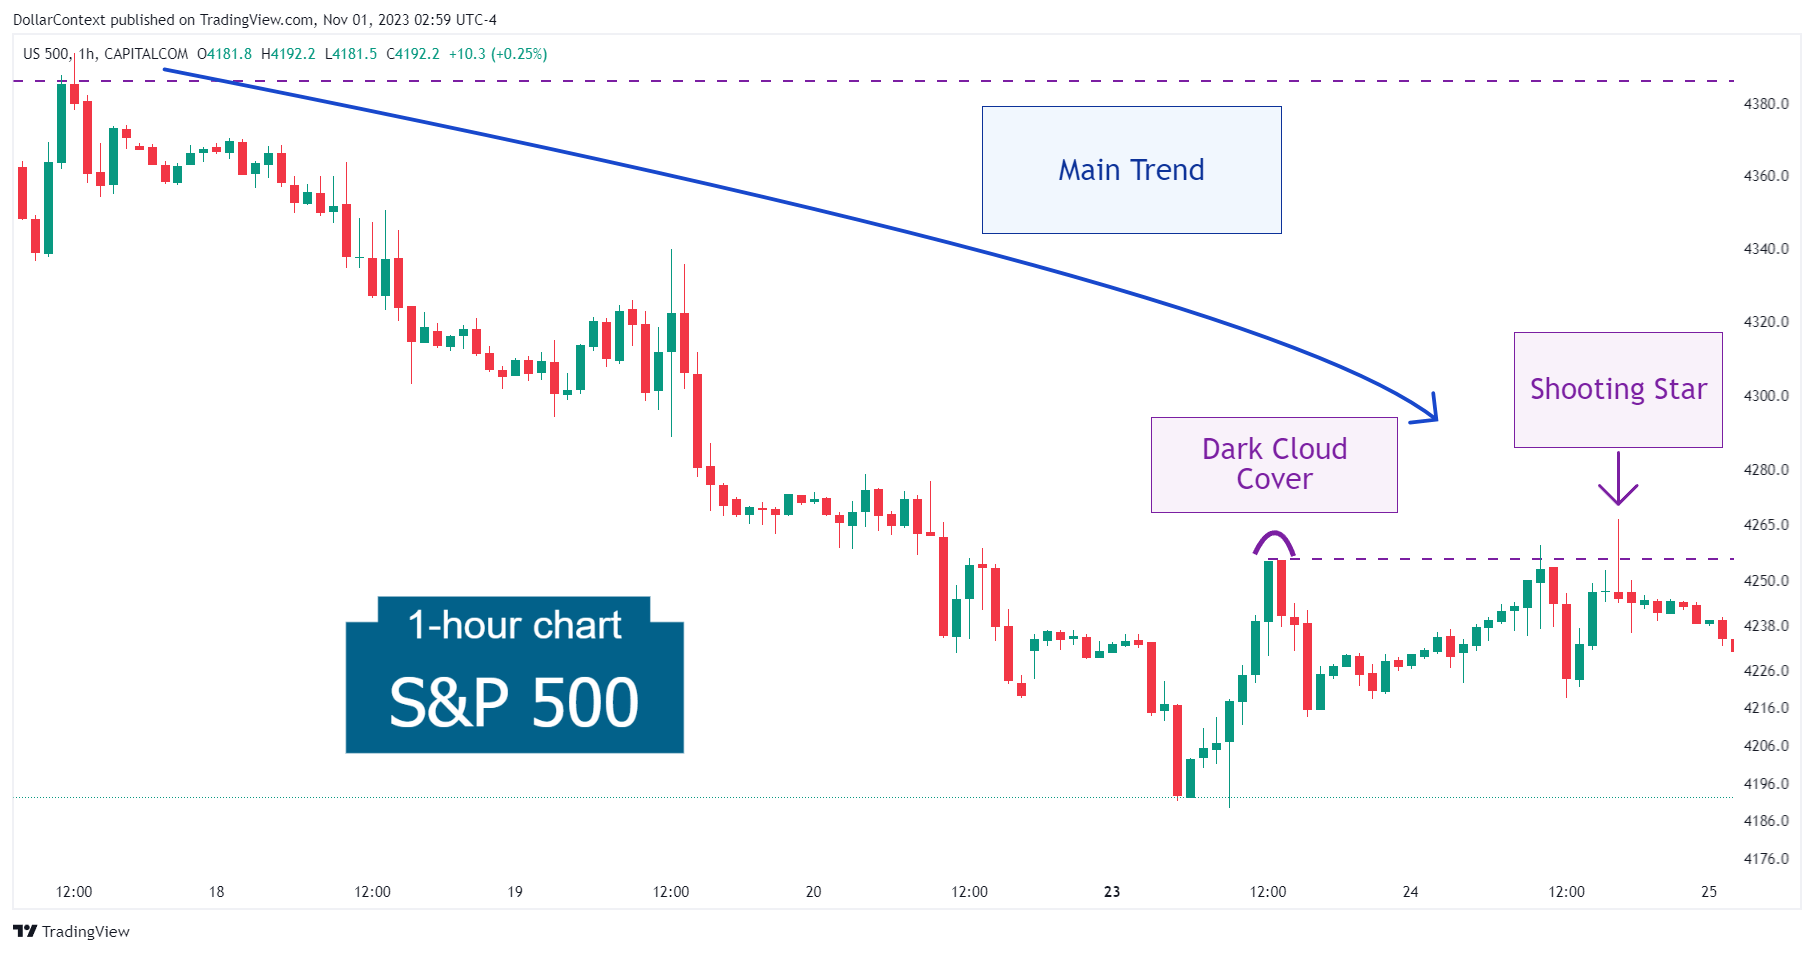
2. Early Market Transition
Following the dark cloud cover, the S&P 500 challenged the resistance area set by this pattern twice, with the second test manifesting as a shooting star.
The appearance of a shooting star near the peak levels set by the dark cloud cover serves as a critical indicator, signaling both the likely conclusion of the rally and the continuation of the primary downtrend.
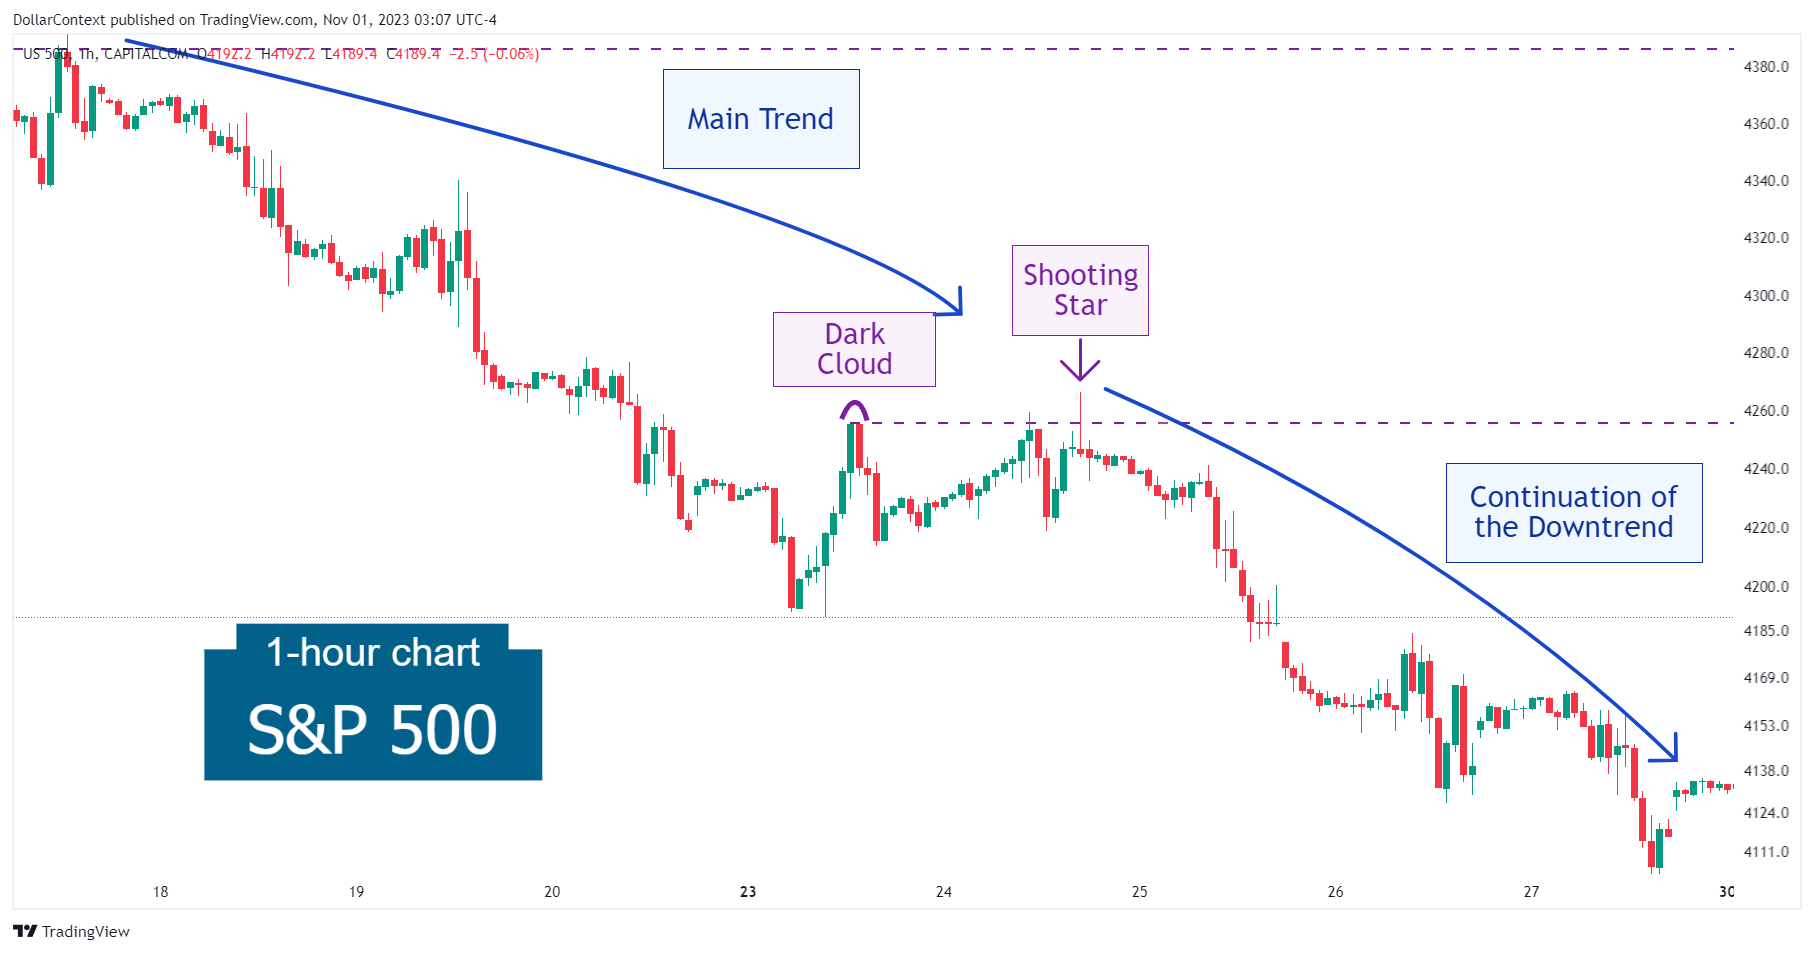
3. Resolution
As the decline effectively broke past the previous lows, the S&P 500 confirmed the end of the correction and the persistence of the downward trend.

4. Conclusion and Subjective Review
Reversal candlestick formations, such as the dark cloud cover, can also serve to signal the end of a corrective phase within a larger trend. A scenario like this is often confusing for traders since a reversal pattern typically requires a defined previous trend to reverse. In this case, however, the appearance of a second bearish reversal signal, the shooting star, helped confirm this narrative.


