
Case Study 0018: Dark Cloud Cover and Hanging Man After a Sharp Ascent (USD/JPY)
After a sharp rise of approximately 1.8 percent within an 18-hour timeframe, the USD/JPY presented a dark cloud cover and a hanging man candle line.

Data Sheet
- Reference: CS0018
- Security: USD/JPY
- Timeframe: Hourly Chart (October 31, 2023)
- Patterns:
- Dark Cloud Cover
- Hanging Man
- High-Wave
1. Signal Formation
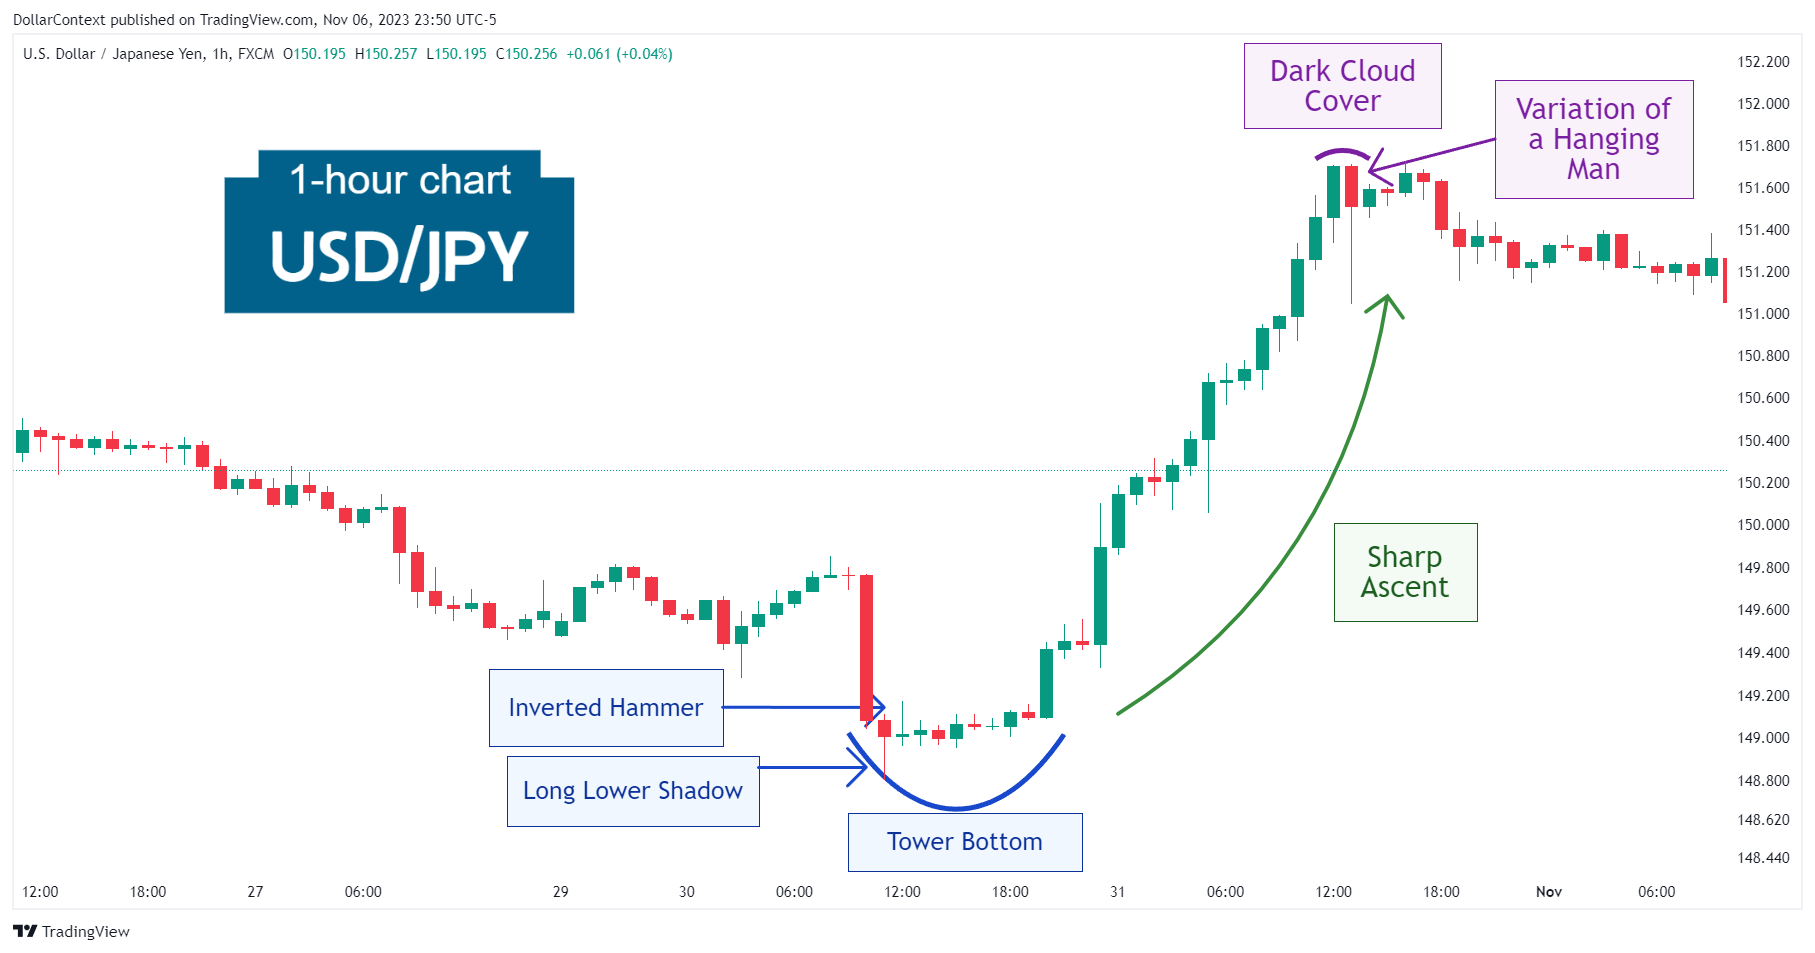
Following a series of candlestick patterns indicated in blue below and examined in case study 0016, the USD/JPY saw a remarkable ascent in a short period of time in October 2023.
After a sharp rise of approximately 1.8 percent within an 18-hour timeframe, the first significant bearish candle made its appearance on the chart. This red candlestick presents a dual interpretation since it could be viewed as:
- The Second Candle of a Dark Cloud Cover: Observe that the preceding session featured a sizable green candle and the second candle's body penetrates deeply into the first one, forming a dark cloud cover. It's not, however, a classic dark cloud cover because the closing price of the second candle is not near its lows.
- A Variation of the Hanging Man: The textbook version of the hanging man pattern typically features a shorter real body than what is shown in the chart below. This is why we qualify it as a variation. An important characteristic of the hanging man is that there should be bearish confirmation. A method of bearish confirmation is to wait to see if the market closes under the hanging man's real body. This is what unfolded five trading sessions later.
2. Early Market Transition
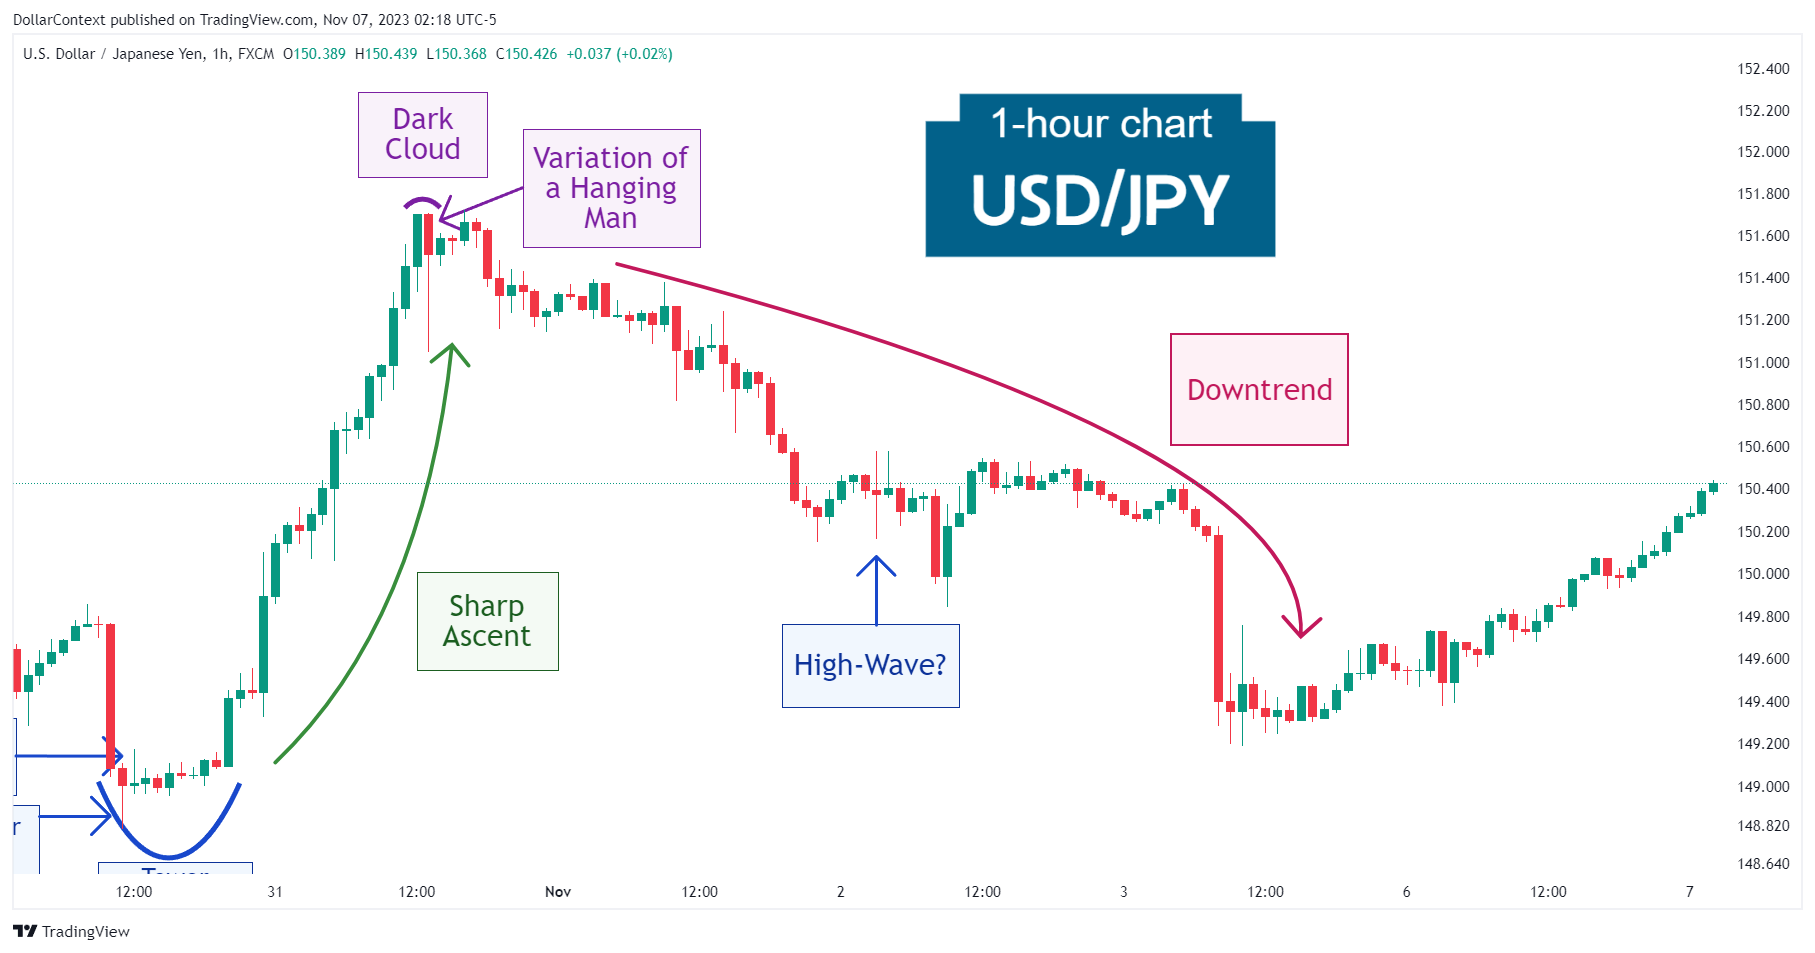
The chart above illustrates that before initiating the decline, the market experienced a successful test of the resistance level set by both the dark cloud cover and the hanging man.
3. Resolution
Following the top reversal, the market entered a discernible downtrend. We'll add here that during this downward movement, a high-wave candle appeared, signaling caution. Nevertheless, this signal was not validated, as there was no subsequent close above the high-wave candle's peak.

4. Conclusion and Subjective Review
The confluence of two reversal patterns within a brief span, especially after a steep upward move, should be viewed as a potential bearish situation that should be taken seriously.
This scenario unfolded with the USD/JPY in October 2023 as two candlestick patterns marked the end of the previous rally and the beginning of a downtrend.


