
Case Study 0019: Long Upper Shadow and Shooting Star (AUD/USD)
In this article, we will cover the performance of the AUD/USD after the emergence of a long upper shadow and an evening star pattern.

Data Sheet
- Reference: CS0019
- Security: AUD/USD
- Timeframe: Daily Chart (April 05, 2022)
- Patterns:
- Spinning Tops
- Long Upper Shadow
- Shooting Star
- Evening Star
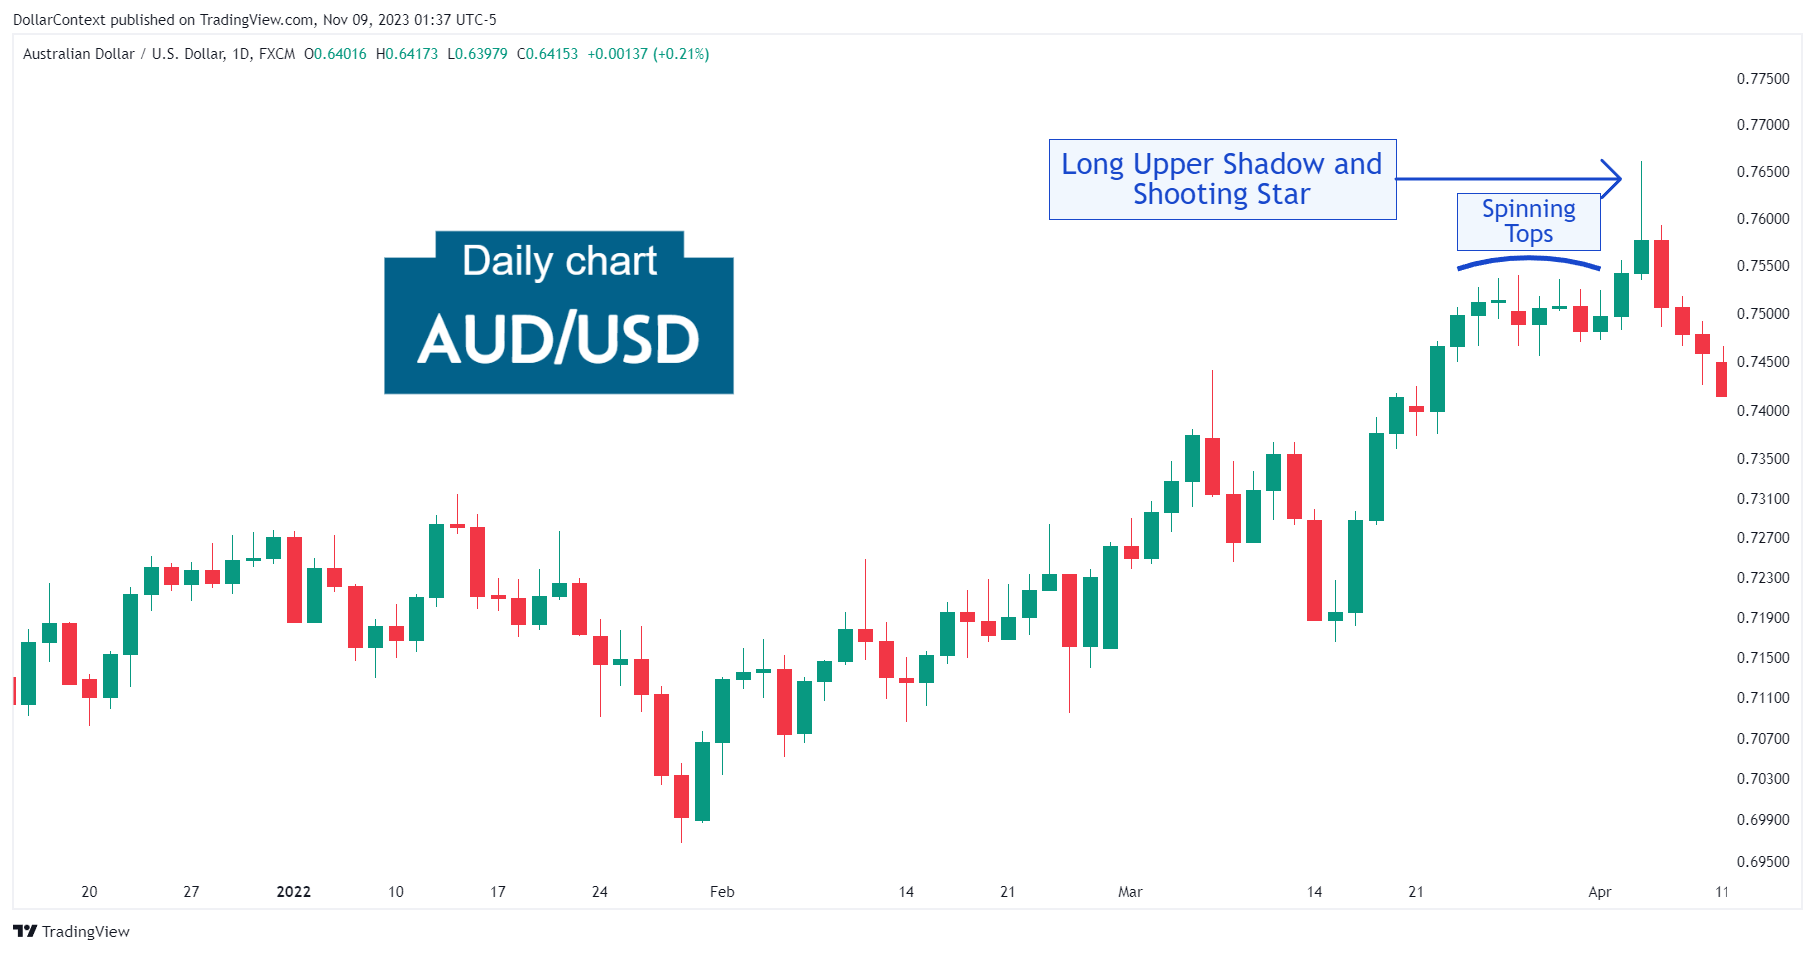
1. Signal Formation
The rally that began in February 2022 gave its first sign of peaking with a series of spinning tops in late March 2022. Then the market displayed an upward move characterized by a green candle followed by a long upper shadow session. Since this upper shadow is basically twice the length of the real body, we can also classify this candle as a variation of the shooting star pattern. Be aware that the more traditional shooting stars exhibits a smaller real body.
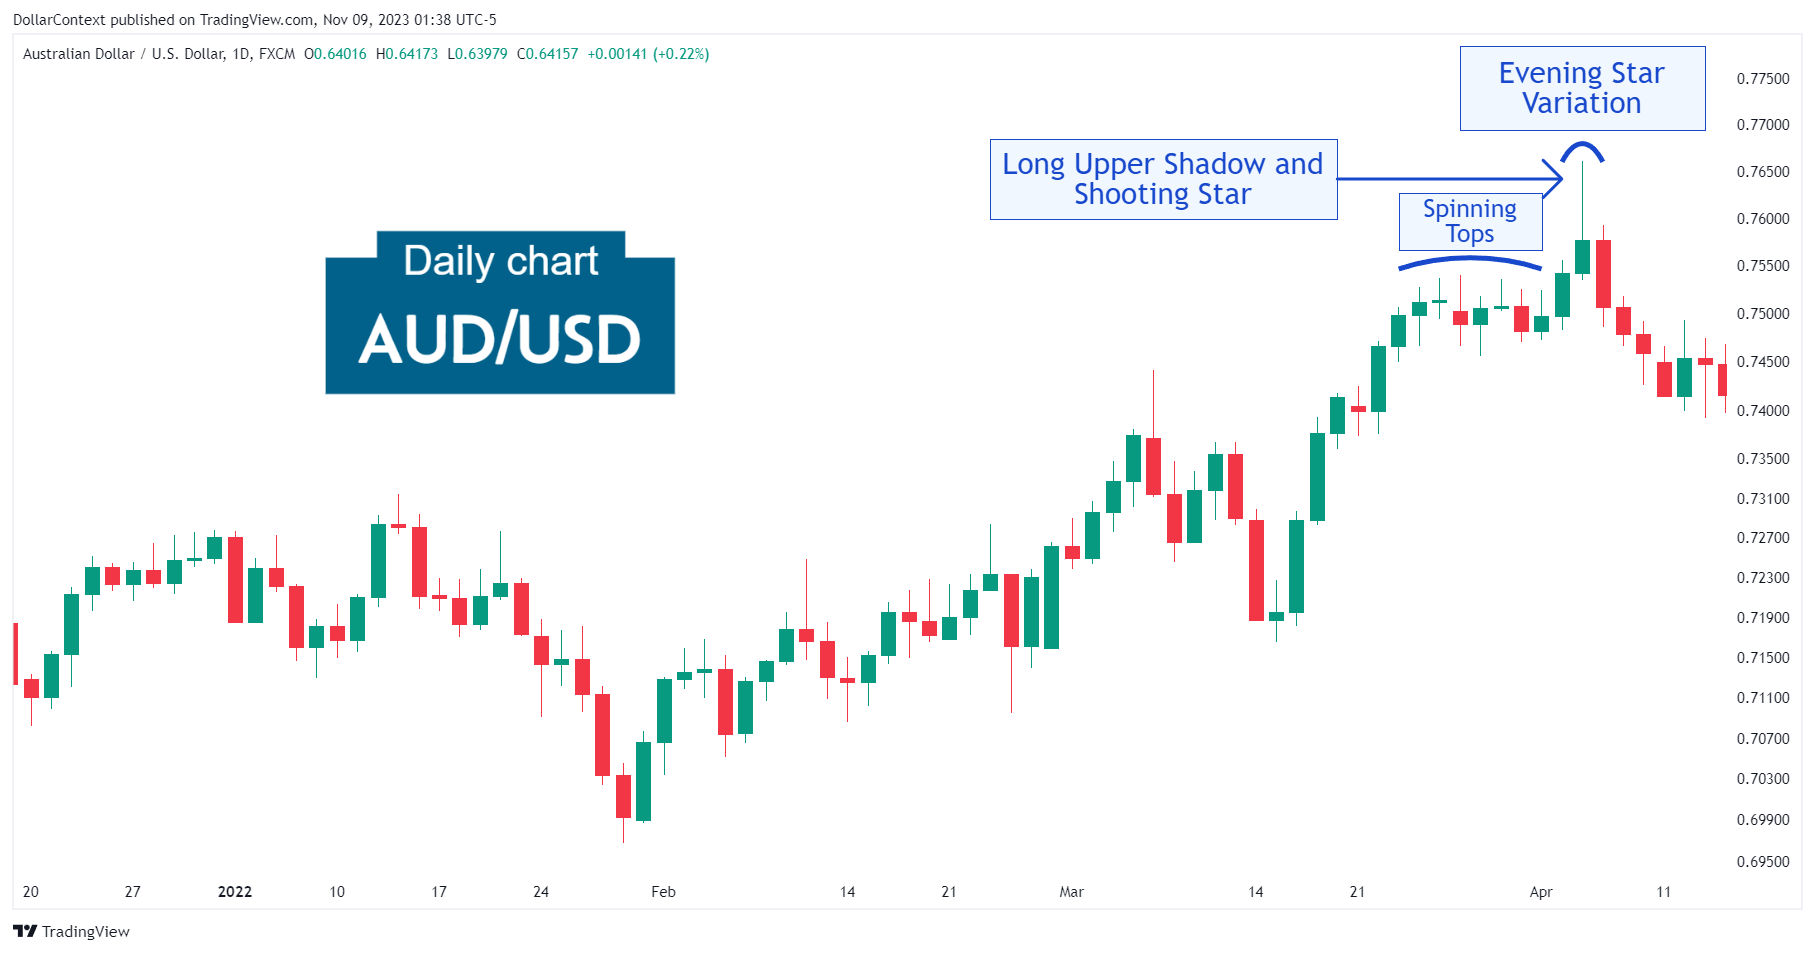
2. Early Market Transition
Following the long upper shadow candlestick, the AUD/USD pair printed a large bearish candle. The resulting three-candle combination could be viewed, arguably, as a variation of the evening star pattern.
A classic evening star consists of a large bullish candle followed by a small-bodied candle that gaps higher, and a large bearish candle that closes into the body of the first candle. The evening star highlighted below, while being a less-than-perfect version of this pattern, still presents its bearish implications as indicated by the arrangement of the three candlesticks.
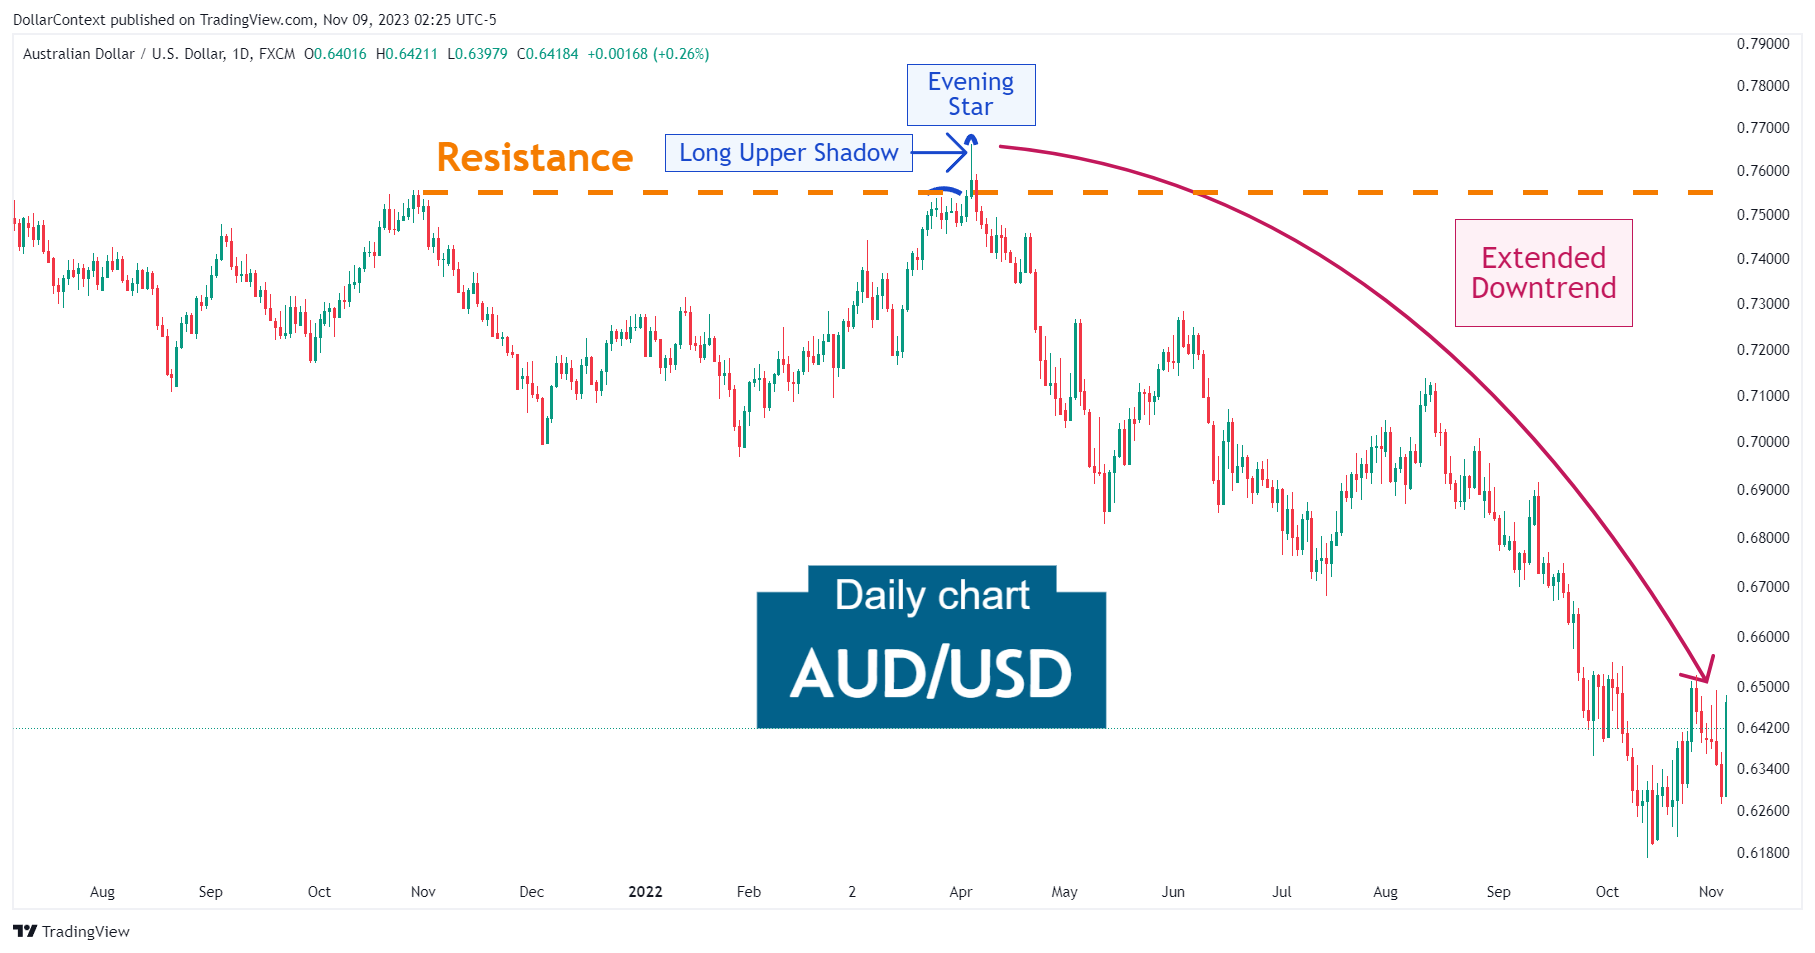
3. Resolution
The convergence of the reversal patterns noted above was followed by a prolonged downtrend of the pair of almost 20 percent.
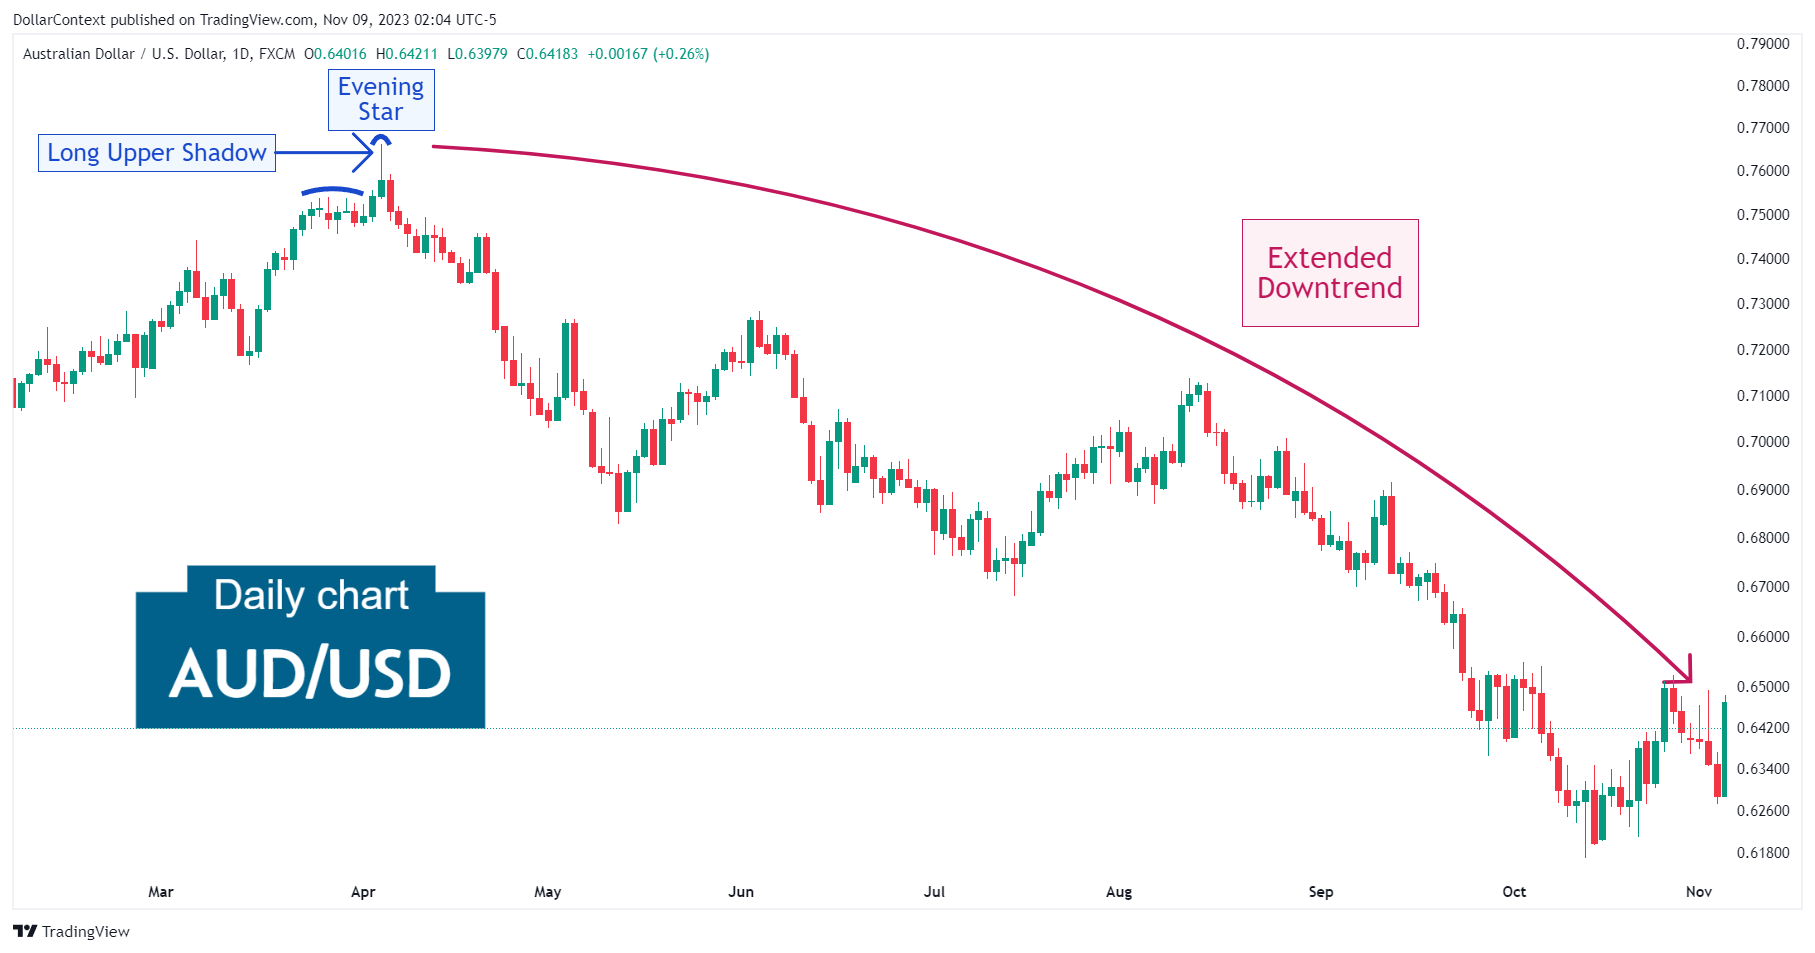
4. Conclusion and Subjective Review
One should not underestimate the potential of variations (suboptimal versions of a candlestick pattern). They can provide important clues about the state of the market, especially when several of them converge in a short period of time and/or appear in the vicinity of resistance zones.
When you zoom out from the earlier chart, it becomes apparent that the reversal signals appeared within a notably significant resistance area.


