
Case Study 0021: Spinning Tops, Dark Cloud Cover, and Long Red Real Body (AUD/USD)
In this article, we will cover the performance of the AUD/USD after the emergence of a long upper shadow and a dark cloud cover.

Data Sheet
- Reference: CS0021
- Security: AUD/USD
- Timeframe: Daily Chart (February 02, 2023)
- Patterns:
- Long Upper Shadow
- Spinning Top
- Dark Cloud Cover
- Long Red Real Body
- Tower Top (Ineffective)
1. Signal Formation
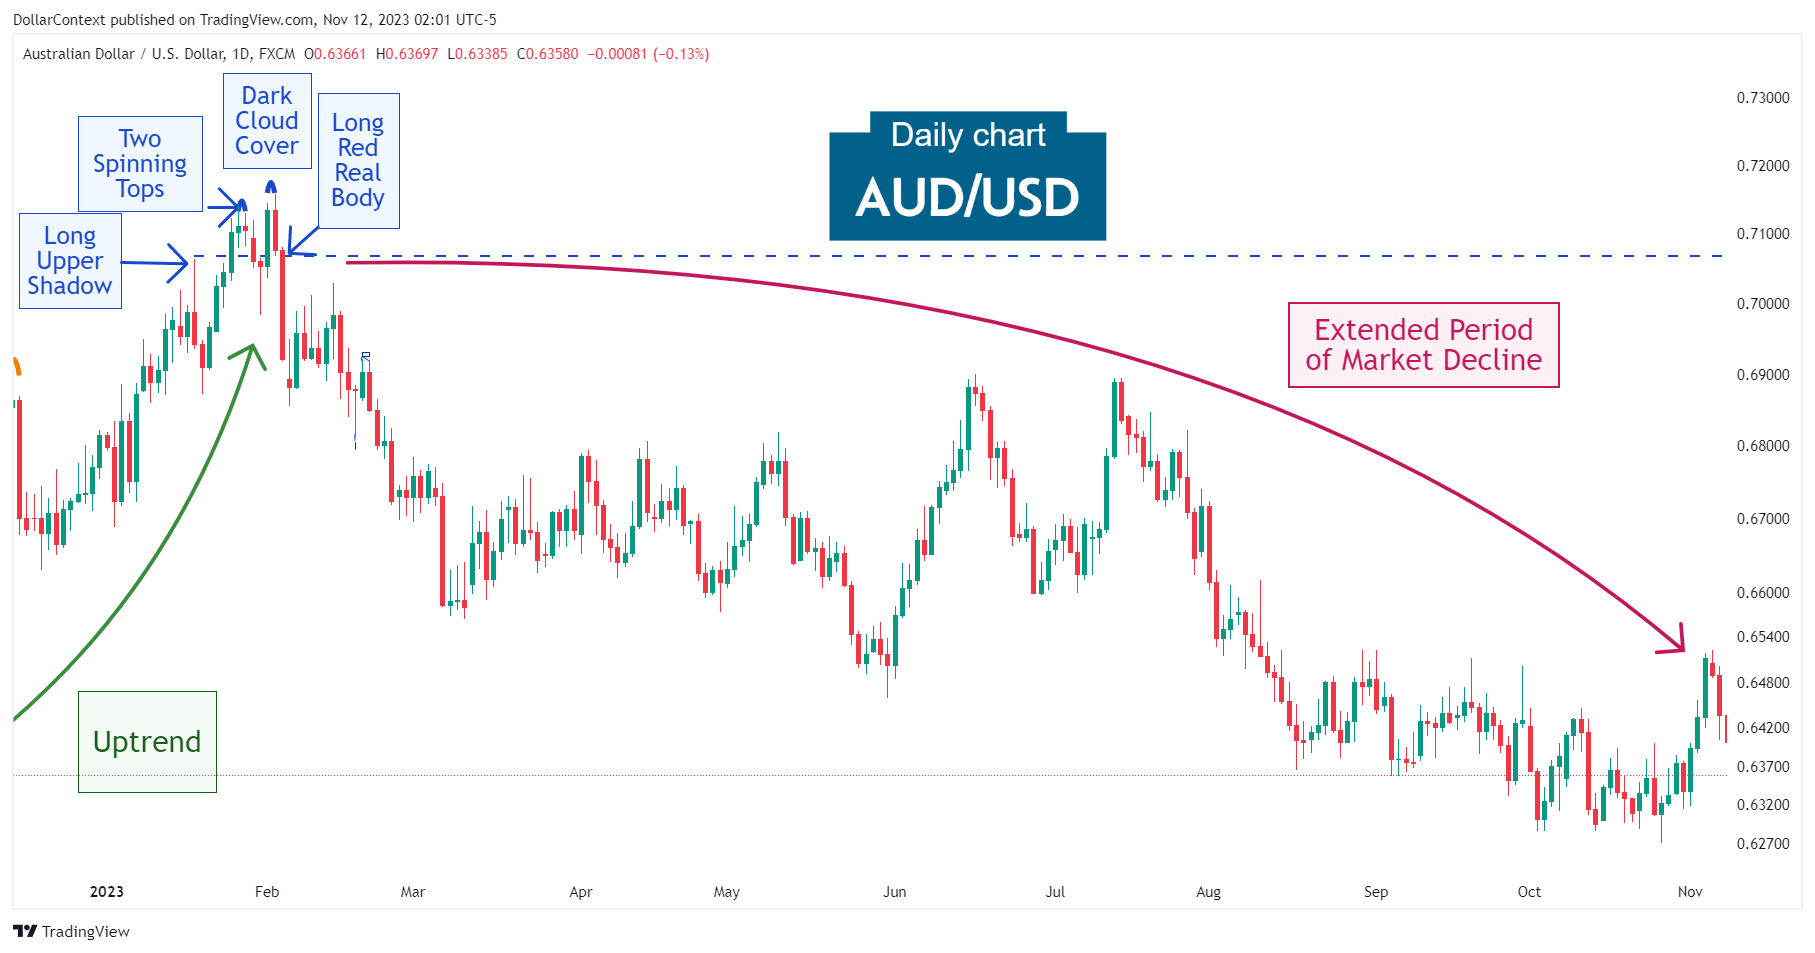
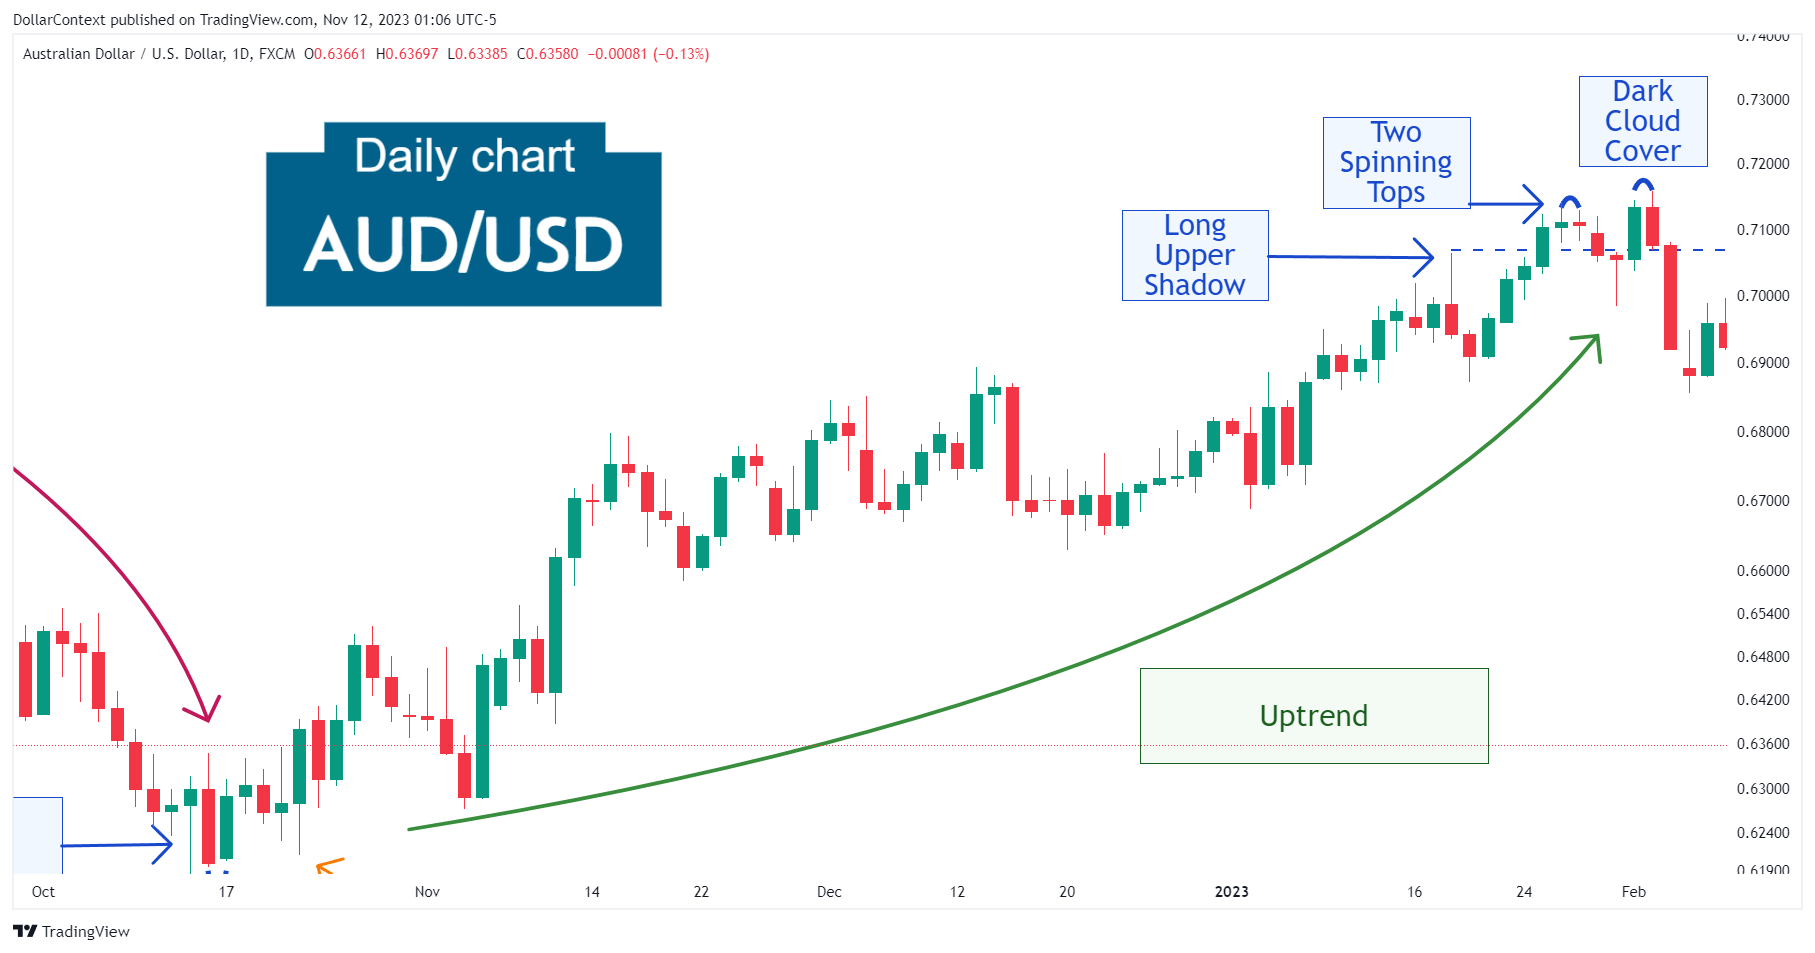
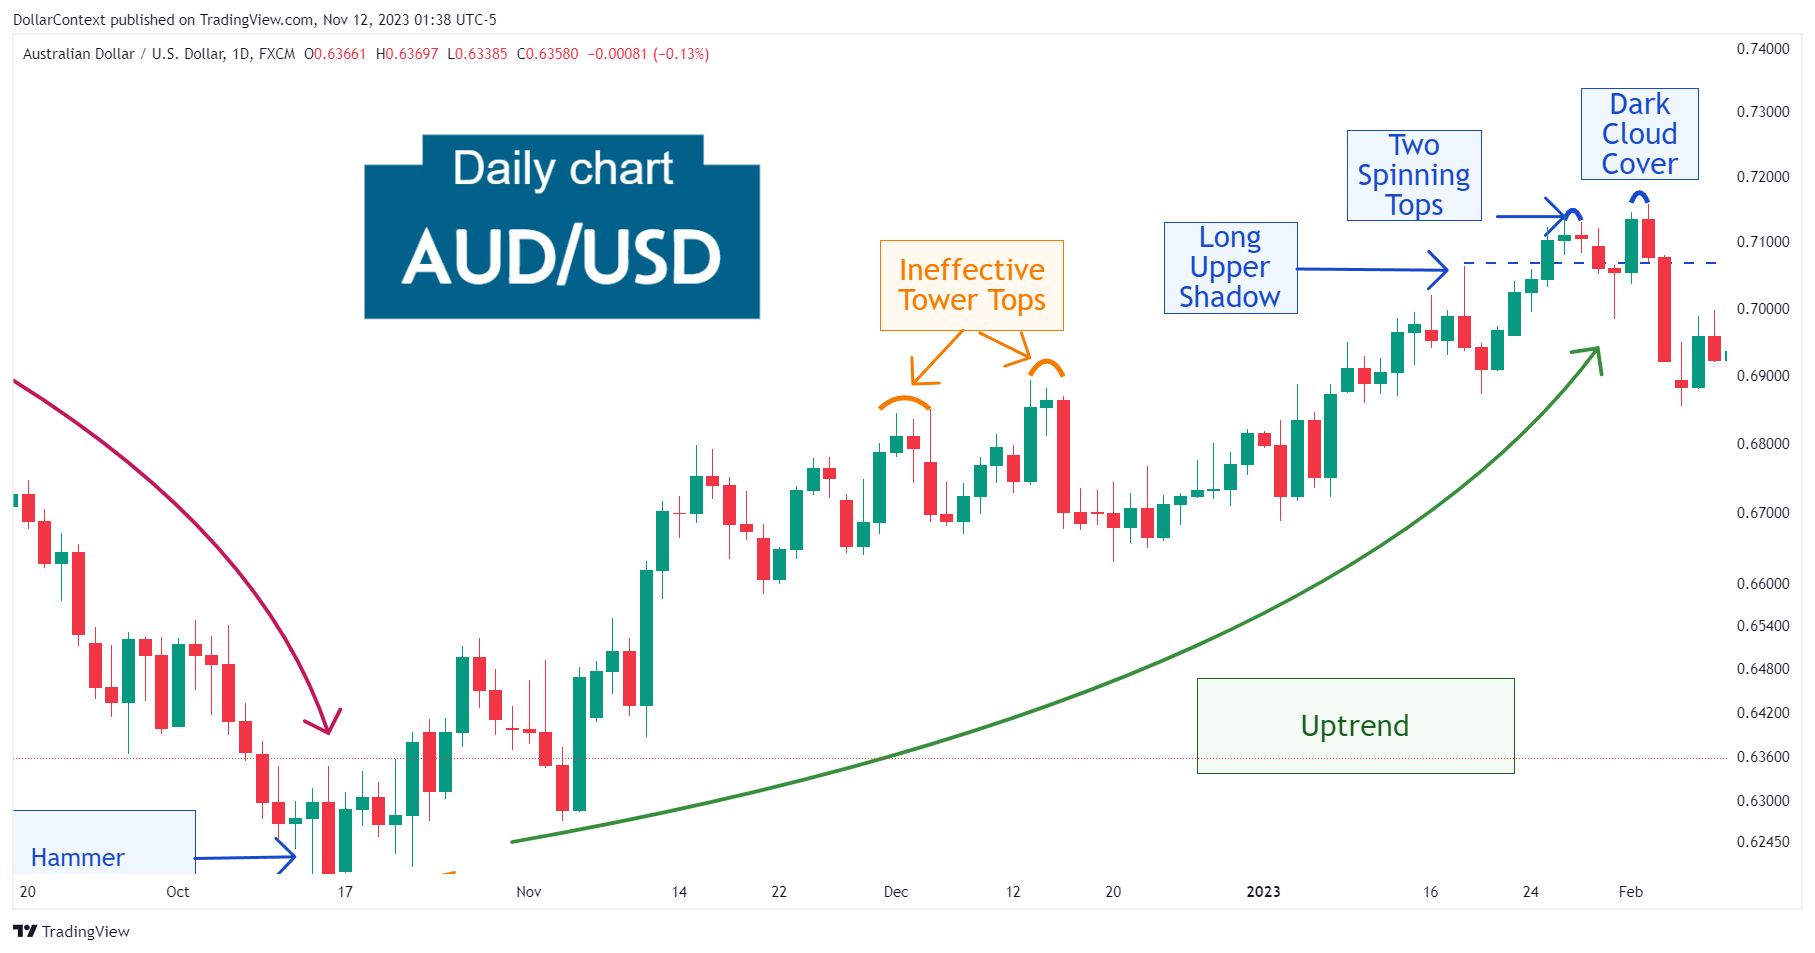
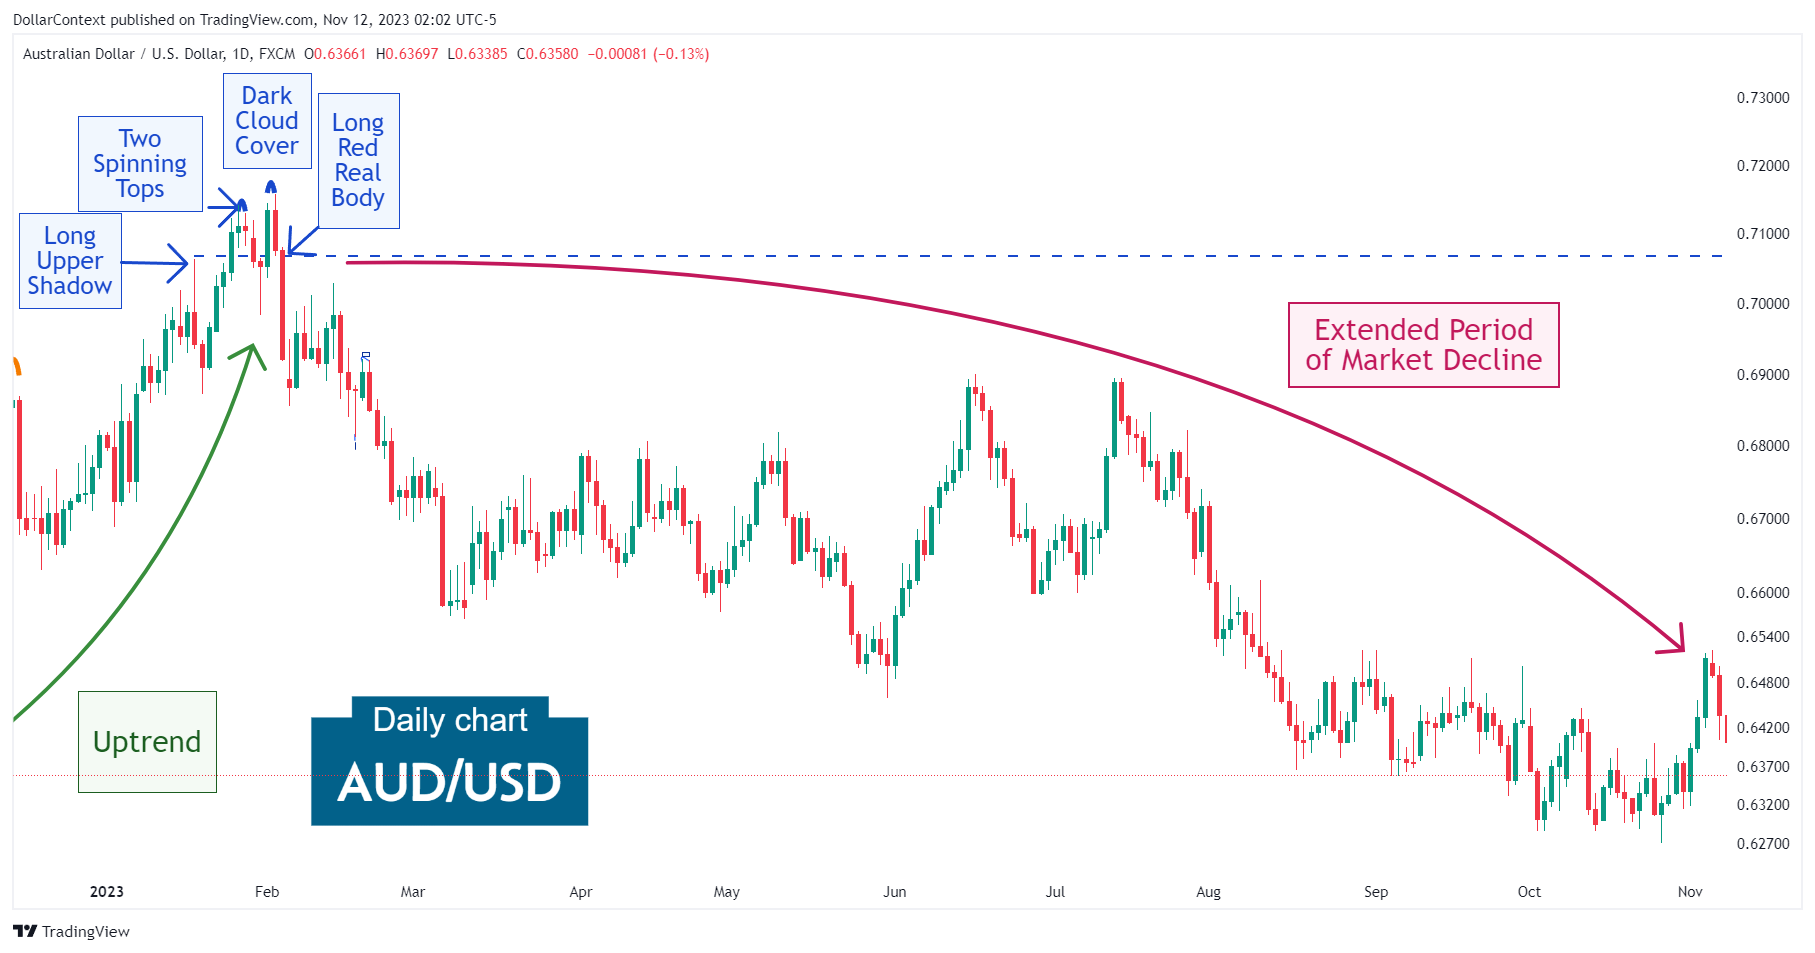
The rally that started in October 2022 showed its initial indication of reaching a peak when a candle with a long upper shadow appeared in January 2023.
The AUD/USD pair, however, continued to edge higher until the emergence of two spinning tops, which raised questions about the potential formation of a major top in the market. The appearance of a dark cloud cover near the highs of the two spinning tops added more reasons to suspect a turn.
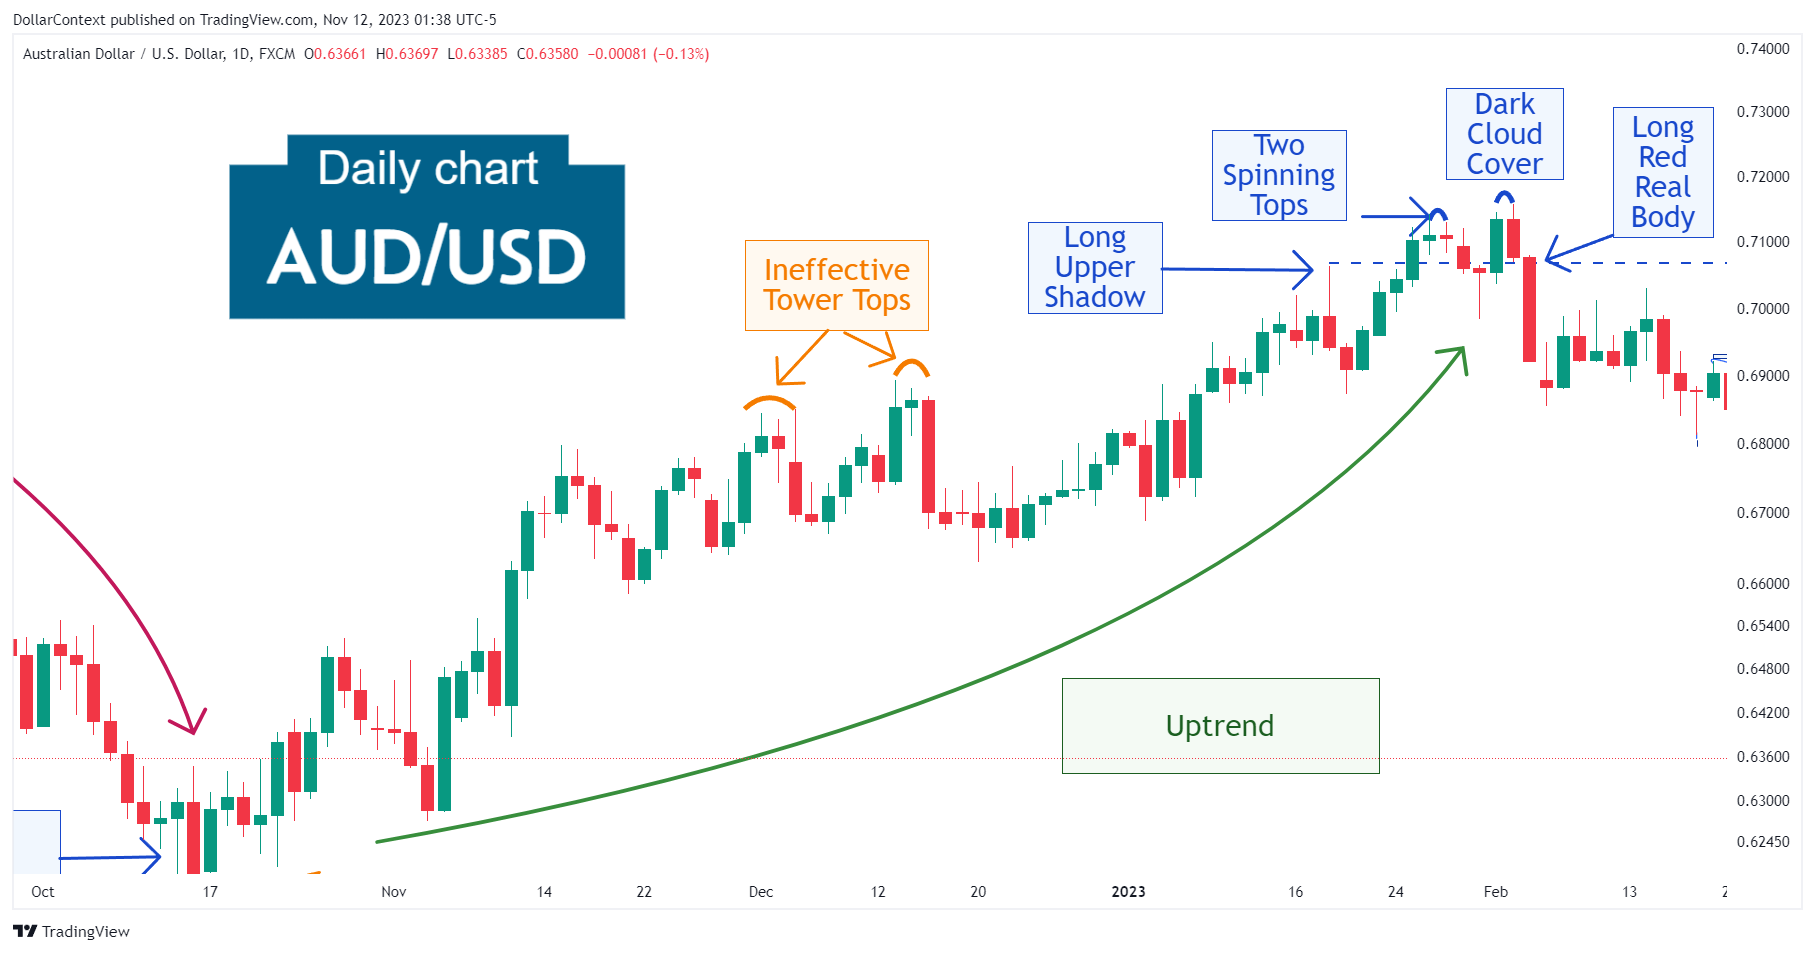
It's worth mentioning that, before the market peak, the AUD/USD exhibited two tower tops that did not effectively indicate a reversal, likely due to the immaturity of the uptrend at that time.
2. Early Market Transition
Following the dark cloud cover, the market exhibited a long red real body from the highs of the initial long upper shadow candle. This should be viewed as a confirmation of the series of bearish signals described above.
3. Resolution
As illustrated in the accompanying image, the reversal was followed by an extended period of market depreciation.
4. Conclusion and Subjective Review
This example illustrates how a sequence of minor indicators, like a long upper shadow session, two spinning tops, and a dark cloud cover that may not perfectly align with the ideal form, may anticipate a major top reversal.


