
Case Study 0024: Bullish Engulfing Pattern and Inverted Hammer (Nasdaq-100)
In this article, we will examine the performance of the Nasdaq-100 market after the emergence of an engulfing pattern, an inverted hammer, and a rising window.

Data Sheet
- Reference: CS0024
- Security: Nasdaq-100
- Timeframe: Hourly Chart (October 26, 2023)
- Patterns:
- Bullish Engulfing Pattern (Variation)
- Inverted Hammer
- Rising Window
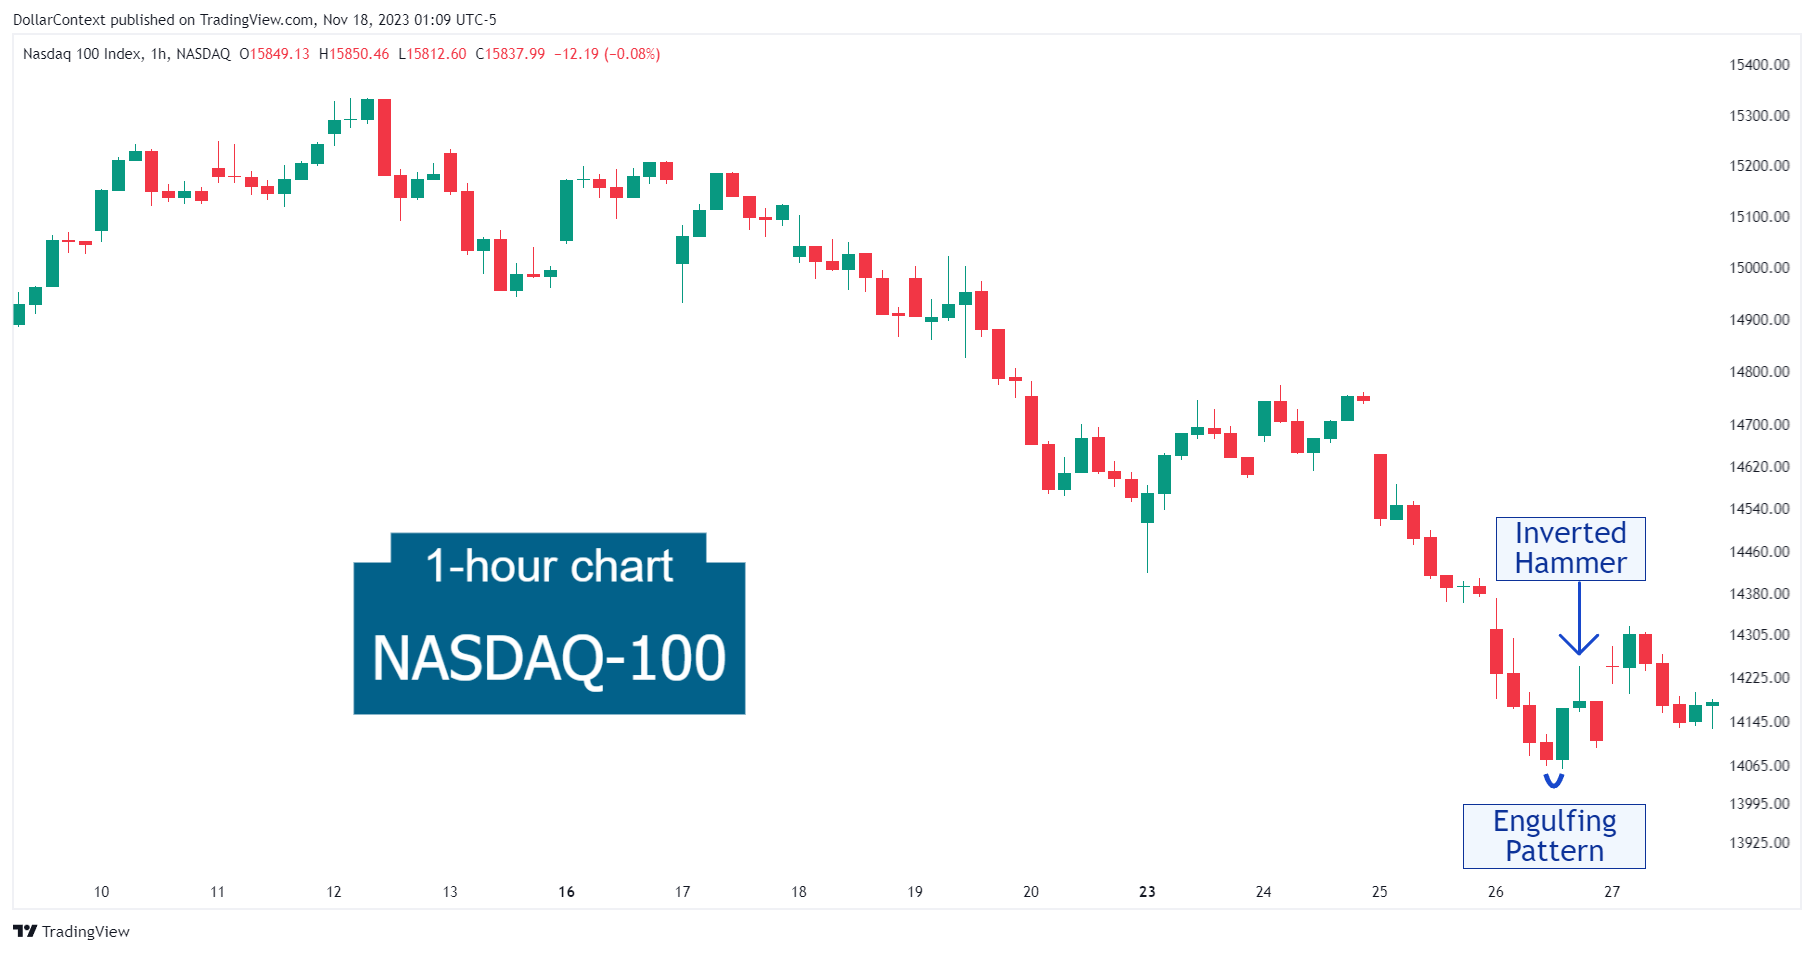
1. Signal Formation
After an extended downtrend (not fully shown in the chart below), the Nasdaq-100 index displayed a variation of the bullish engulfing pattern.
Observe how the engulfing pattern was then followed by an inverted hammer session.
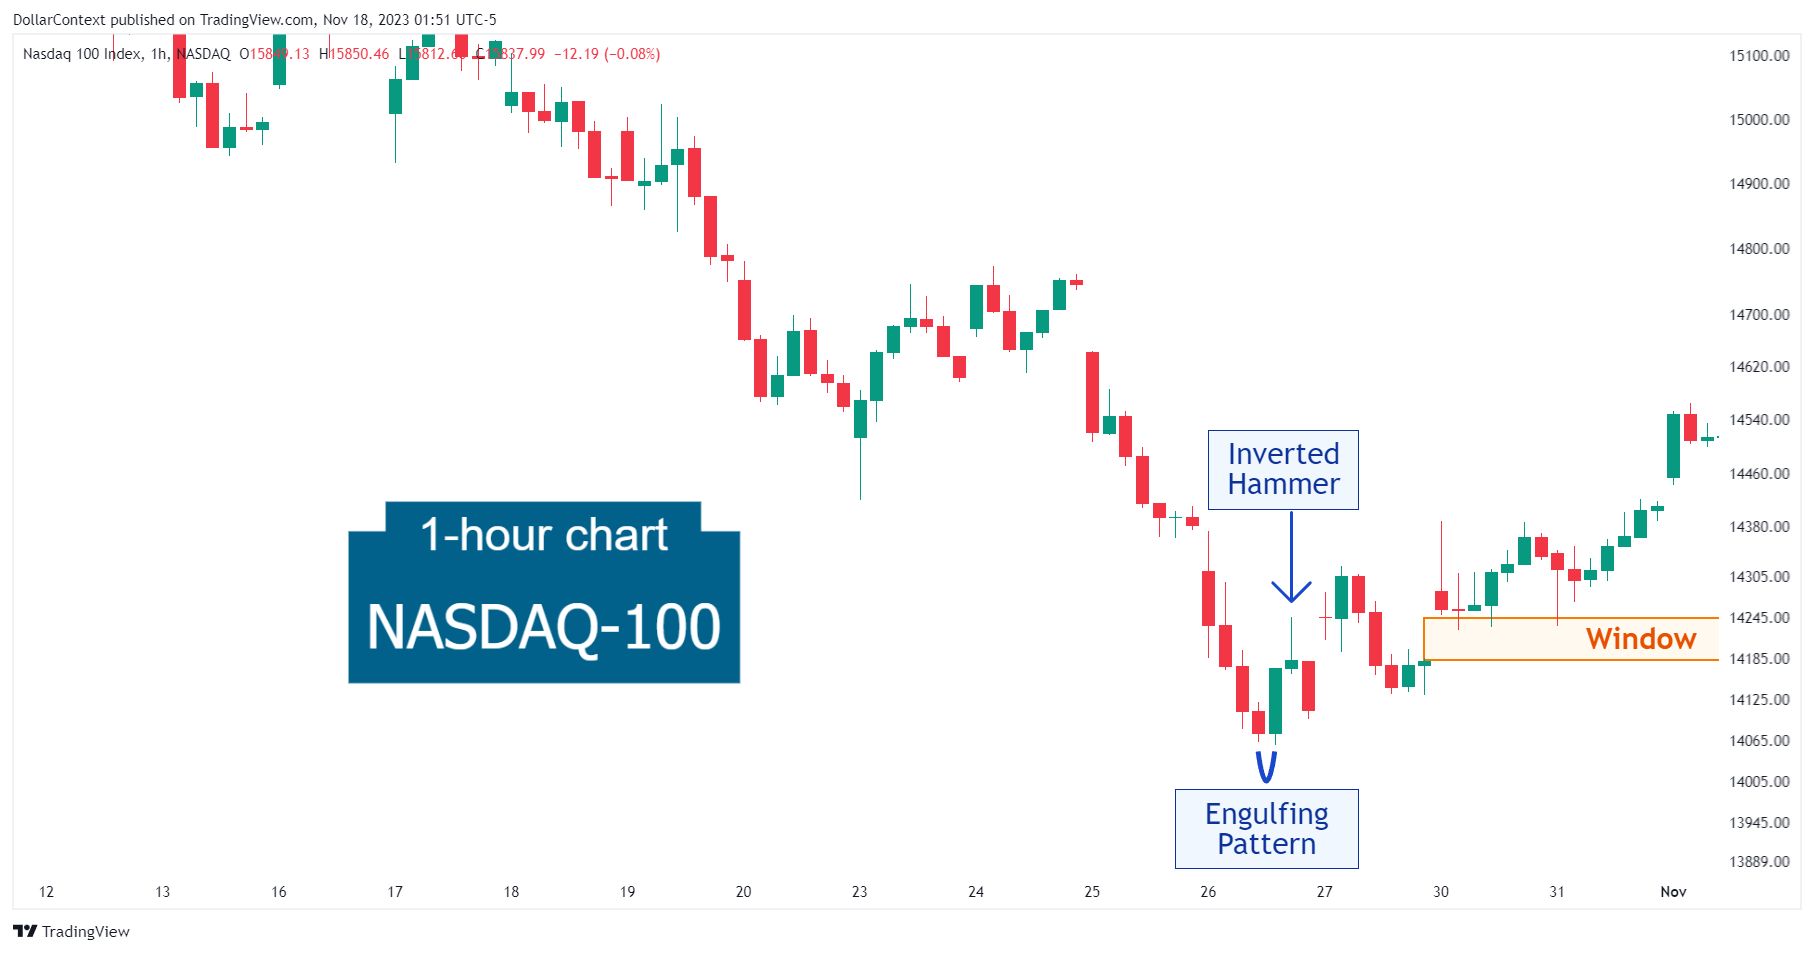
2. Early Market Transition
A few sessions later, a rising window (gap) emerged. In this case, the window should be interpreted as a signal that the incipient uptrend might become more established.
The window served as an effective support zone, as a series of market responses halted within its range. Remember, during an uptrend, the window should be the limit on a reaction.
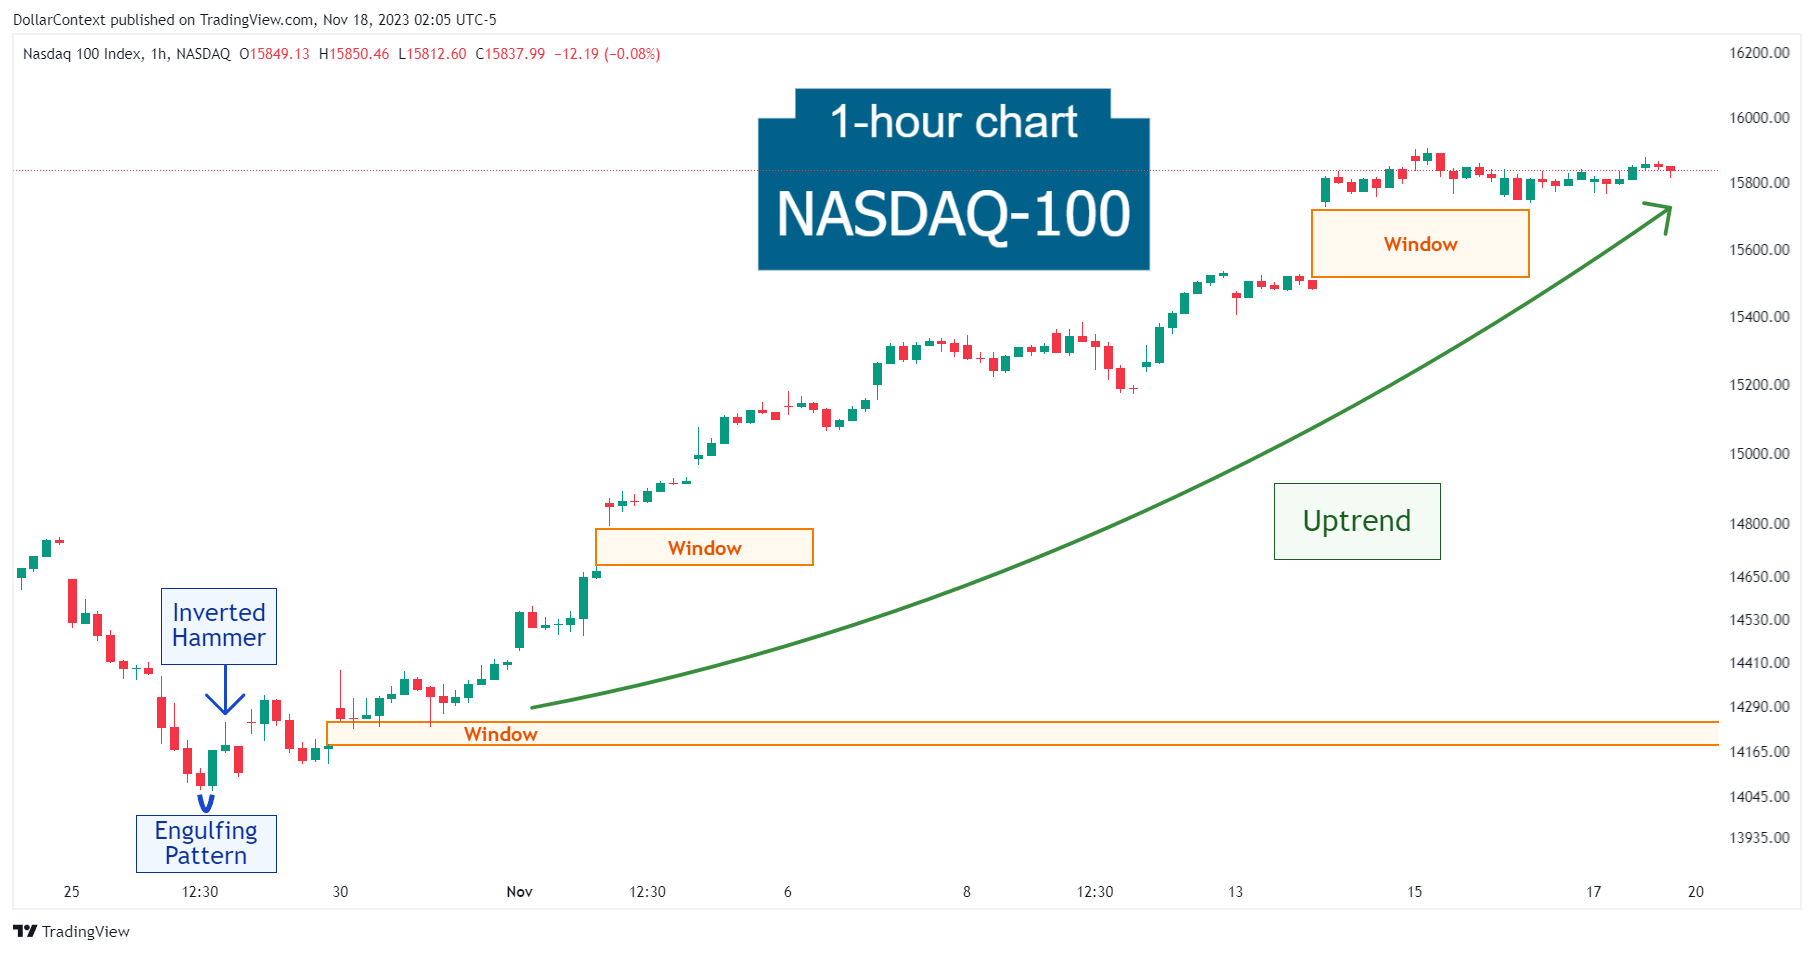
3. Resolution
The reversal transitioned into a prolonged and solid uptrend, during which the Nasdaq-100 saw two additional rising windows, as you can observe from the chart below:

4. Conclusion and Subjective Review
It is important to not underestimate the reversal signals that minor patterns, or a variation of them, can offer to traders, especially when followed by a window aligning with the reversal's direction. This is what unfolded with the Nasdaq-100 index as the market staged a bullish reversal after an engulfing pattern, an inverted hammer, and a rising window.


