
Case Study 0025: Evening Star, Long Upper Shadow, Engulfing Pattern, and Long Red Real Body (EUR/USD)
In this article, we will discuss the performance of the EUR/USD after the emergence of a series of bearish patterns.

Data Sheet
- Reference: CS0025
- Security: EUR/USD
- Timeframe: Hourly Chart (October 10, 2023)
- Patterns:
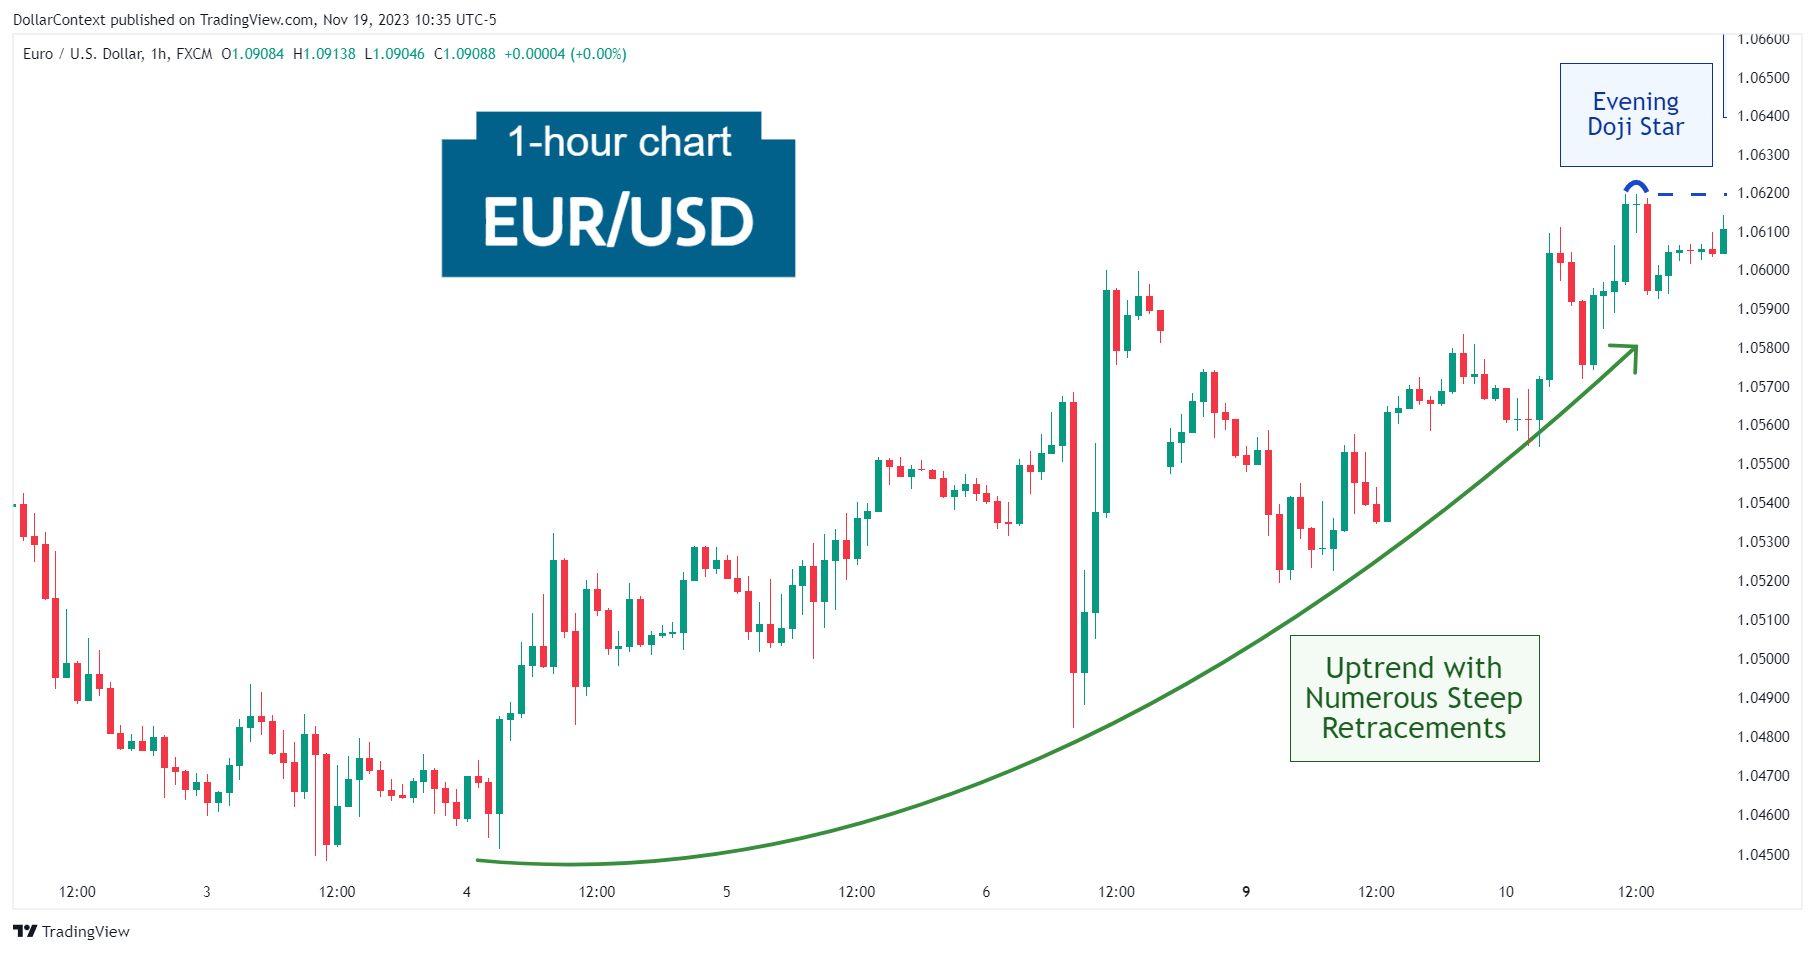
- Evening Doji Star
- Long Upper Shadow
- Evening Star
- Bearish Engulfing Pattern
- Long Red Real Body
1. Signal Formation
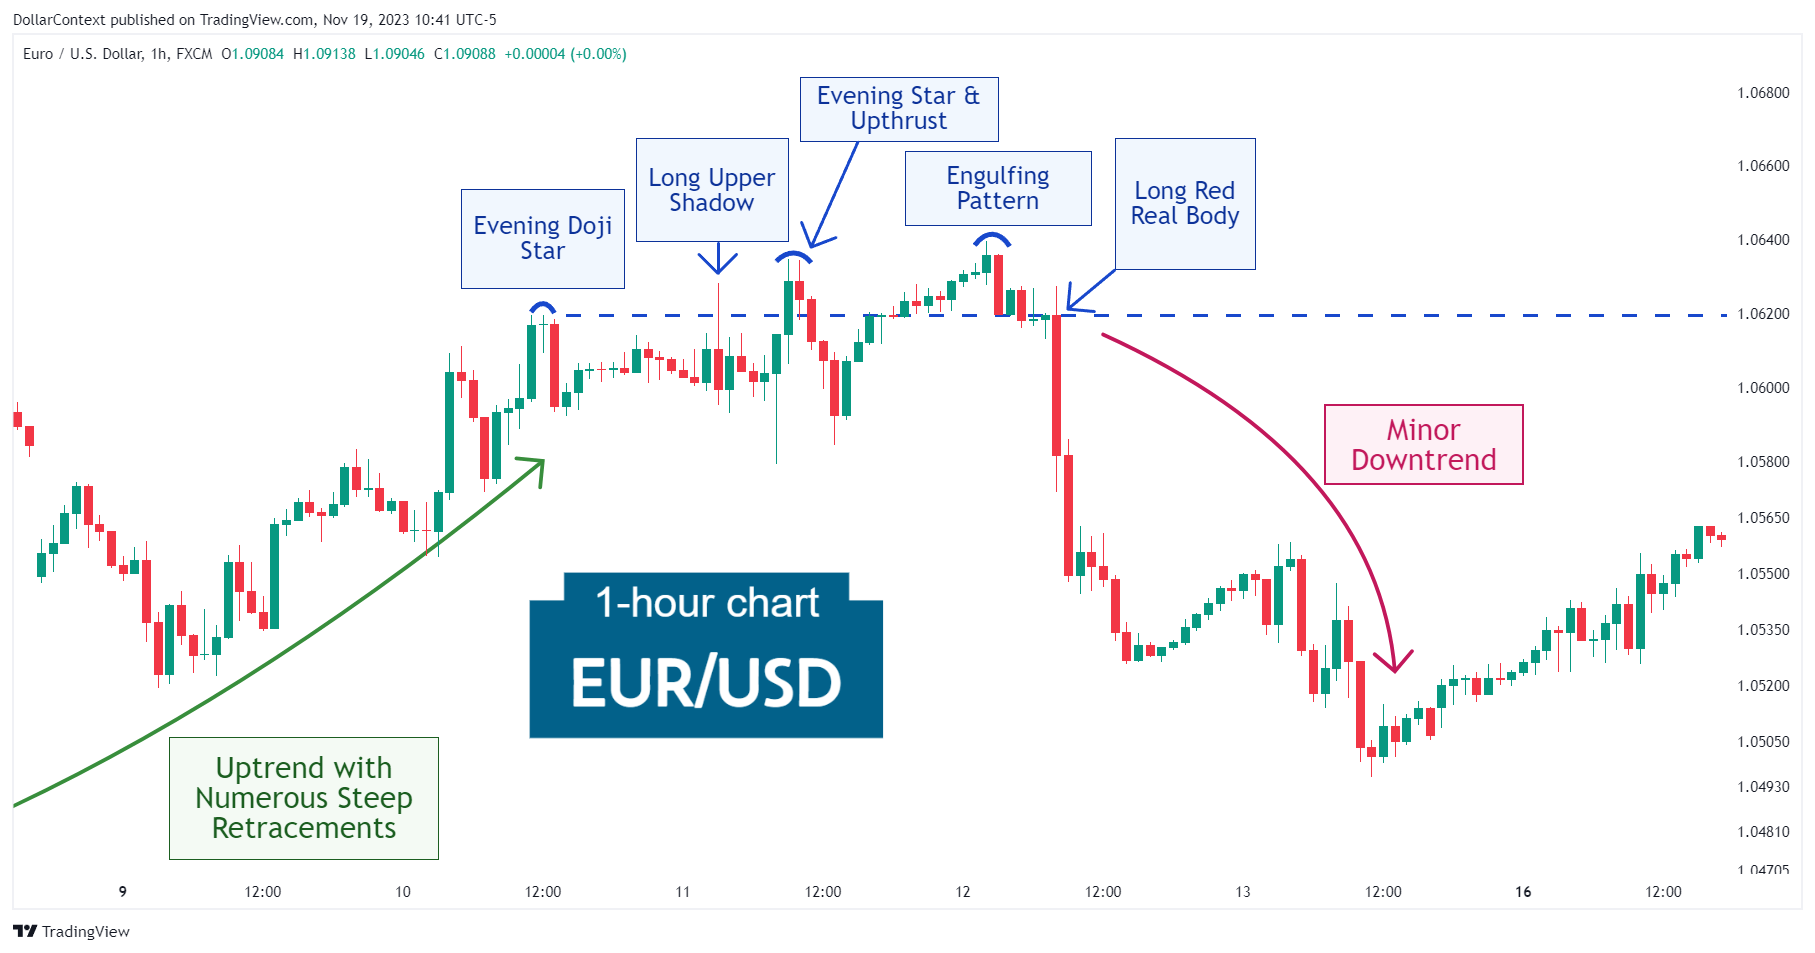
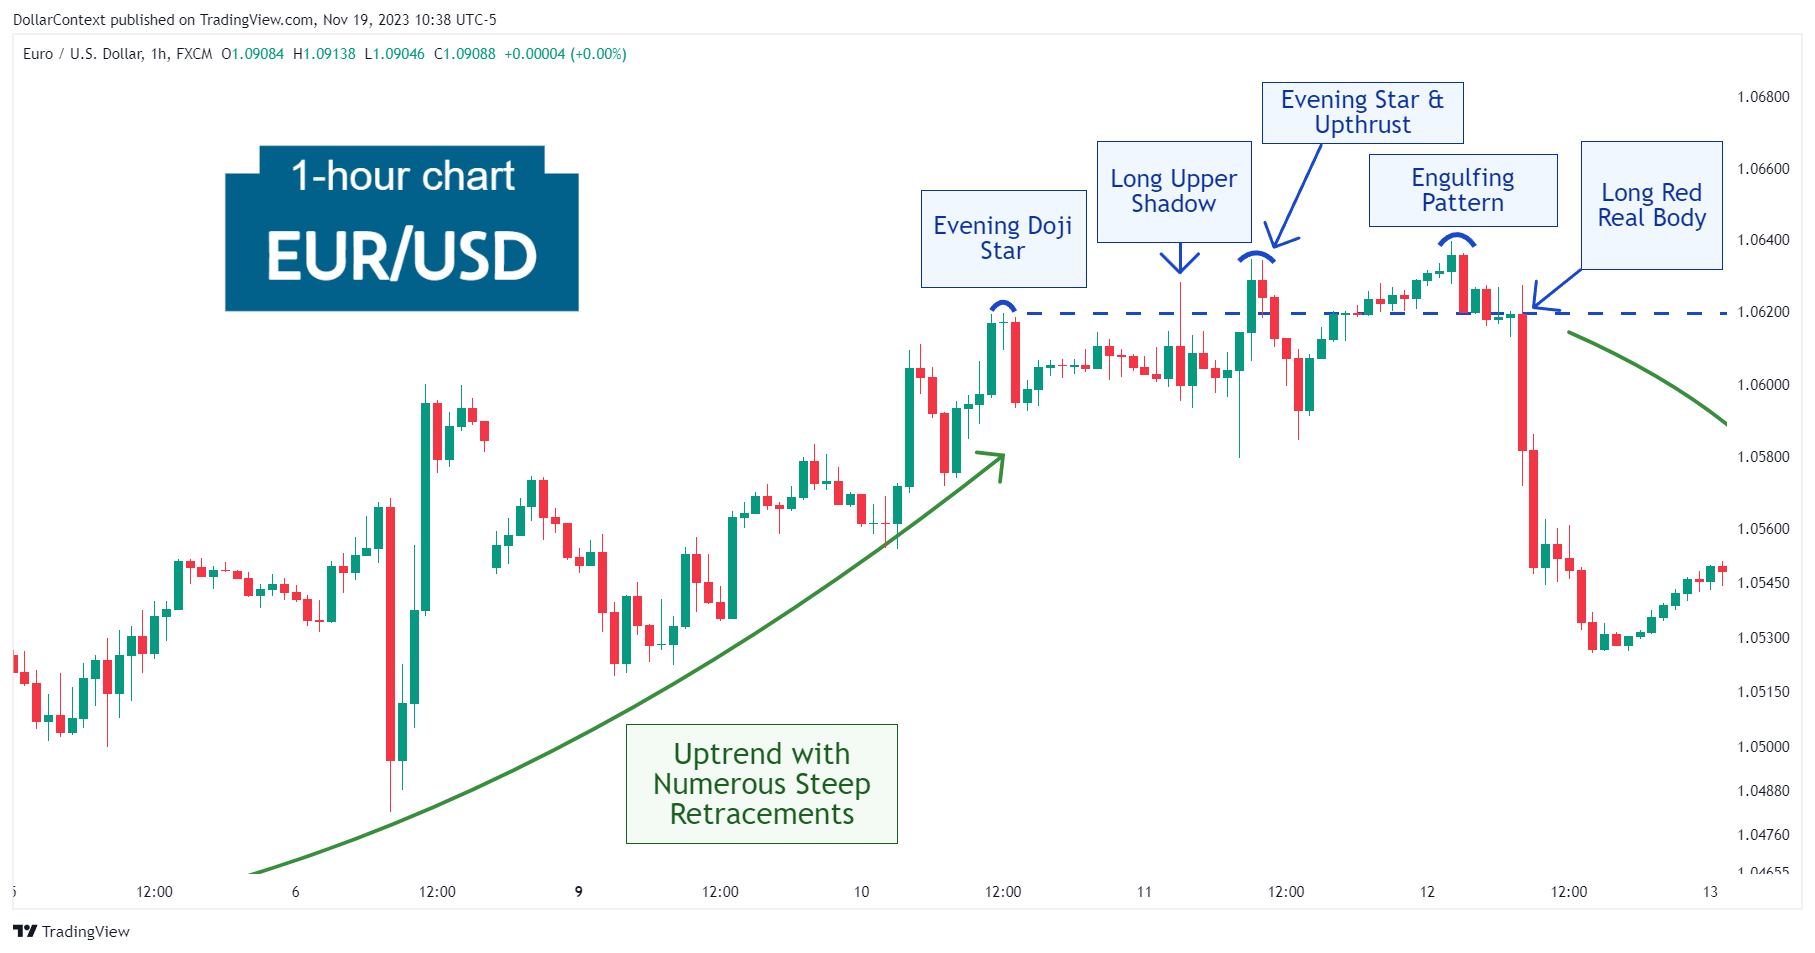
In early October 2023, the EUR/USD staged an uptrend characterized by its extended duration. However, the overall slope of this uptrend was not steep, suggesting a gradual increase in value over time. Notably, this trend is punctuated by numerous steep retracements, demonstrating a pattern of significant back and forth price movements within the broader upward trajectory.
These retracements, while sharp, haven't reversed the prevailing upward momentum, but rather have added a level of volatility and complexity to the market's behavior during this period. Then another symptom of market uncertainty came with the emergence of an evening doji star pattern on October 10.
2. Early Market Transition
Instead of reversing, the market displayed a sequence of bearish candlestick patterns at, or slightly above, the highs of the evening doji star. The topping signals included:
- Long Upper Shadow: The highs of this candlestick are also an upthrust of the resistance level set by the evening doji star described in the previous section.
- Evening Star: Although not a perfect evening star pattern, this formation helped corroborate the increasing selling pressure near the highs of the evening doji star and the long upper shadow session.
- Bearish Engulfing Pattern: This two-candle combination introduced additional bearish signs at higher price levels.
- Long Black/Red Real Body: Finally, the lofty red body originating from the peak of the initial evening doji star, confirmed the trend reversal and marked the start of a downturn.
3. Resolution
The long red real body led to a distinct, but relatively shallow, downtrend.

4. Conclusion and Subjective Review
In Japanese technical analysis, the confluence of many reversal patterns within the same price area enhances the probability of a reversal. However, the steepness and strength of the prior trend may also offer insights into the likely duration of the ensuing reversal.
For example, a slight upward trend with numerous steep retracements before a sequence of bearish patterns may suggest a minor reversal. This scenario played out with the EUR/USD in October 2023, where the market underwent a modest downturn under similar circumstances.


