
Case Study 0026: High-Wave and Tower Top in a Consolidation Phase (EUR/USD)
In this article, we will discuss the performance of the EUR/USD after the emergence of a high-wave candle in a consolidation phase.


Data Sheet
- Reference: CS0026
- Security: EUR/USD
- Timeframe: Hourly Chart (November 15, 2023)
- Patterns:
- High-Wave
- Tower Top
- Hanging Man
- Shooting Star
1. Signal Formation
After an extended sideways market (not fully shown in the chart below), the EUR/USD pair broke out with a strong, steep upward move. Following a minor retracement, the market displayed a prominent high-wave candle.
This situation effectively sets the stage for discussing two possible future scenarios that may arise from observing the remarkable high-wave session:
- The high-wave signals a bearish reversal
- The high-wave suggests a consolidation phase, that is, a period of non-trending market.
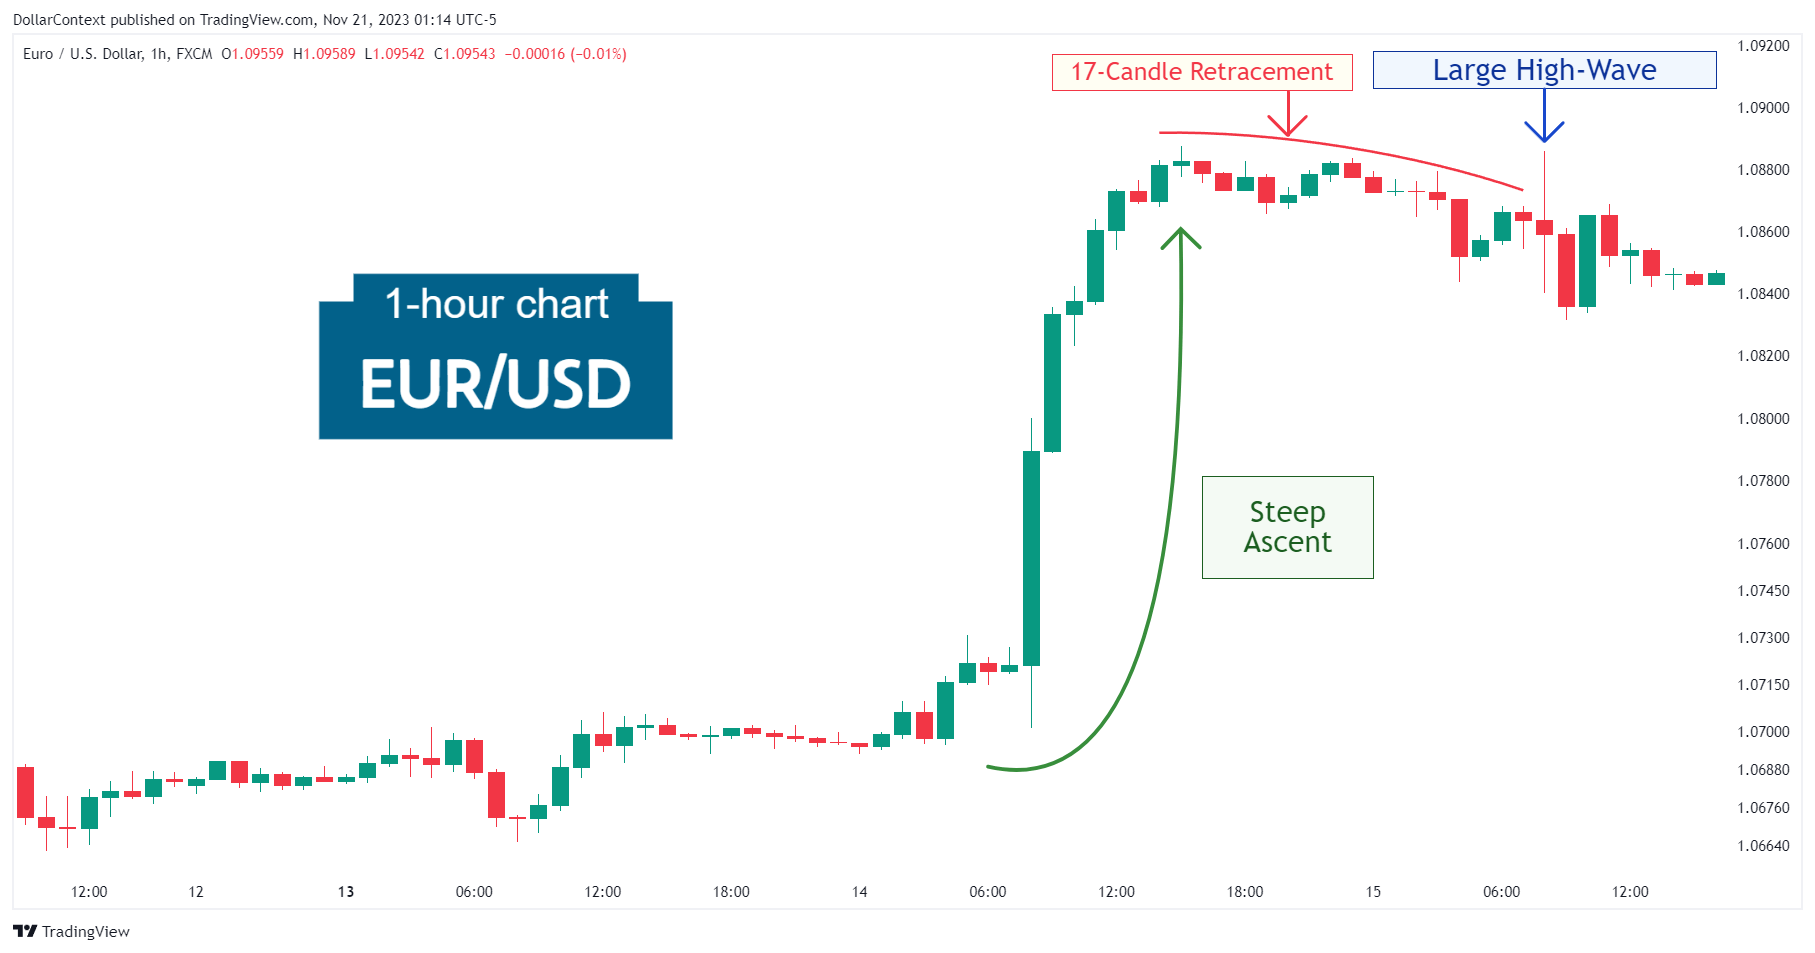
2. Early Market Transition
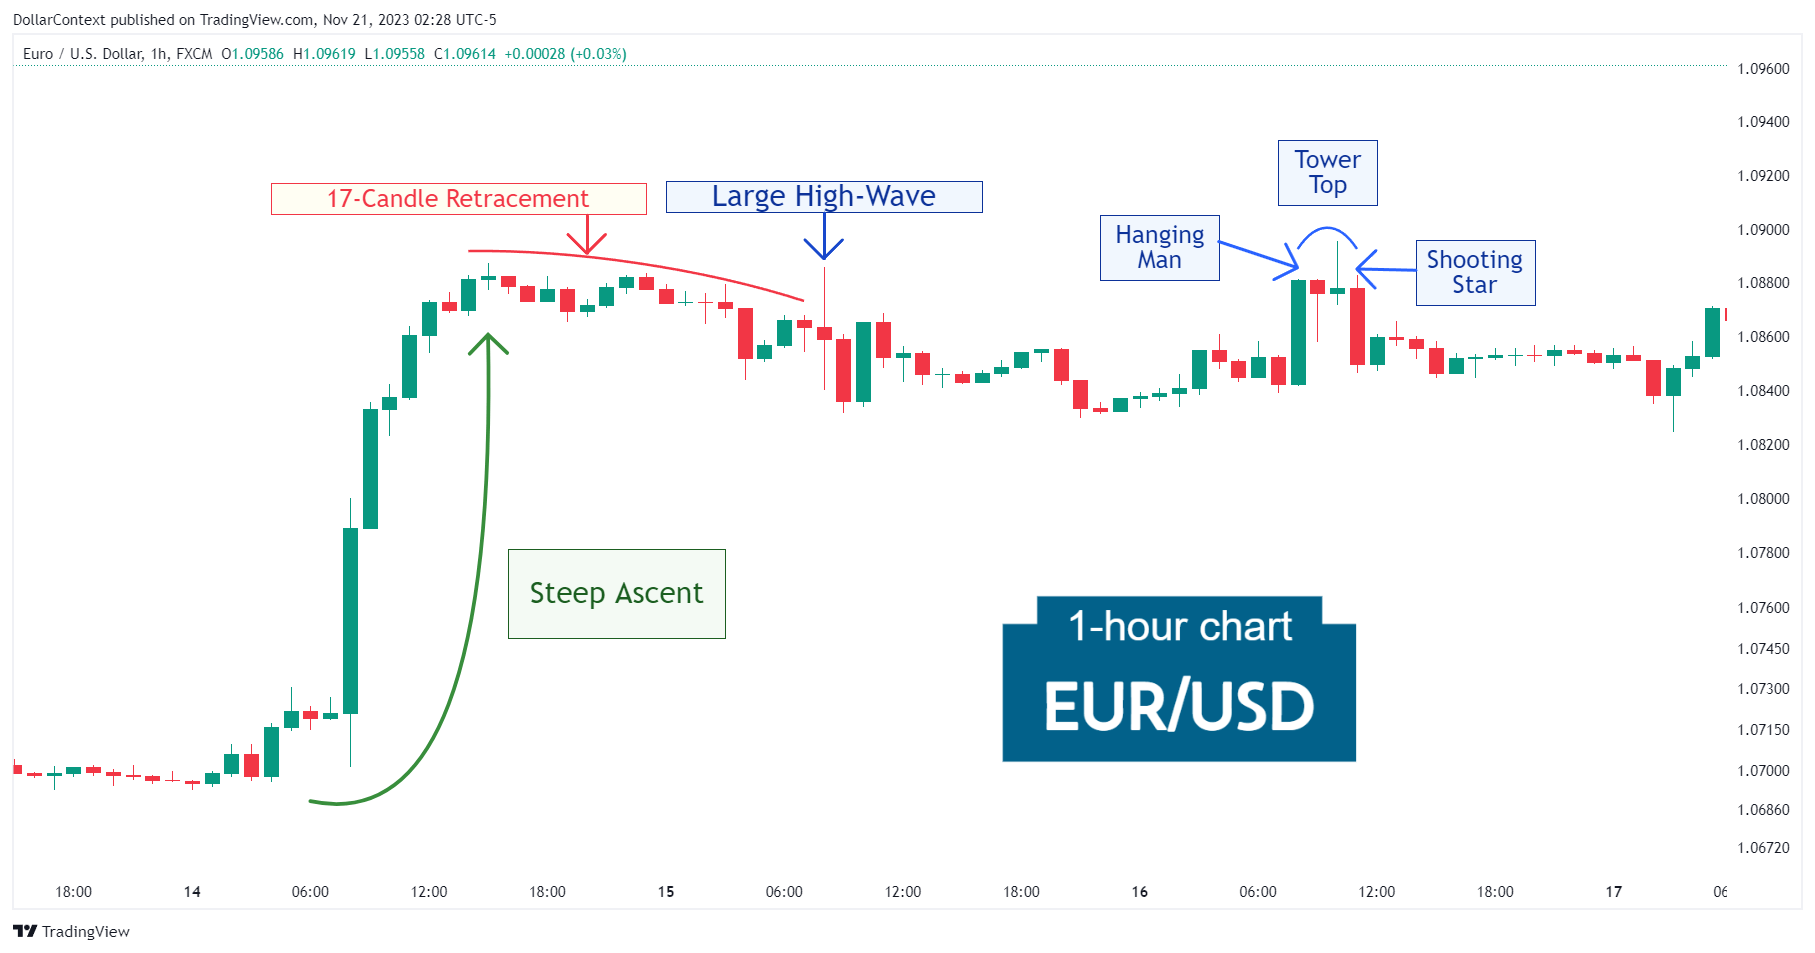
Given that the high-wave appeared not right after the upward move, but instead after a period of 17 candles following the upswing, it is more reasonable to anticipate a range-bound market rather than a bearish reversal. This is what unfolded as the EUR/USD displayed a horizontal range for almost four days.
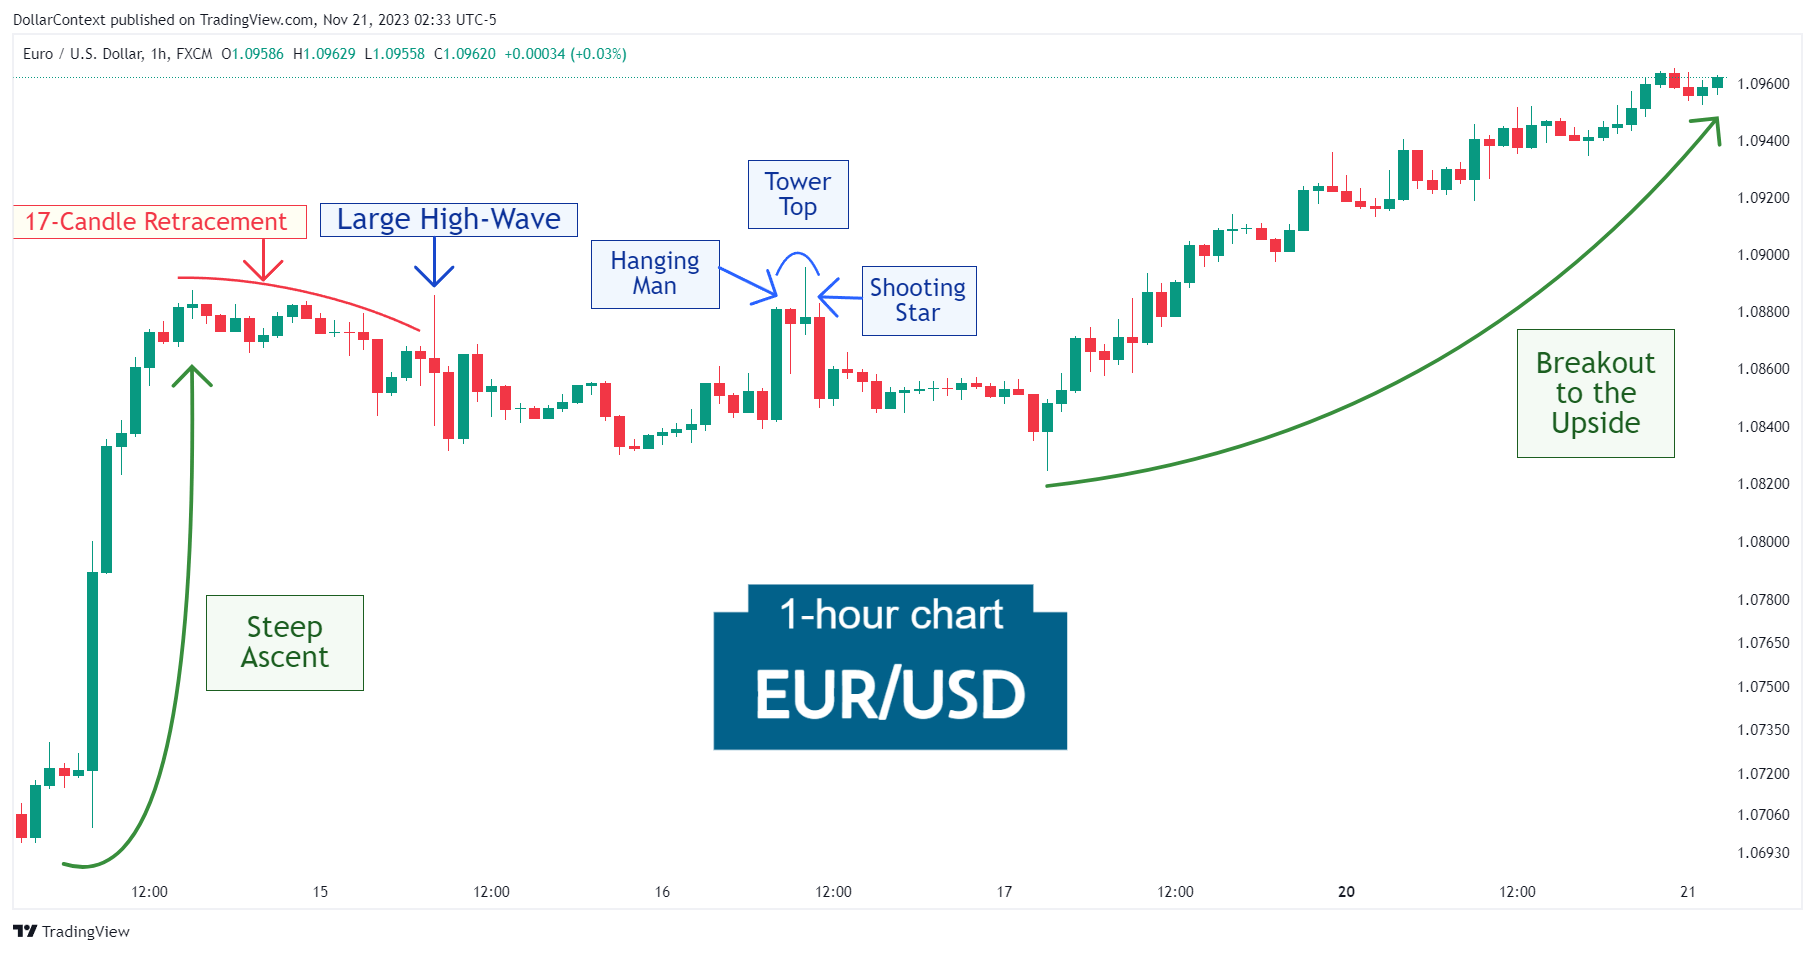
It's worth noting that, during the lateral movement, the market displayed a tower top, which in turn included a hanging man and a shooting star. All of them signaled a minor decline to the lower bound of the trading range.
3. Resolution
The tower top marked the beginning of the last downward move within the trading range. The market then broke out to the upside to resume the previous uptrend.
4. Conclusion and Subjective Review
Remember, a reversal pattern in the course of a range-bound market, or a short trend, should be interpreted with caution. Such signals may evolve into a consolidating phase over an extended period.


