Case Study 0027: Evening Star and Bearish Engulfing Pattern (DXY)
In this article, we will discuss the performance of the Dollar Index after an evening star and engulfing pattern.

Data Sheet
- Reference: CS0027
- Security: U.S. Dollar Index (DXY)
- Timeframe: Daily Chart (September 28, 2022)
- Patterns:
- Evening Star (Variation)
- Bearish Engulfing Pattern
1. Signal Formation
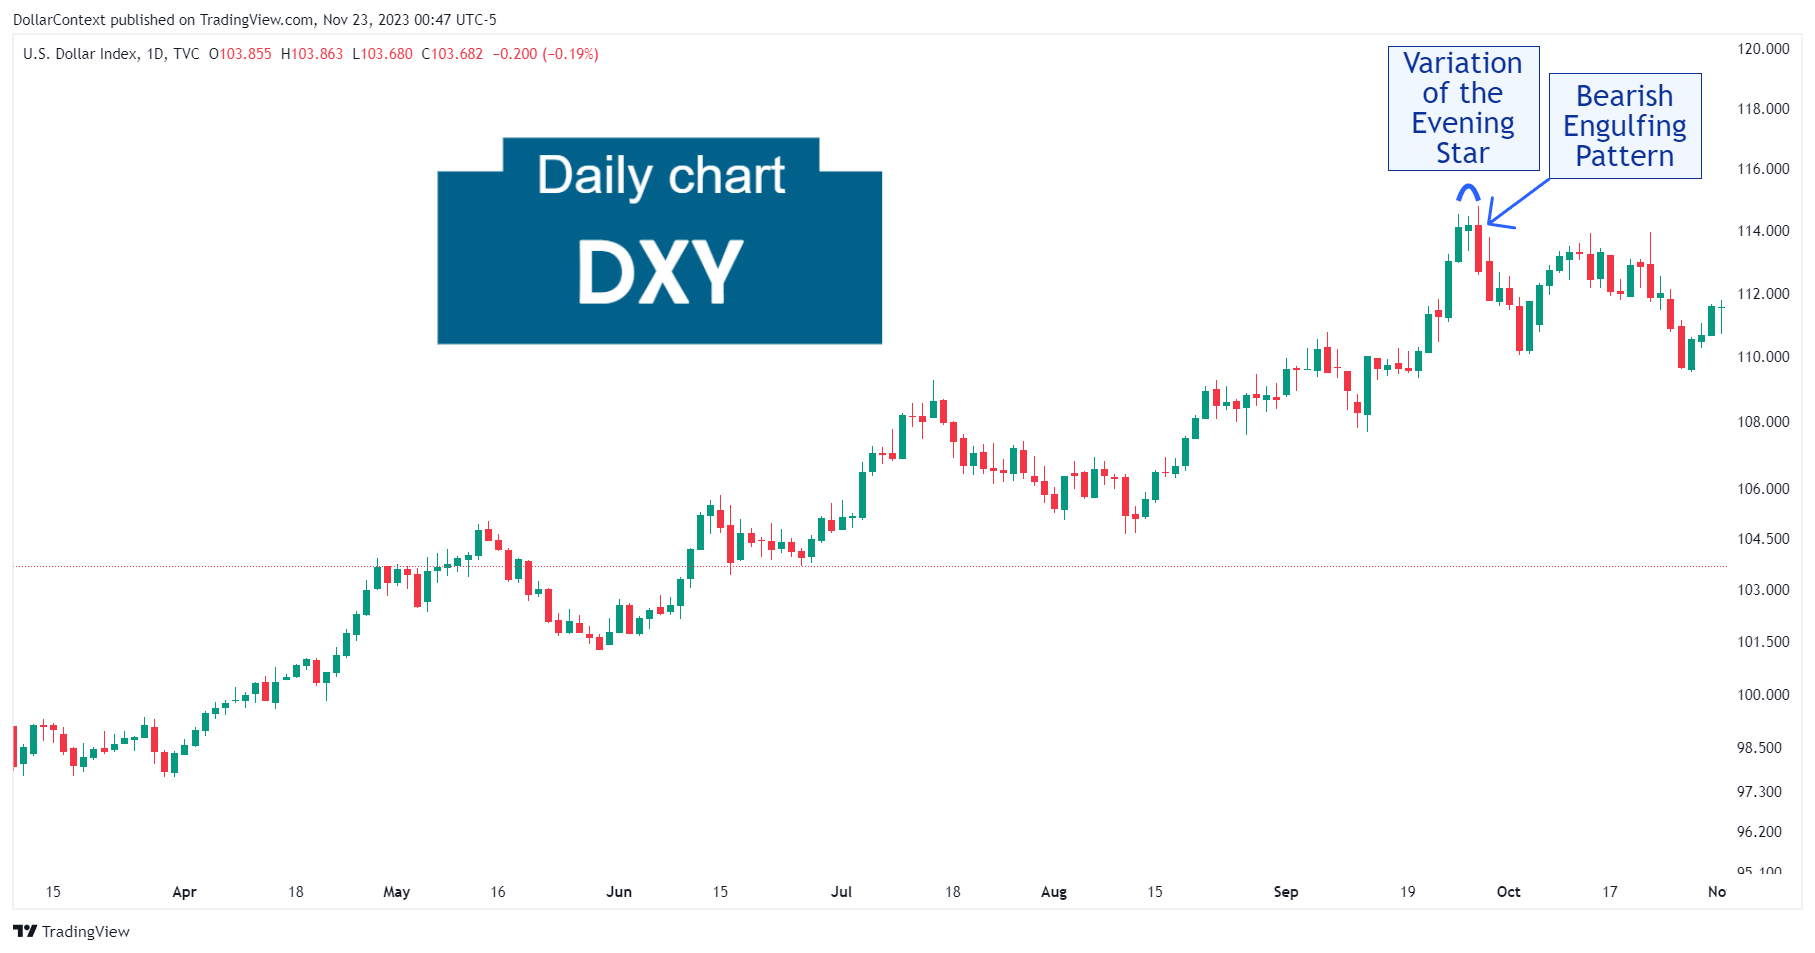
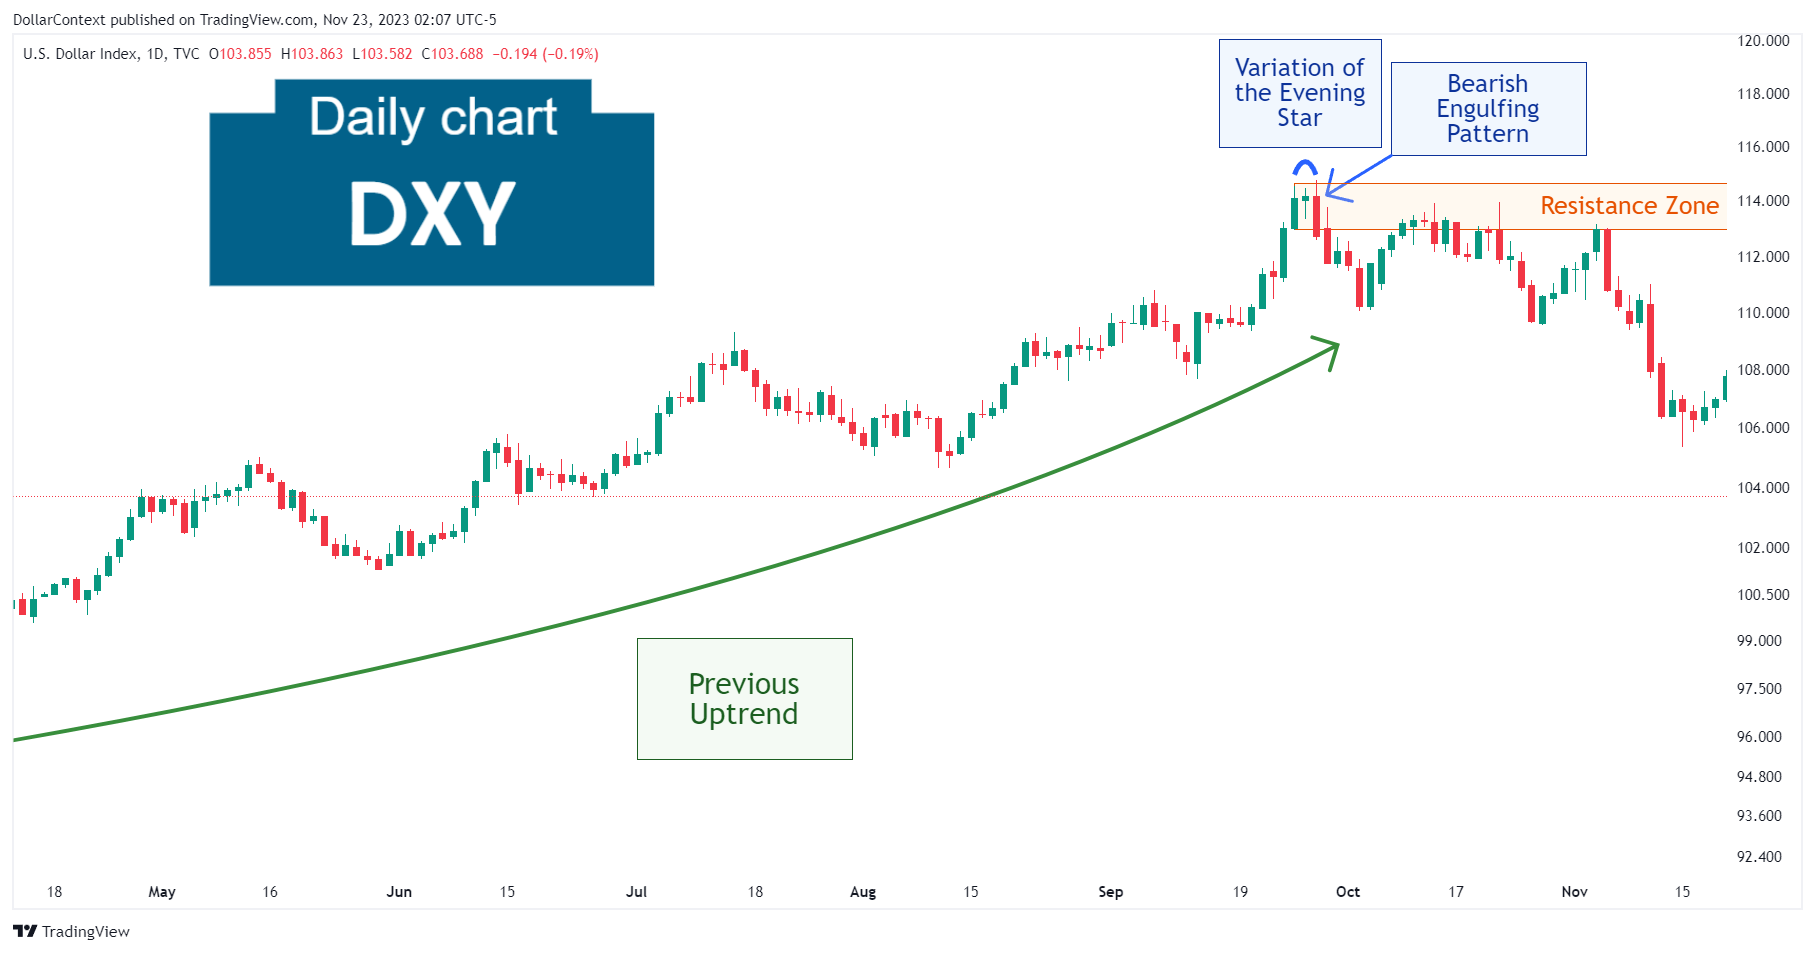
Following a prolonged and sustained uptrend that began in January 2021, the U.S. Dollar Index displayed a variation of the evening star formation. The classic version of the evening star pattern features a third candle that closes well into the body of the first. In this case, the third candle exceeds the lows of the first.
Observe how the second and third candle of the evening star can be viewed as a bearish engulfing pattern.
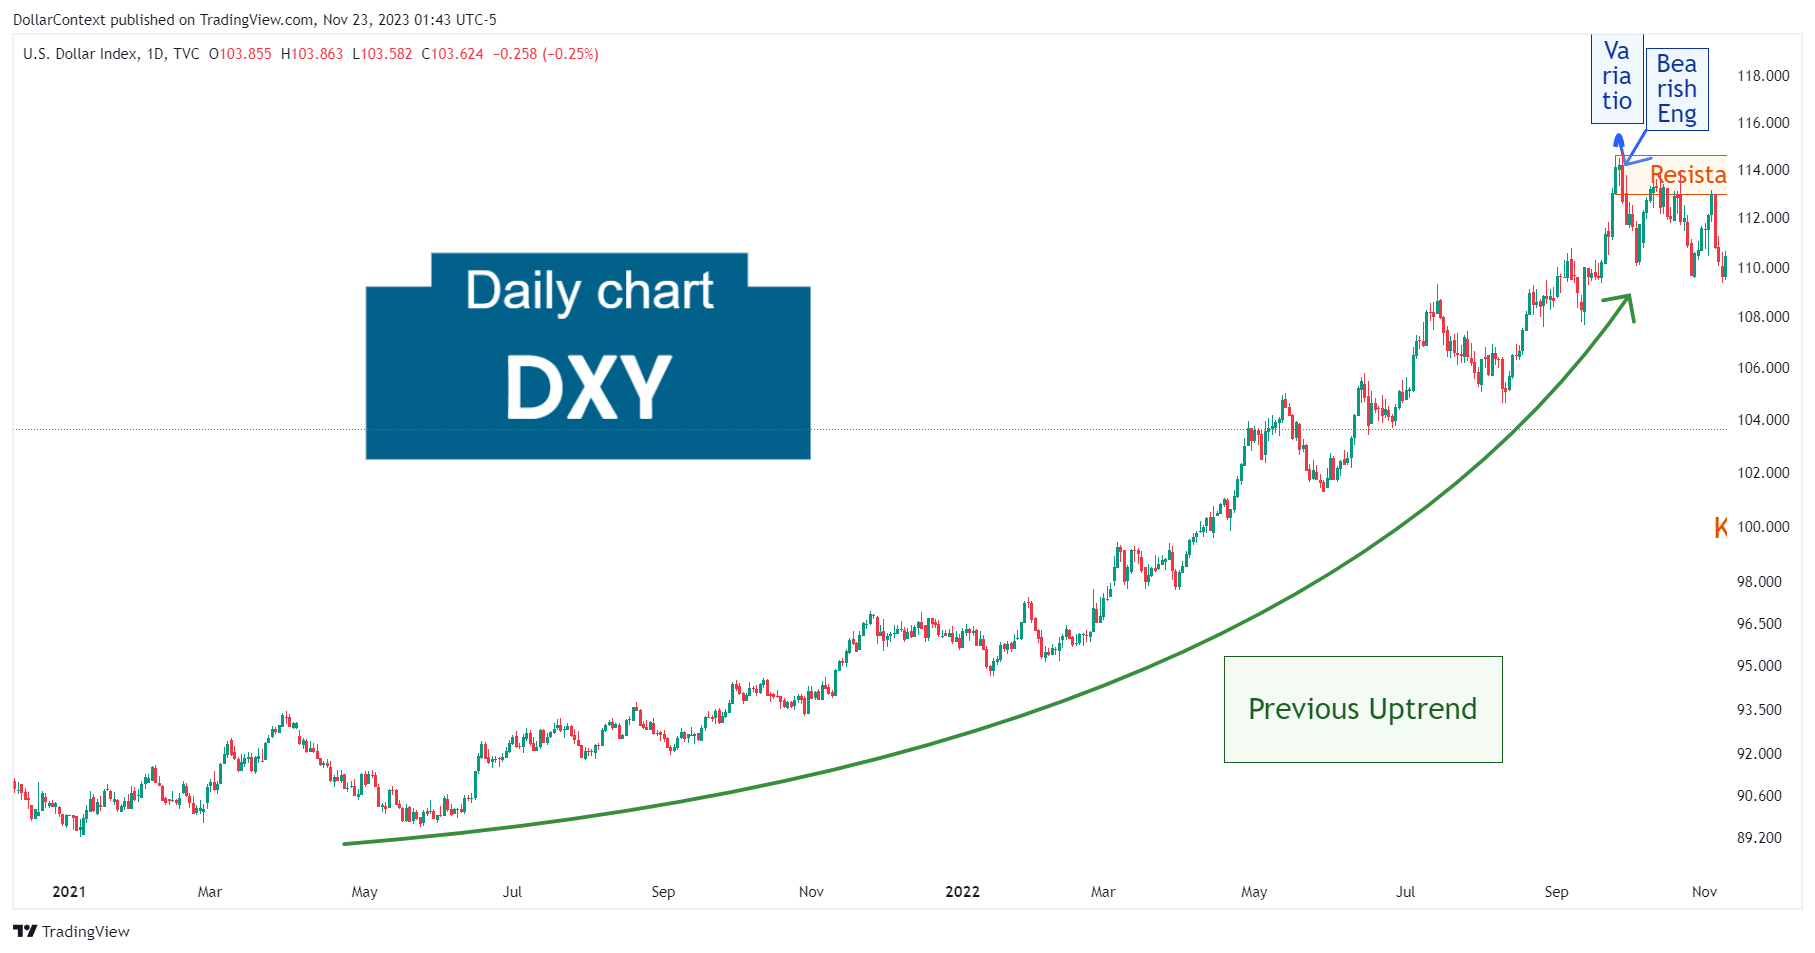
Taking a wider perspective of the chart above, we can appreciate the extent and duration of the previous trend.
2. Early Market Transition
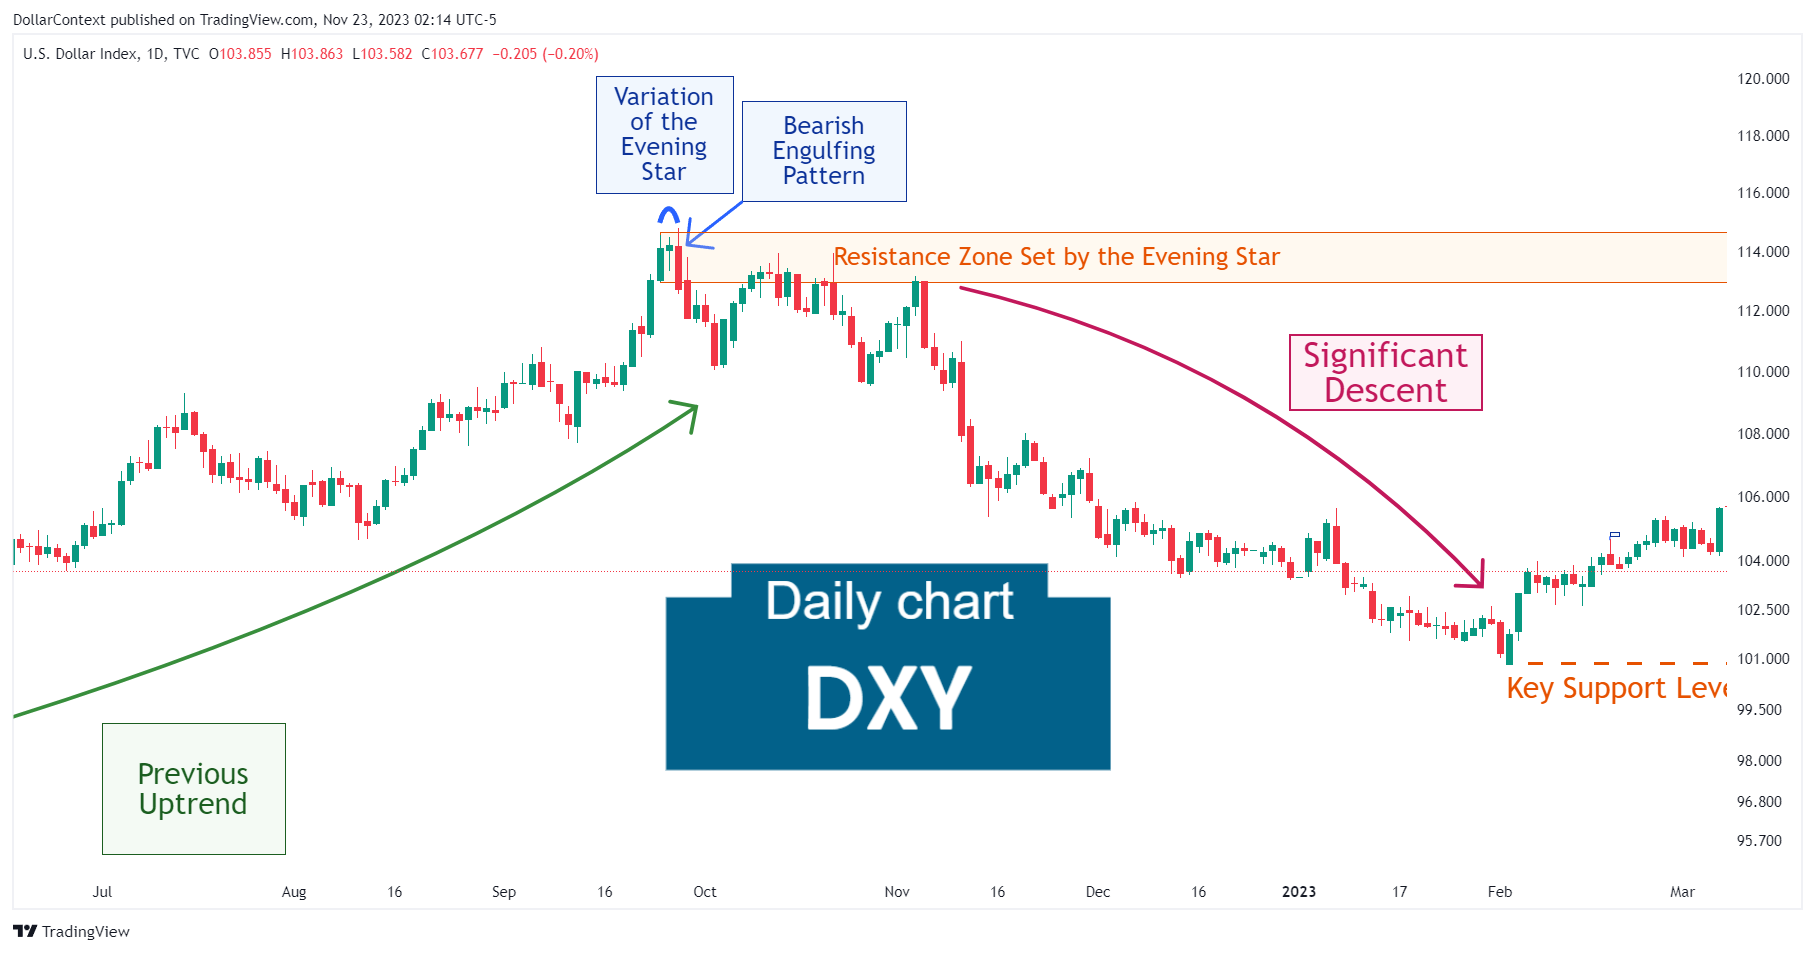
After such a strong and extended uptrend, lingering momentum prompted the market to retest the highs established by the evening star, before initiating a more definitive decline. This is a classic example of the evening star acting as resistance.
Note how the resistance area was tested on numerous occasions over a prolonged period.
3. Resolution
After the testing period at high price levels, the Dollar Index staged a substantial decline of around 12 percent.

4. Conclusion and Subjective Review
One of the most interesting aspects of this case study is, probably, the fact that, after the emergence of the candlestick indicators detailed above, the resistance level set by those patterns underwent multiple tests over an extended period, before beginning the eventual downtrend.