Case Study 0028: Hammer and Long Lower Shadows (Natural Gas)
In this article, we will examine the performance of the natural gas market after the emergence of a hammer and two long lower shadows.

Data Sheet
- Reference: CS0028
- Security: Natural Gas
- Timeframe: Hourly Chart (November 10, 2023)
- Patterns:
- Hammer
- Ineffective Hammer
- Long Lower Shadows
- Rising Window
1. Signal Formation
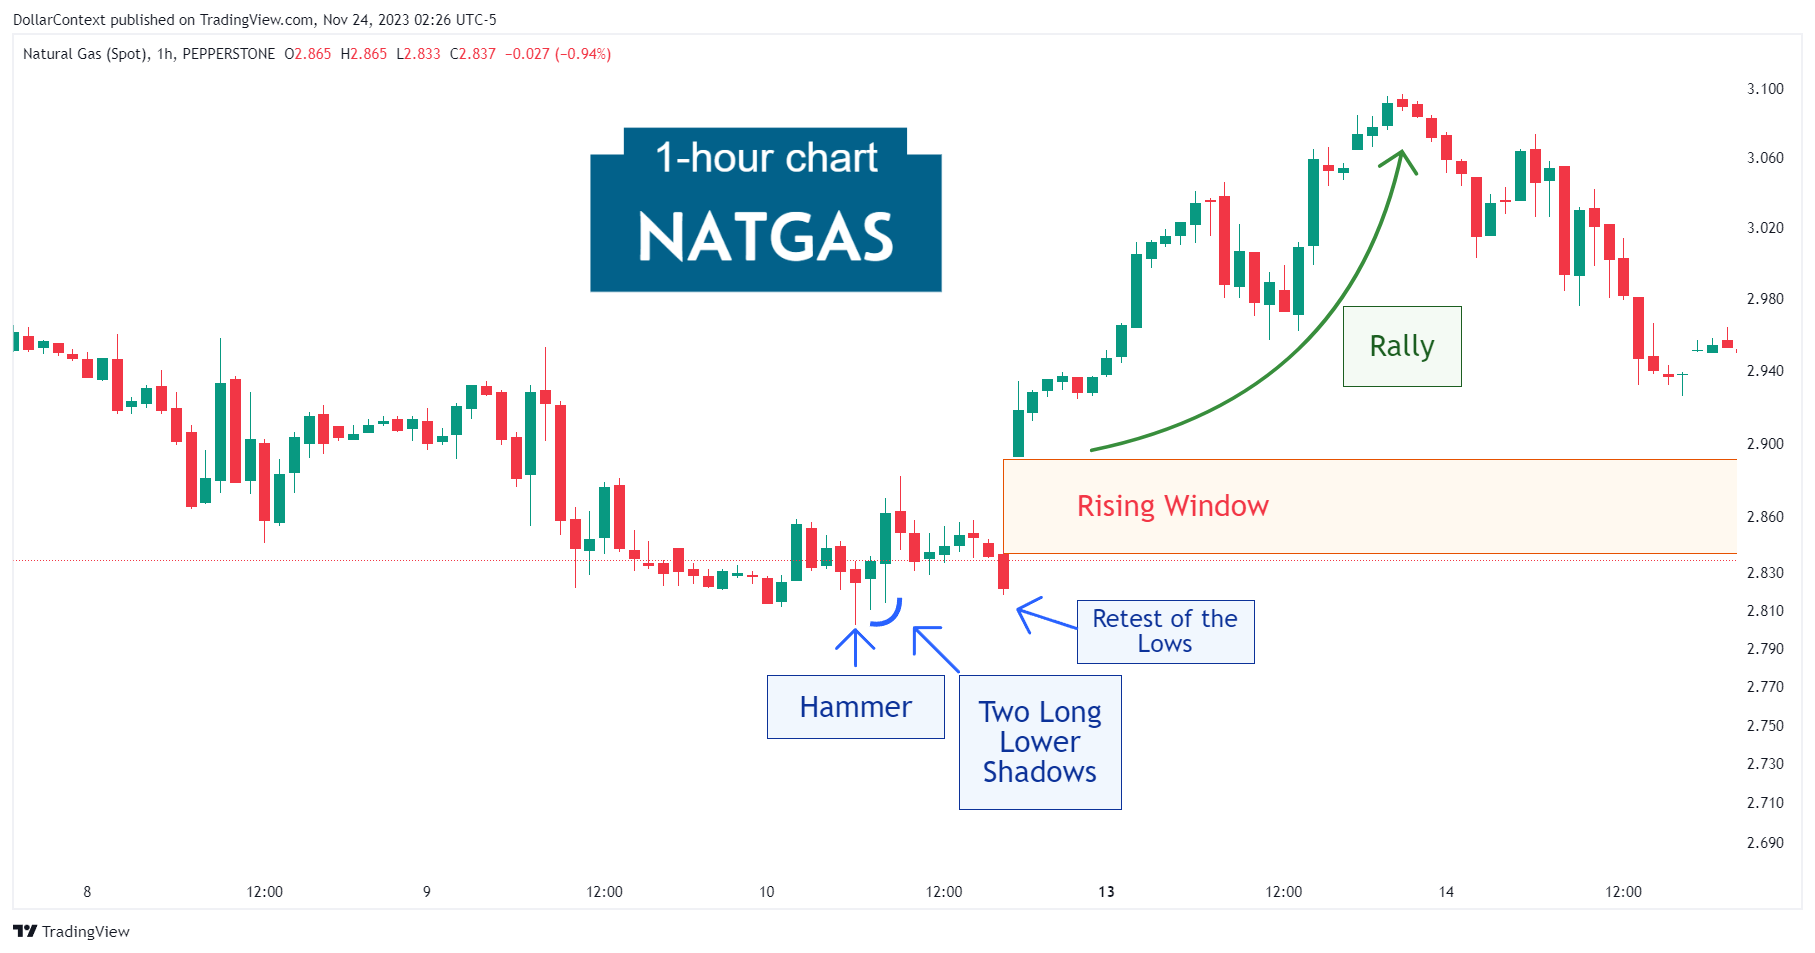
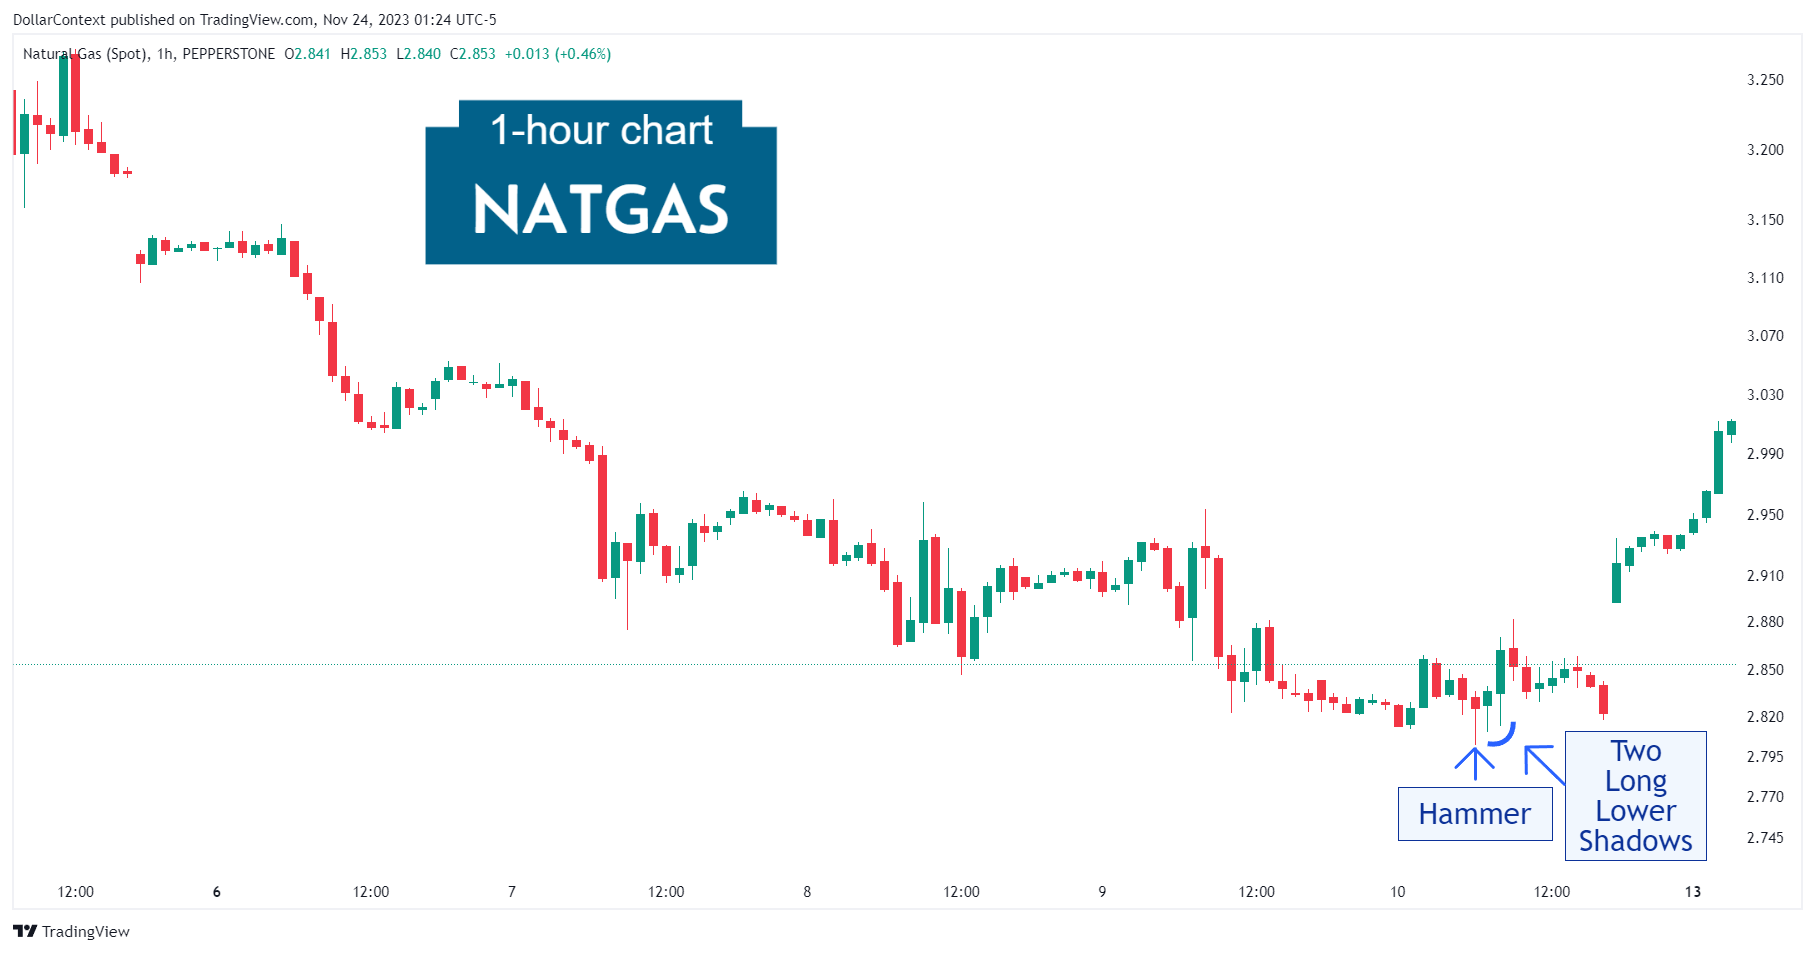
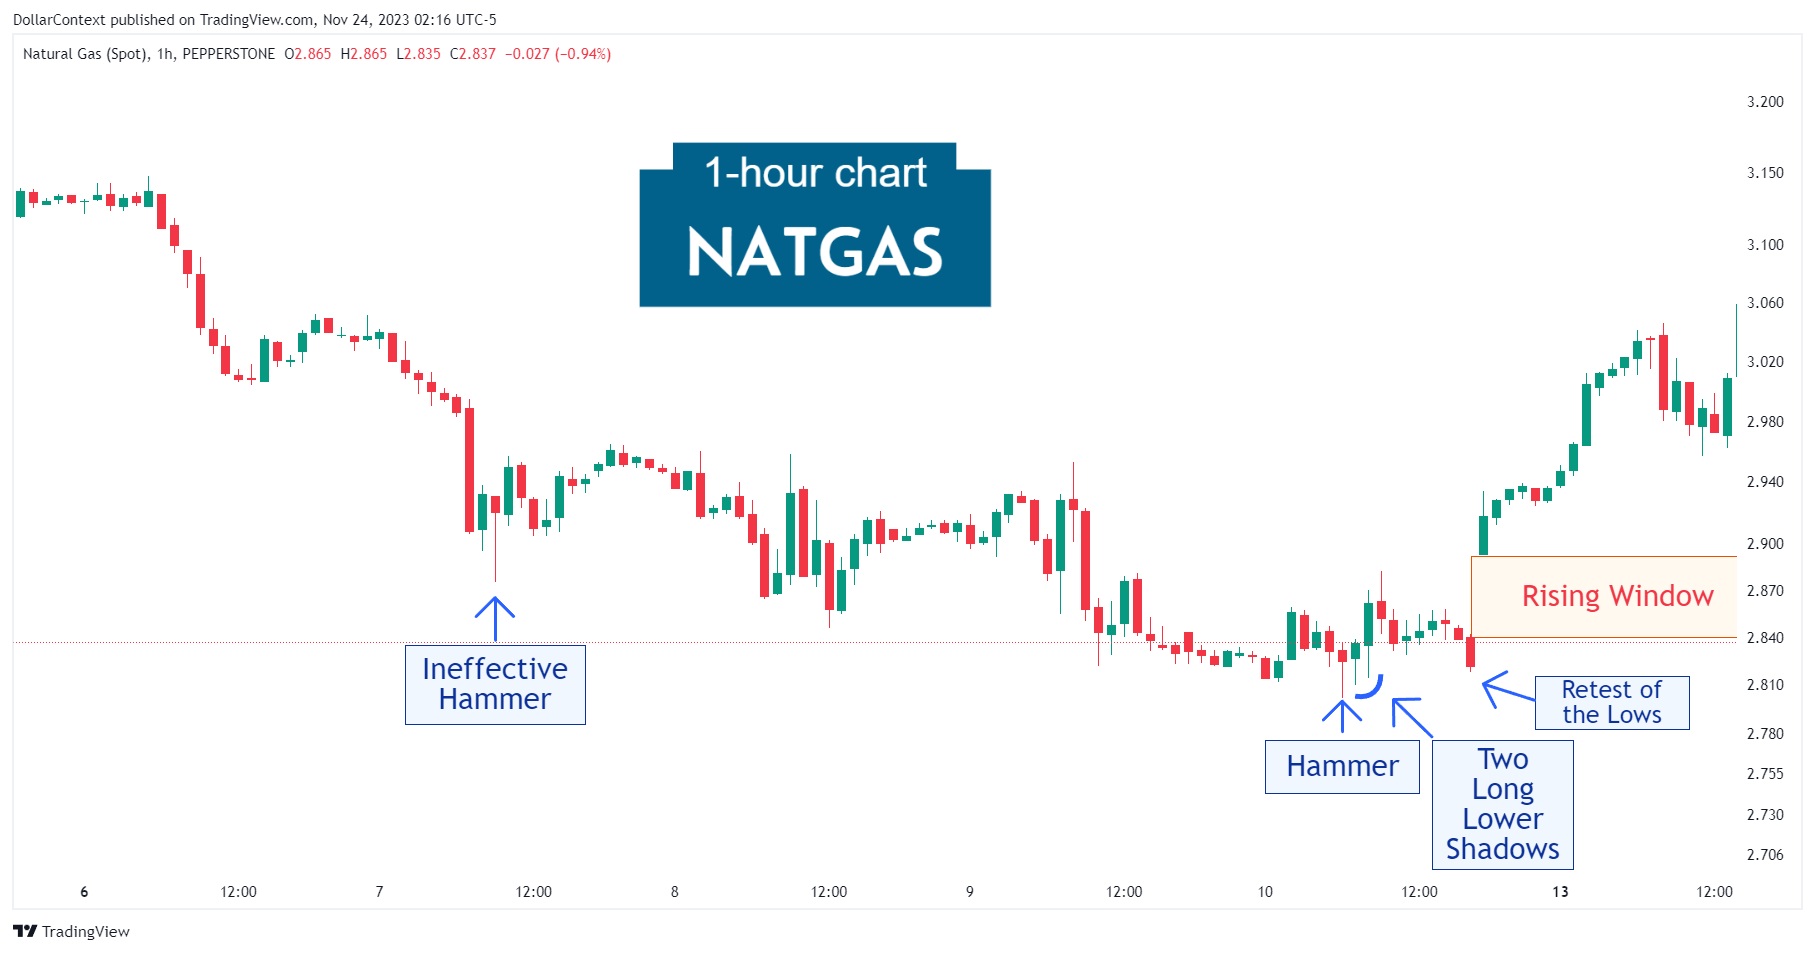
Following a distinct decline, the natural gas market displayed a hammer pattern. The following two sessions featured candlesticks with long lower shadows, confirming price rejection near the lows set by the hammer.
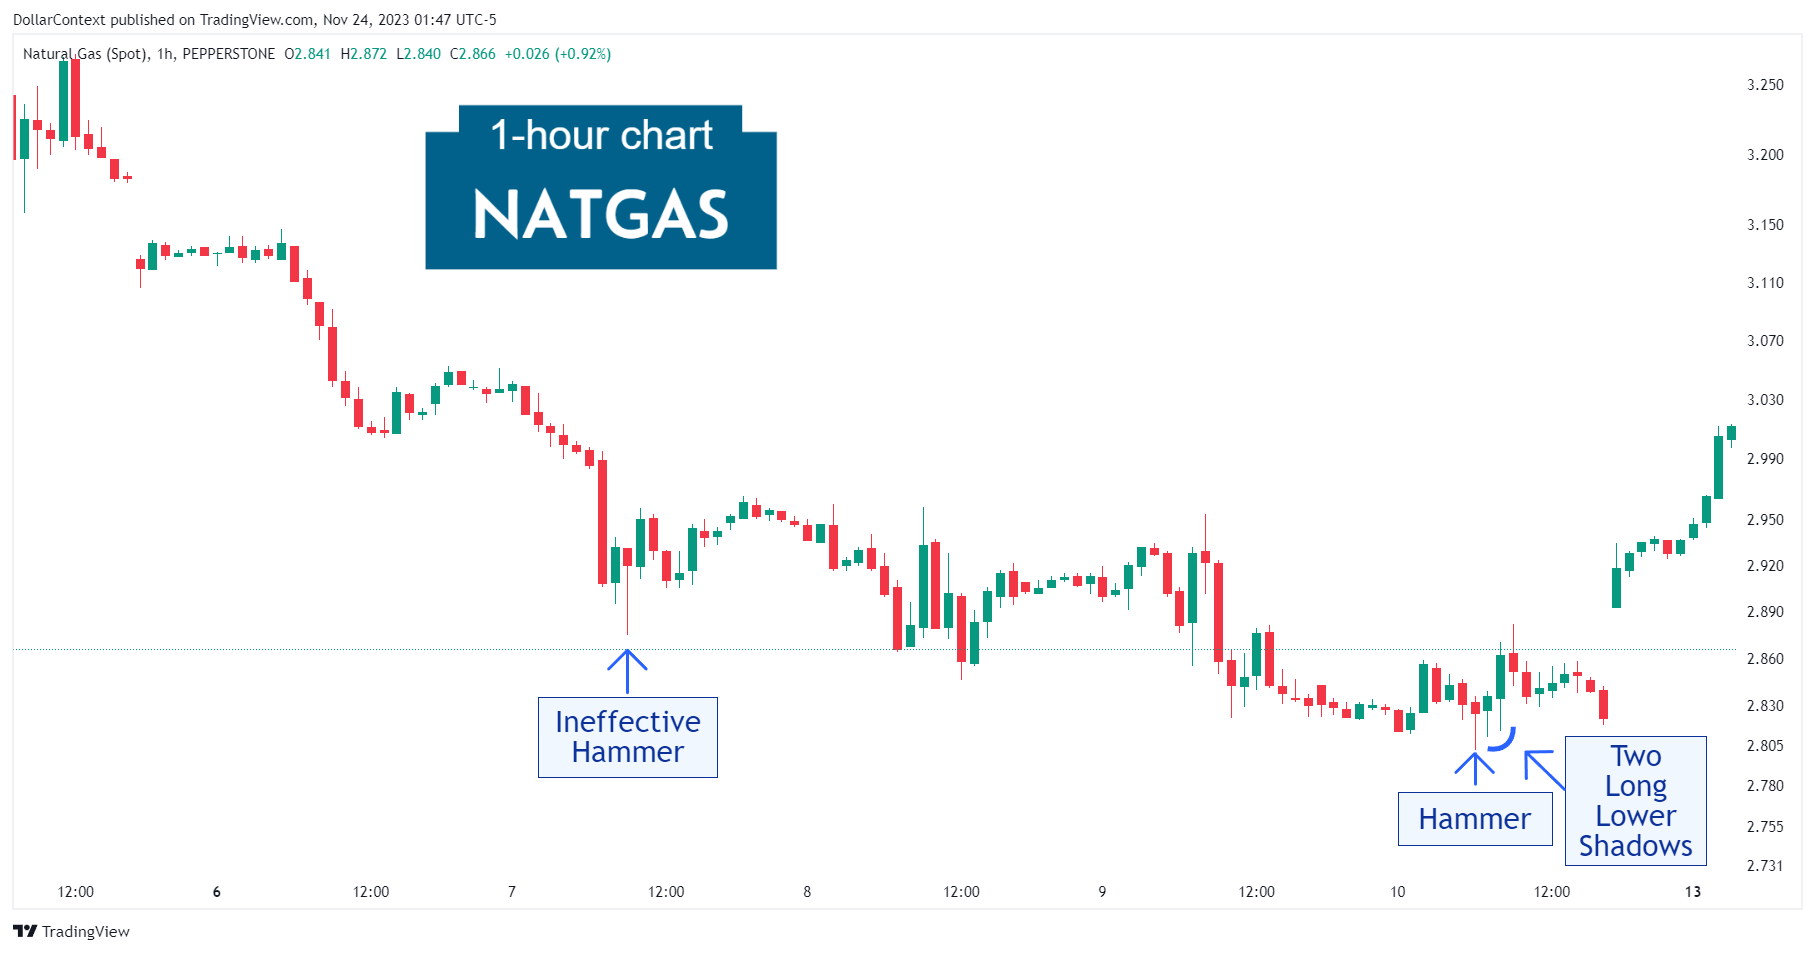
Three days prior, the AUD/USD pair exhibited a hammer pattern. It seems that the preceding downtrend hadn't fully matured at the time of this pattern's emergence, leaving some residual selling pressure to dissipate. Therefore, we classify this as an ineffective hammer.
2. Early Market Transition
Following a quick retest of the support zone, the market displayed a rising window (gap). This event significantly raised the chances of a successful bullish reversal.
3. Resolution
The chart below illustrates that the rising window preceded a minor rally.

4. Conclusion and Subjective Review
Although a bounce following a hammer can sometimes be unsuccessful (refer to the ineffective hammer discussed earlier), a bullish reversal may still occur below the initial hammer's lows. This was observed in November 2023 when the Natural Gas market reached a bottom, marked by the appearance of a second hammer and two long lower shadows falling beneath the price level established by the first hammer pattern.