
The Dangerous Plan of Trading Gold This Summer
It’s probably too early to initiate a long position here. The downward trend from the previous highs may still be in progress.

Should you trade gold this summer? Probably not, and here’s why.
Correlation Analysis
Until May 2023, the price of gold was driven by misleading rate expectations from the Federal Reserve. Specifically:
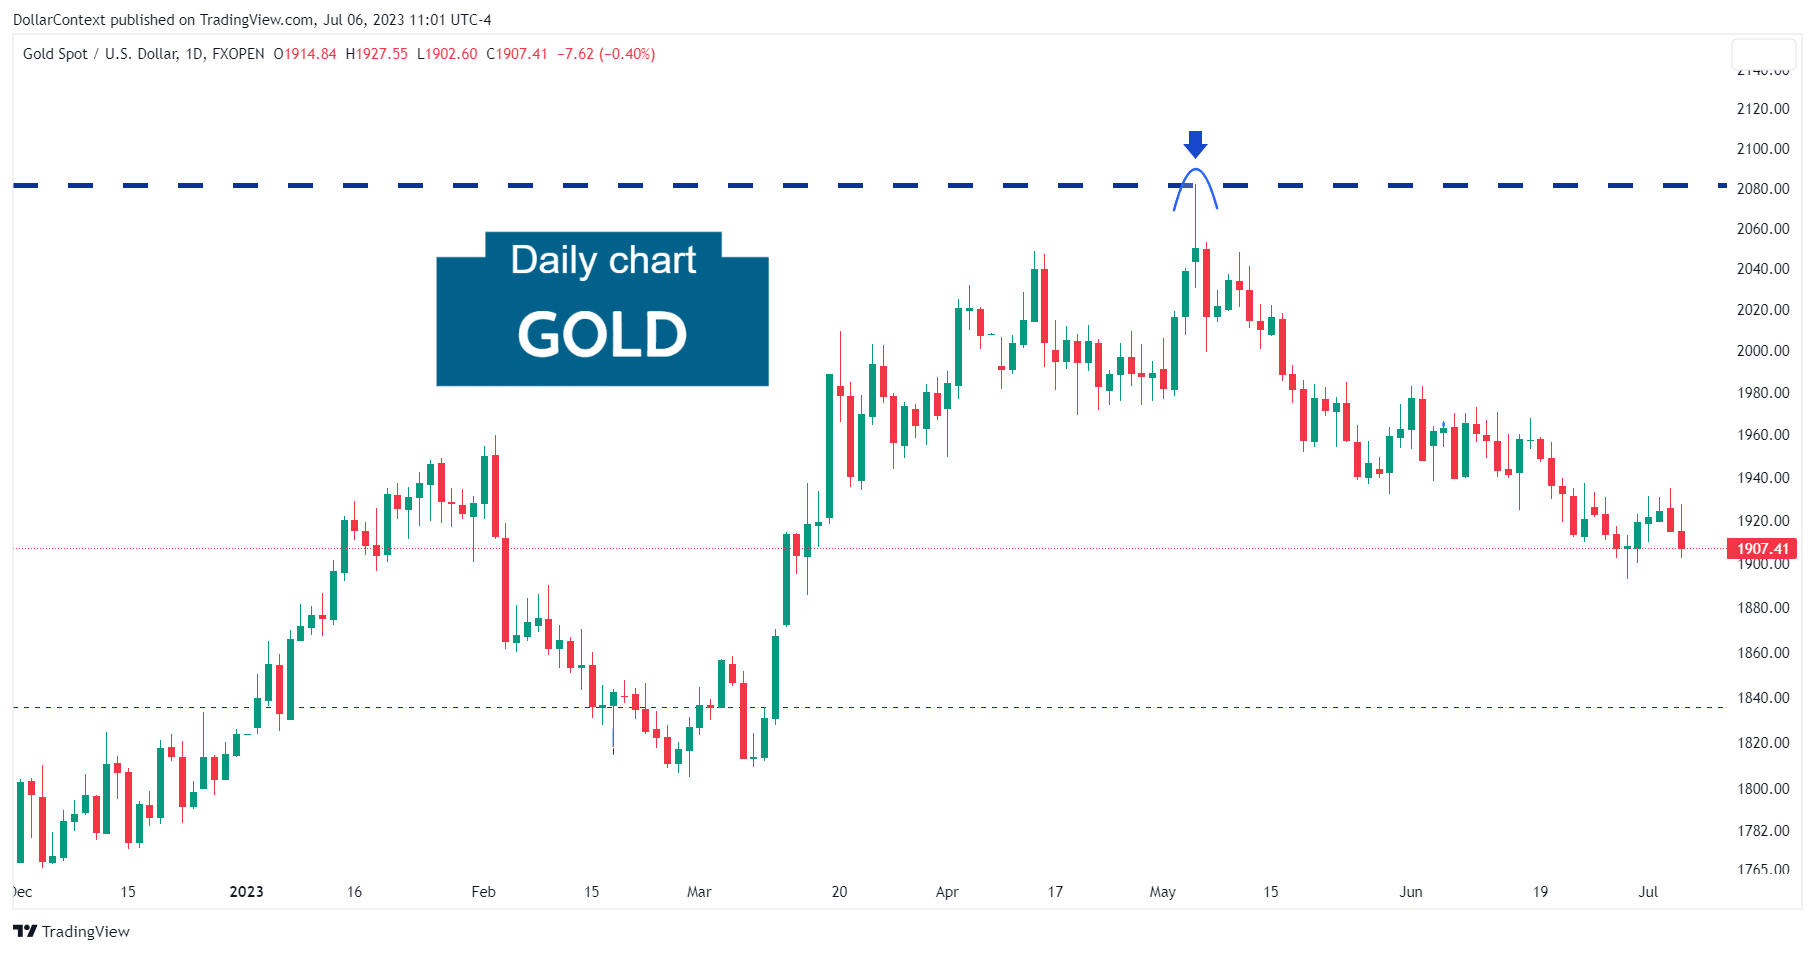
- Gold prices soared to a peak of $2080 in May 2023 due to the false belief that the Federal Reserve was nearing the conclusion of its hiking cycle.
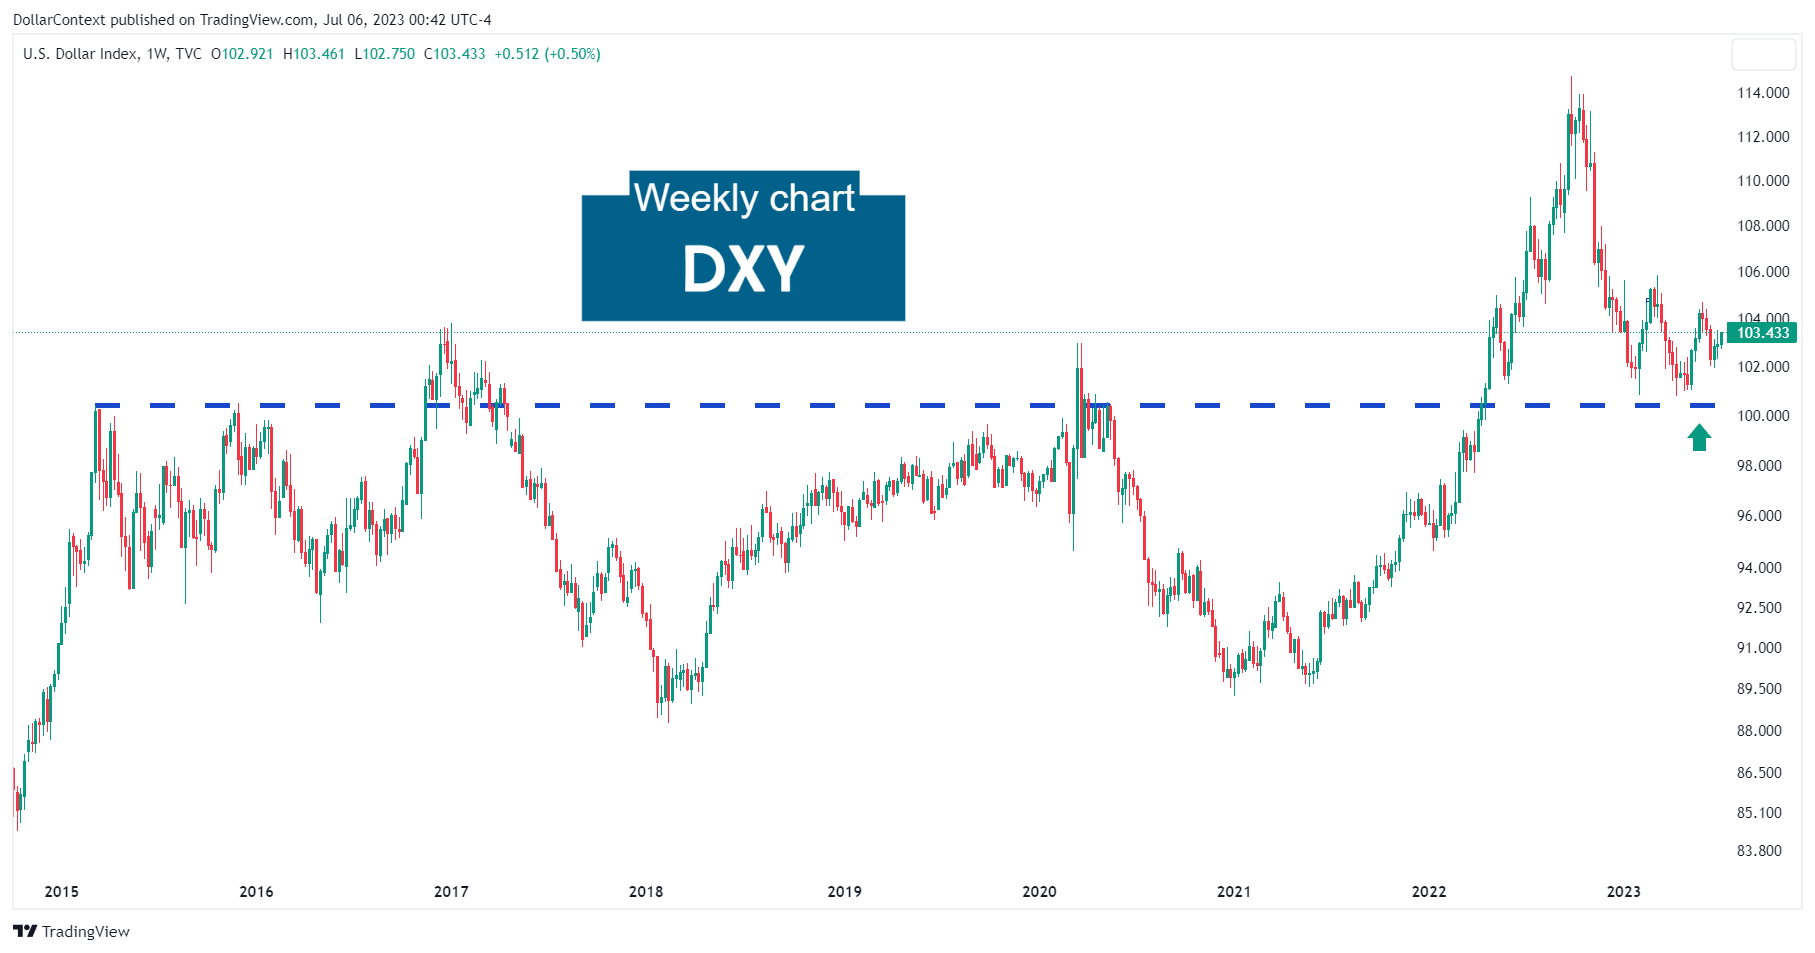
- Between September 2022 and April 2023, the appreciation of gold was amplified by the decline of the dollar index (DXY). However, as illustrated on the chart below, the DXY has shown signs of recovering from a historical support level.
Despite recent recession fears, the Fed has been much more hawkish than expected. Therefore, rates can remain higher for longer.
Given the substantial drop from its peak, we wouldn't take a short position on gold at this level. The risk/reward ratio is clearly adverse.
Candlestick Analysis
Technically, a long upper shadow candle during the first week of May 2023 (see the blue arrow on the chart) foreshadowed a substantial decline that, apparently, it’s still running its course.
The following chart shows that:
- The size of the long upper shadow is notable, if not impressive.
- The long upper shadow emerged at a historical resistance level.
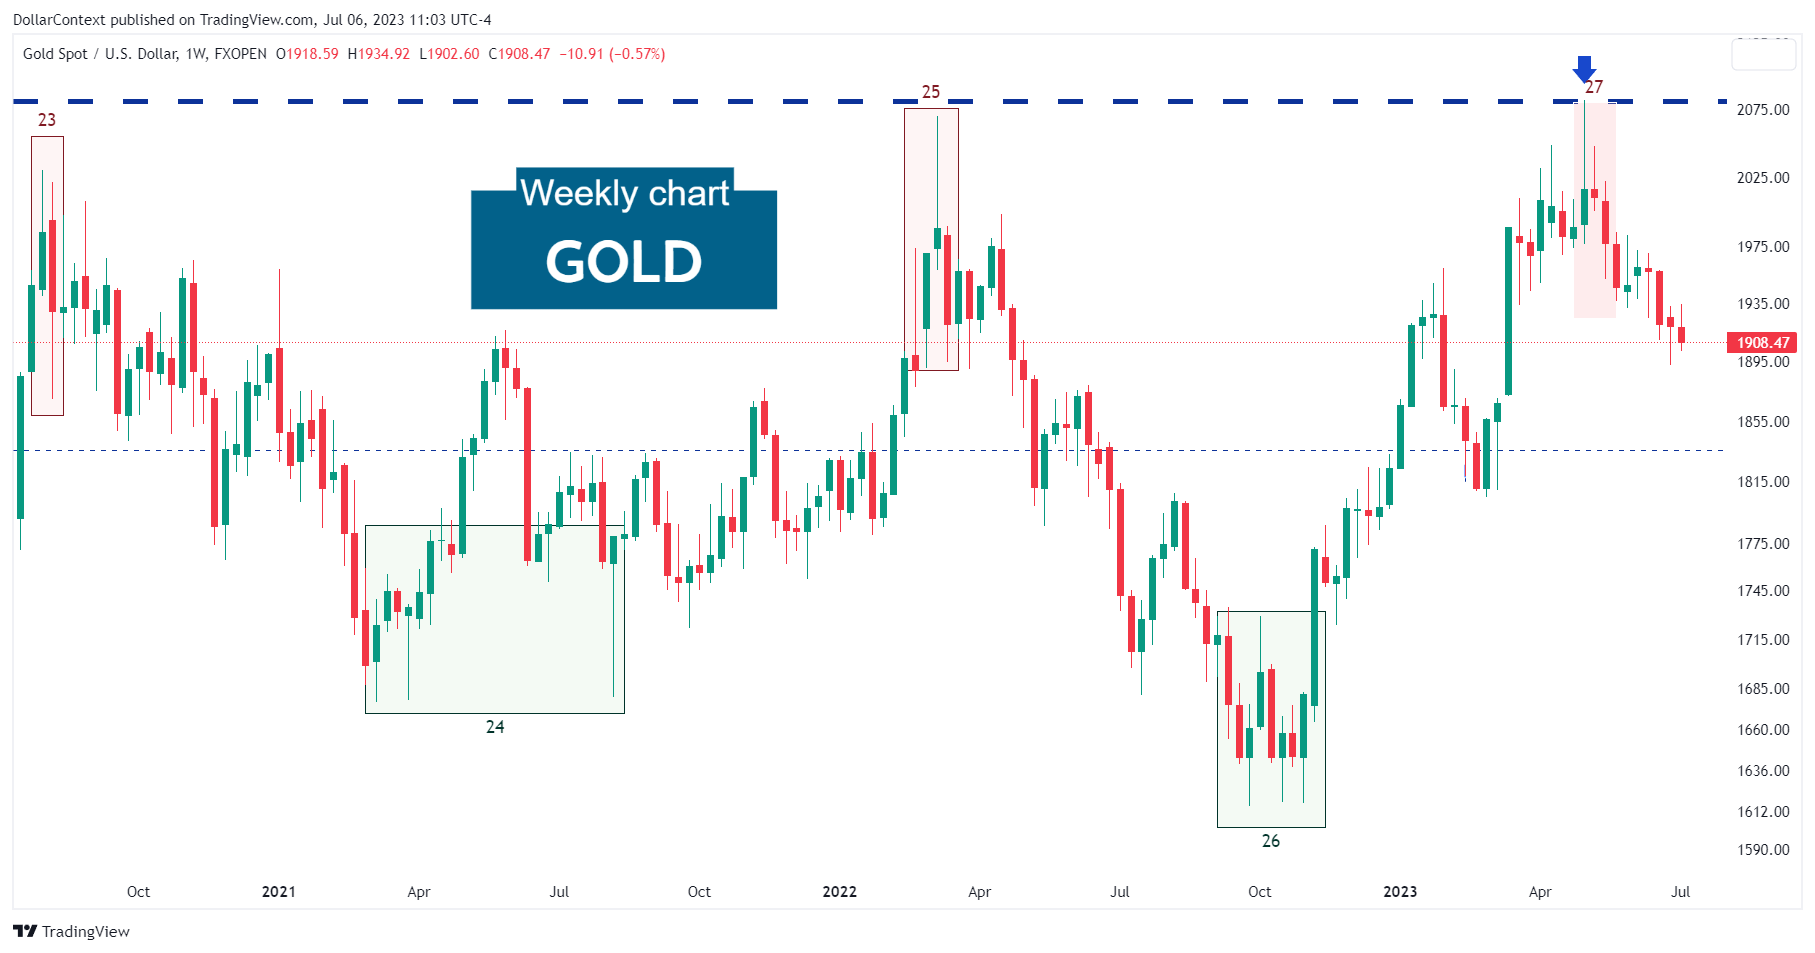
The downward trend from the previous highs may still be in progress.
It’s probably too early to initiate a long position here. The remarkable size of the long upper shadow candle at a key resistance level presages a more extended downturn that could last for months.


