
Case Study 0030: Hammer and Engulfing Pattern (Gold)
In this article, we will discuss the performance of the gold market after the appearance of a hammer and a bullish engulfing pattern.

In this article, we will discuss the performance of the gold market after the appearance of a hammer and a bullish engulfing pattern.

After experiencing a strong uptrend, the USD/JPY formed a bearish engulfing pattern, characterized by a hanging man candlestick as the second candle in the formation.

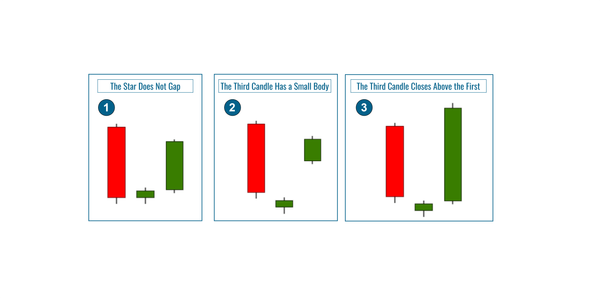
This article covers the criteria and conditions to qualify a morning star pattern as a bullish reversal indicator.

In this article, we will examine the performance of the natural gas market after the emergence of a hammer and two long lower shadows.

The configuration of the morning star has resemblances to other candlestick patterns, including the hammer, the tower bottom, and the doji.

In this article, we will discuss the performance of the Dollar Index after an evening star and engulfing pattern.

We can distinguish three primary types of morning stars: standard morning star, morning doji star, and abandoned baby bottom.
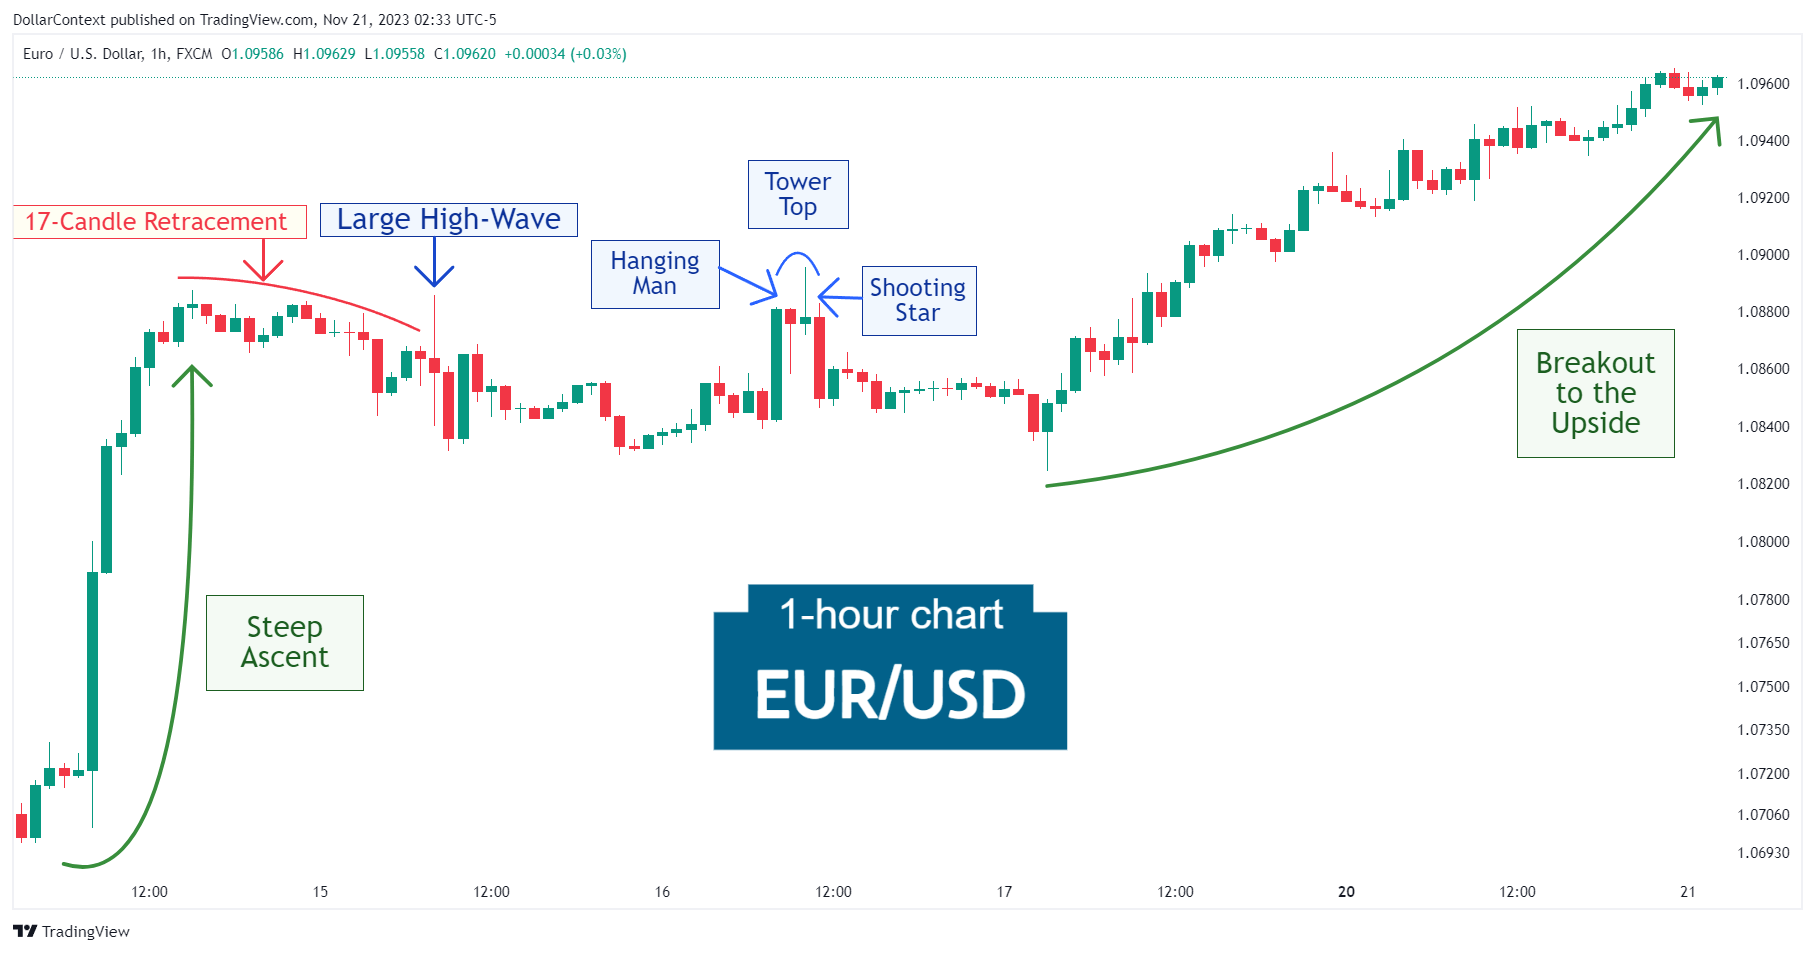
In this article, we will discuss the performance of the EUR/USD after the emergence of a high-wave candle in a consolidation phase.
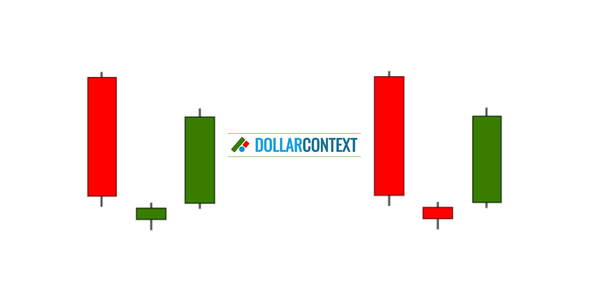
While the morning star can serve as a useful instrument for traders, it's important to keep in mind its limitations and the skepticism that surrounds this pattern.
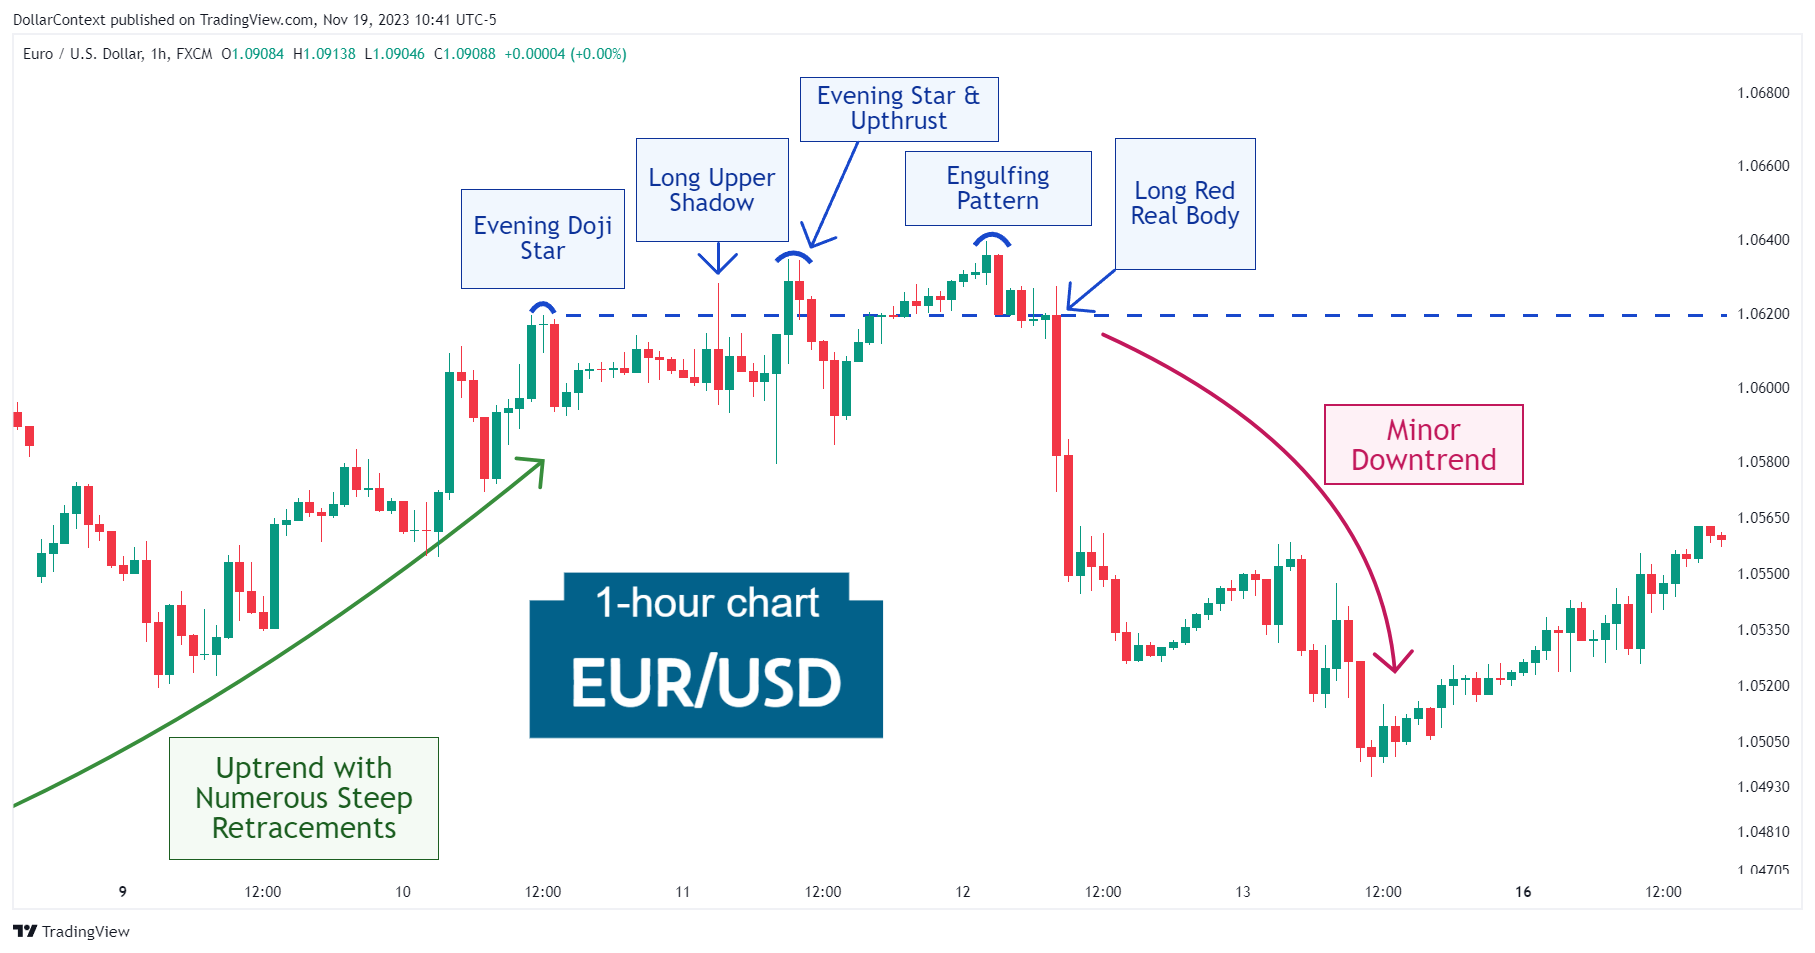
In this article, we will discuss the performance of the EUR/USD after the emergence of a series of bearish patterns.
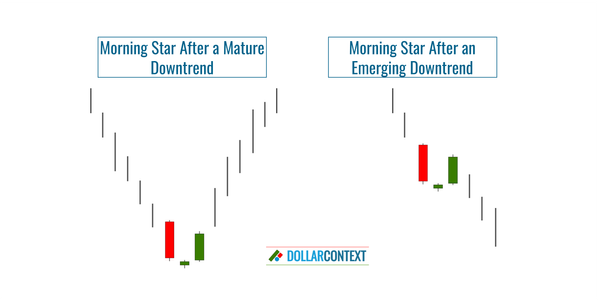
We discuss the implications of the morning star pattern in different market scenarios, including downtrends and lateral movements.
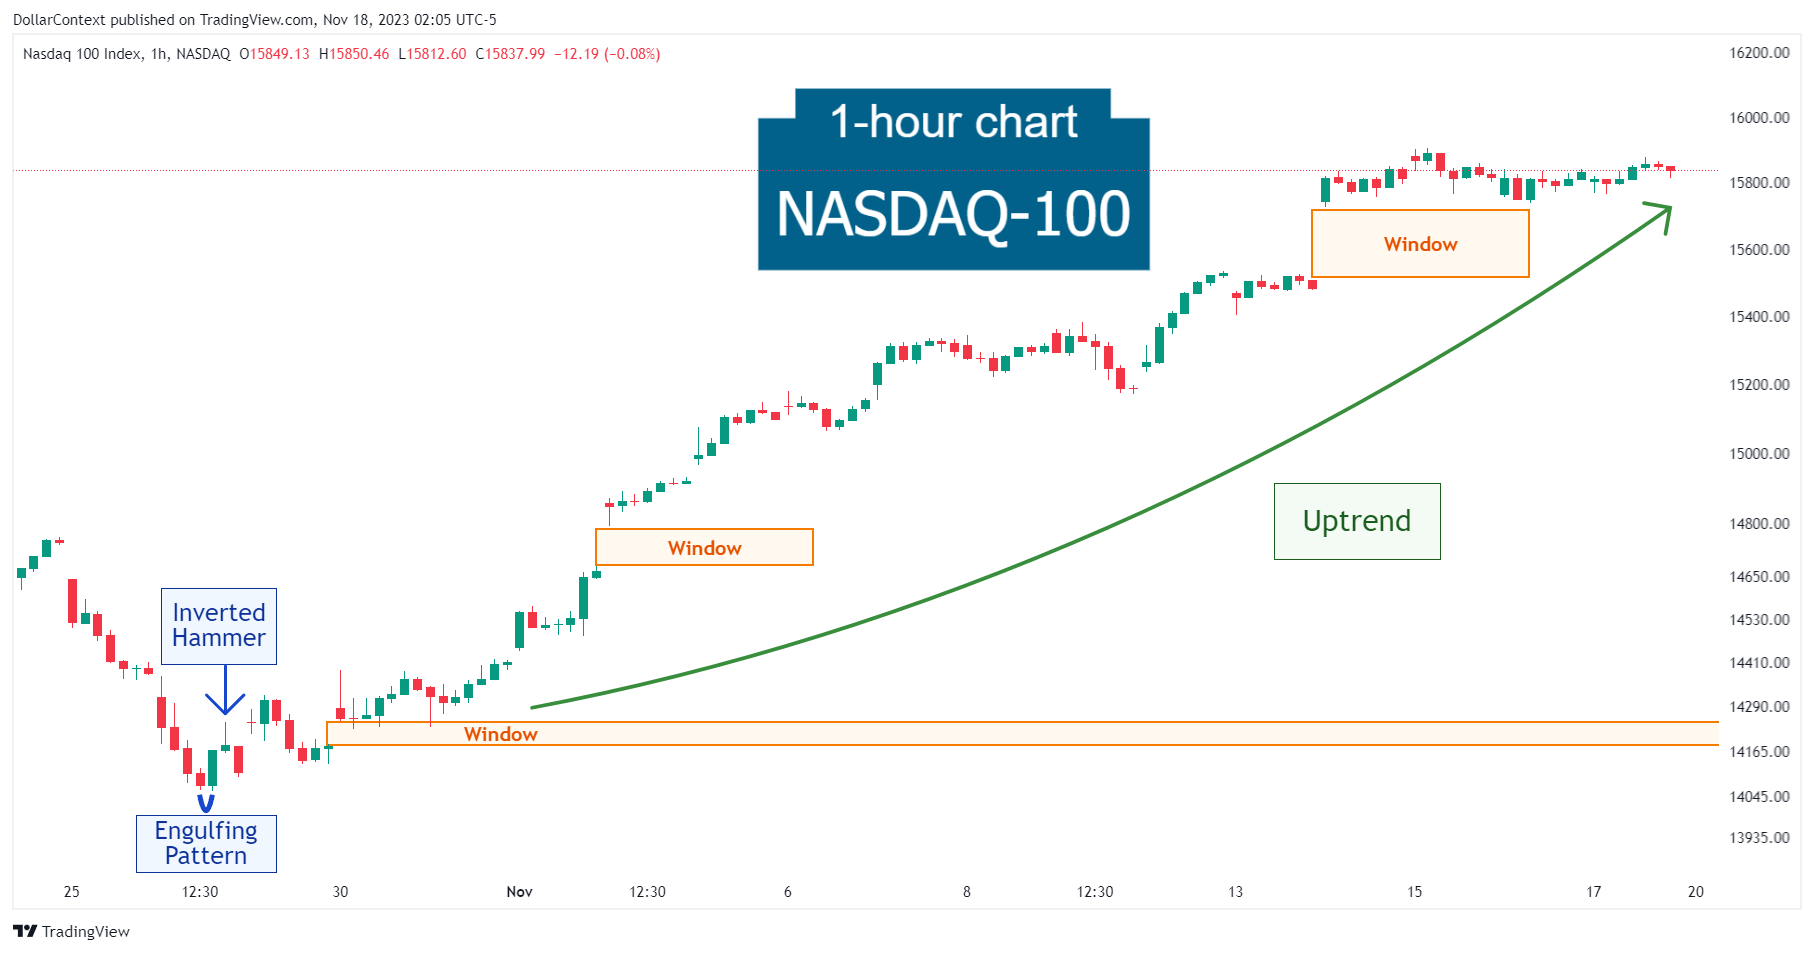
In this article, we will examine the performance of the Nasdaq-100 market after the emergence of an engulfing pattern, an inverted hammer, and a rising window.
CANDLESTICK
Variations of the morning star pattern that may not perfectly align with the ideal form can still be valid, given certain market conditions.
CANDLESTICK
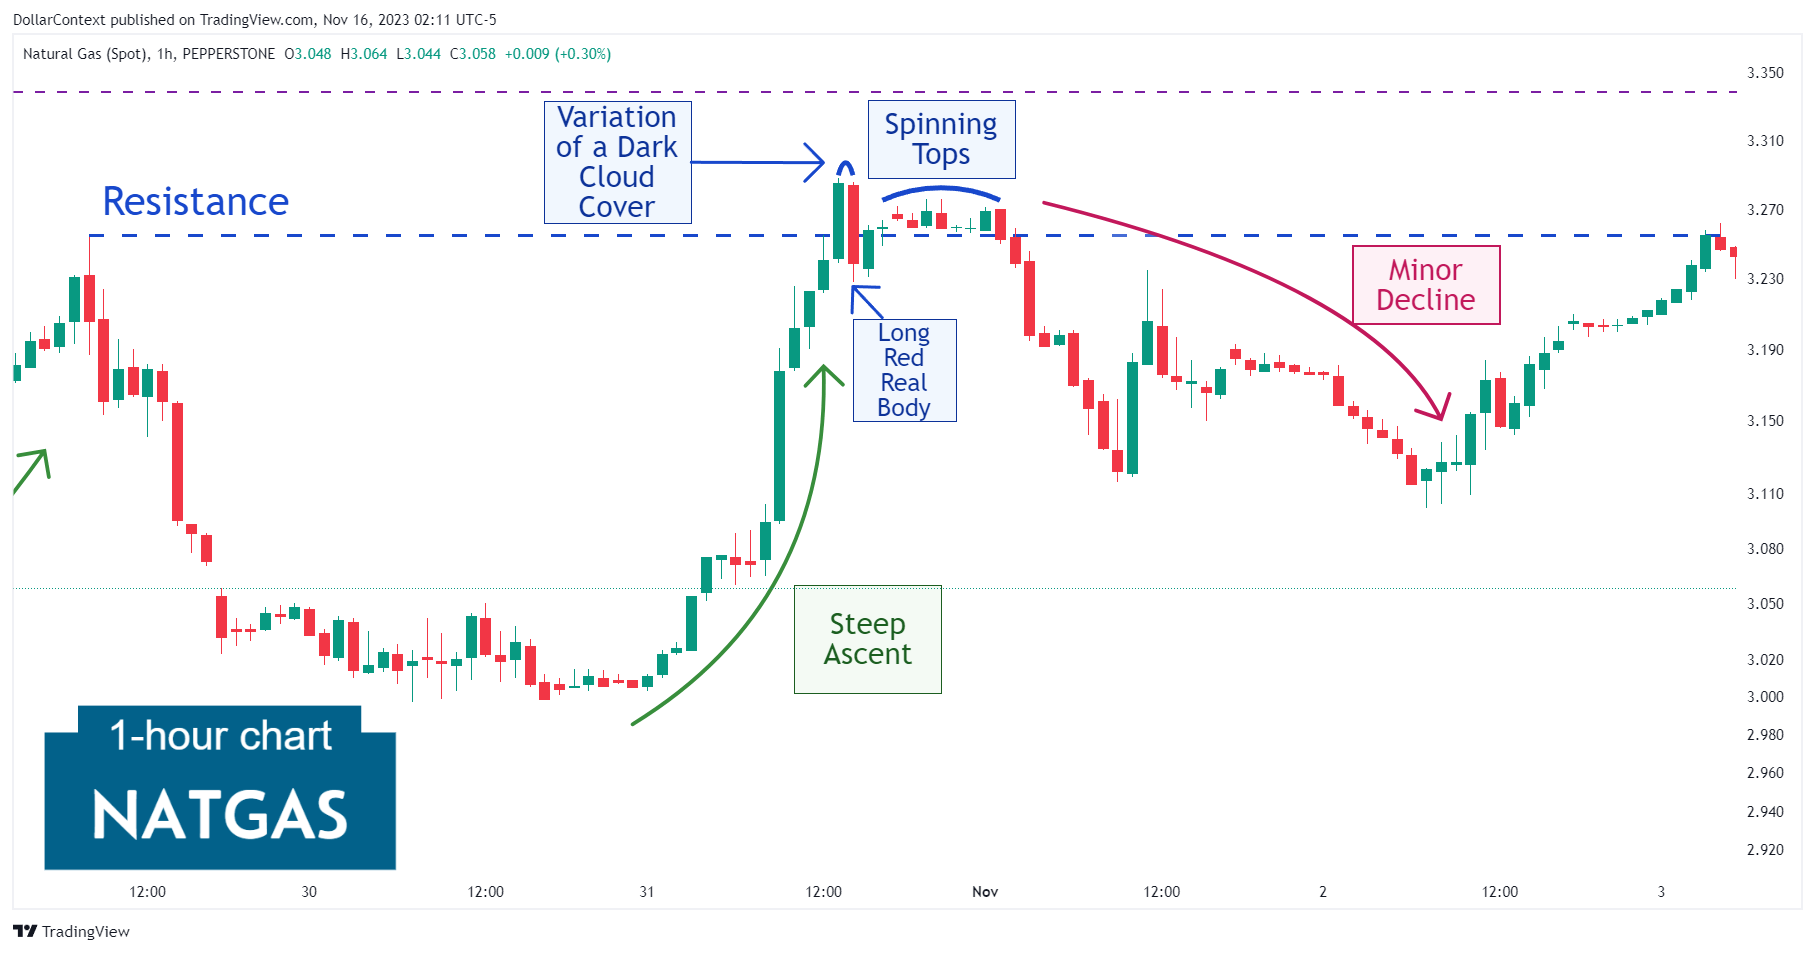
In this article, we will examine the performance of the natural gas market after the emergence of a dark cloud cover and a long black real body.
STOP-LOSS
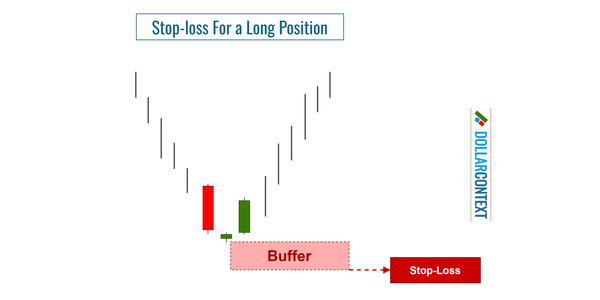
In this post, we'll explore effective strategies to set a stop-loss when using a morning star pattern to initiate a long position.
CANDLESTICK
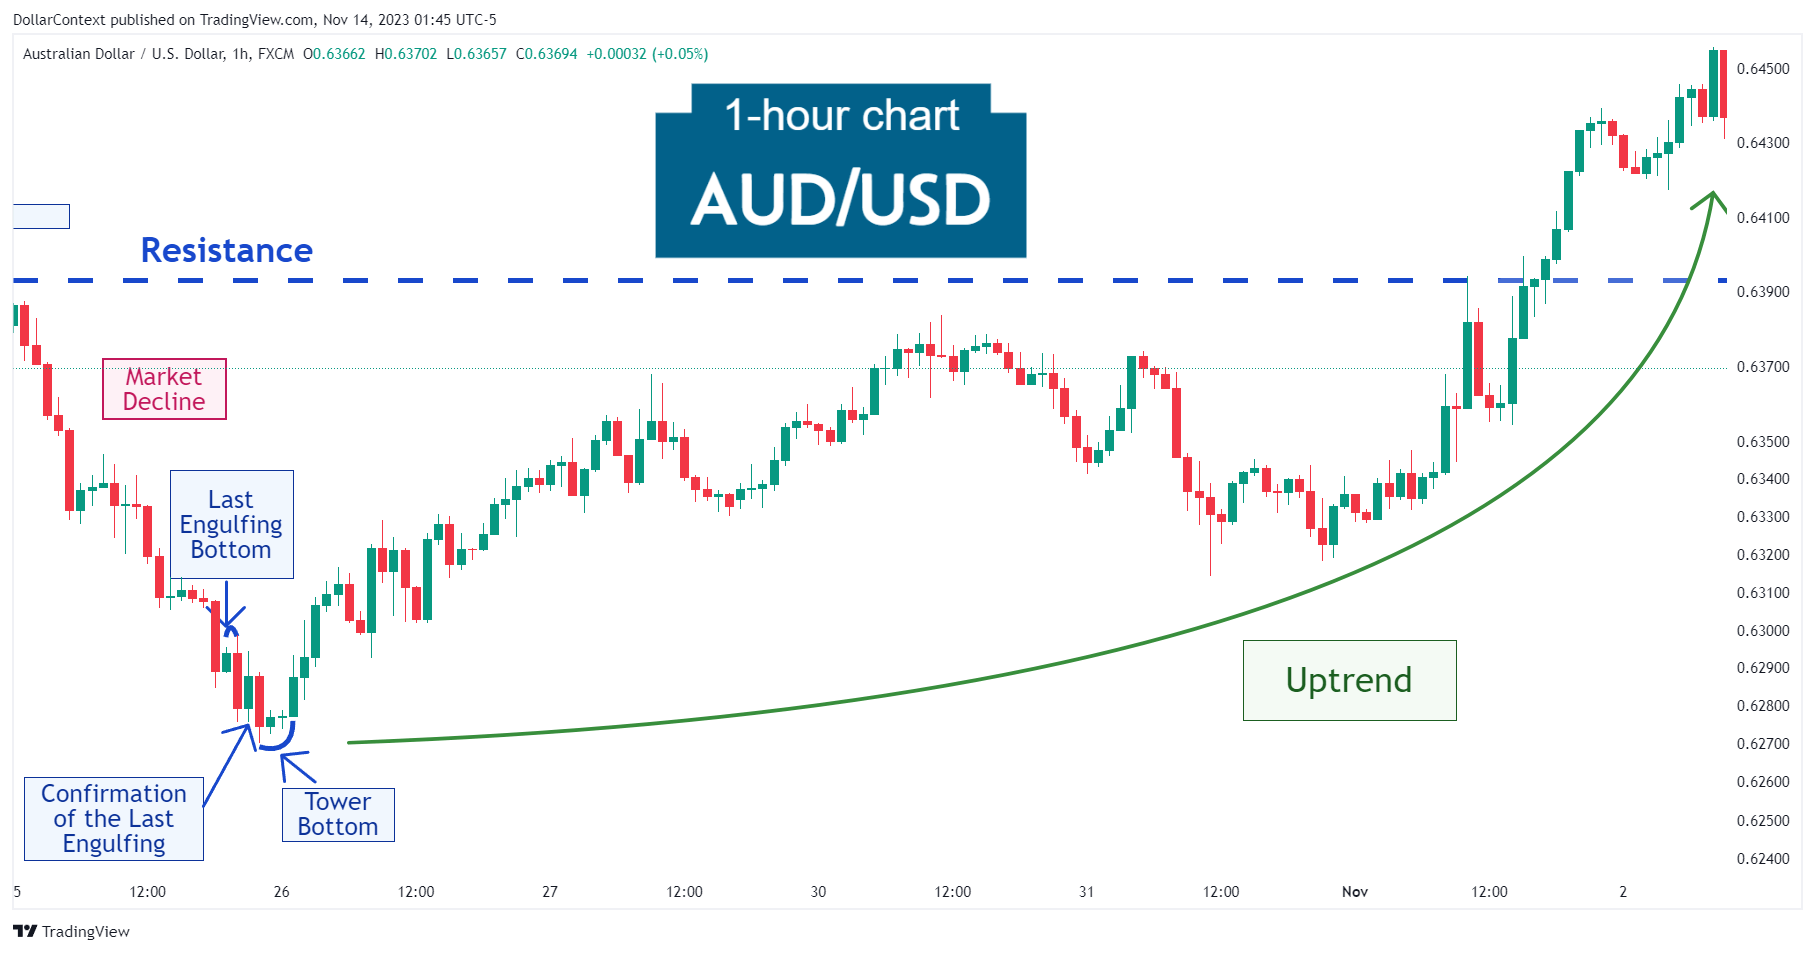
In this article, we will cover the performance of the AUD/USD after the emergence of a last engulfing bottom and a tower bottom.
CANDLESTICK
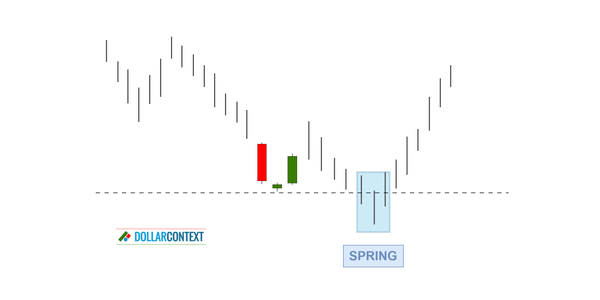
After a downtrend, the price range associated with a morning star pattern becomes support.
CANDLESTICK
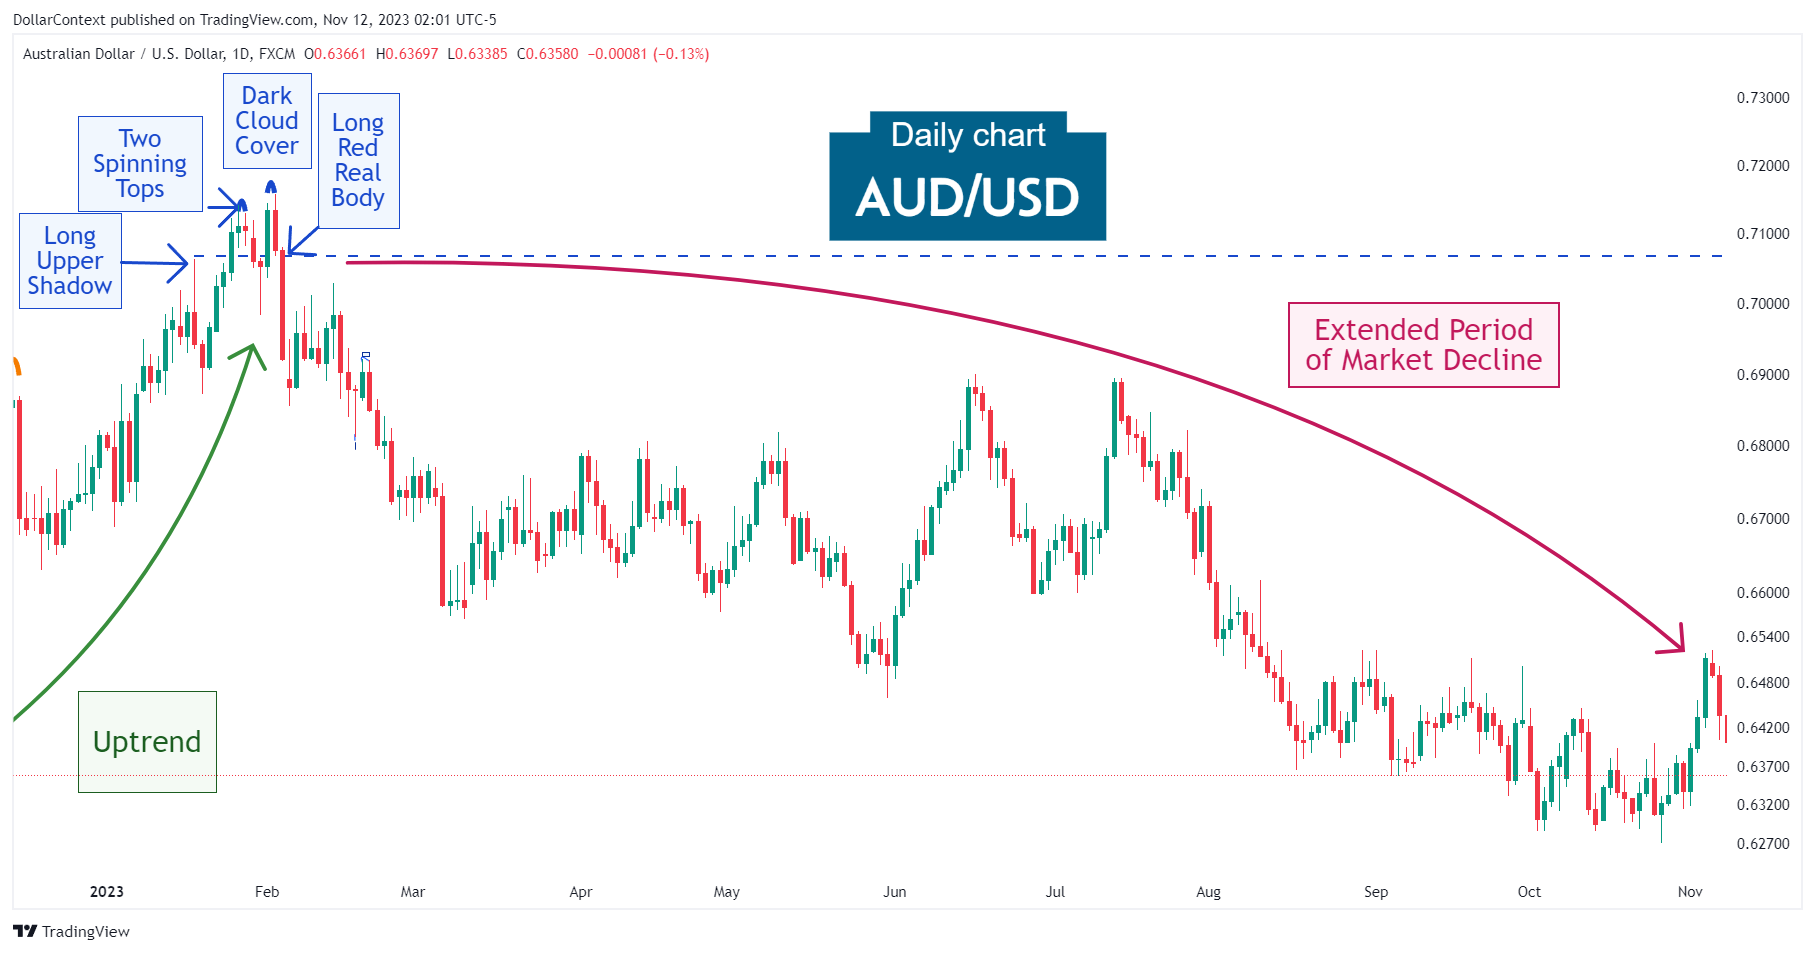
In this article, we will cover the performance of the AUD/USD after the emergence of a long upper shadow and a dark cloud cover.
CANDLESTICK
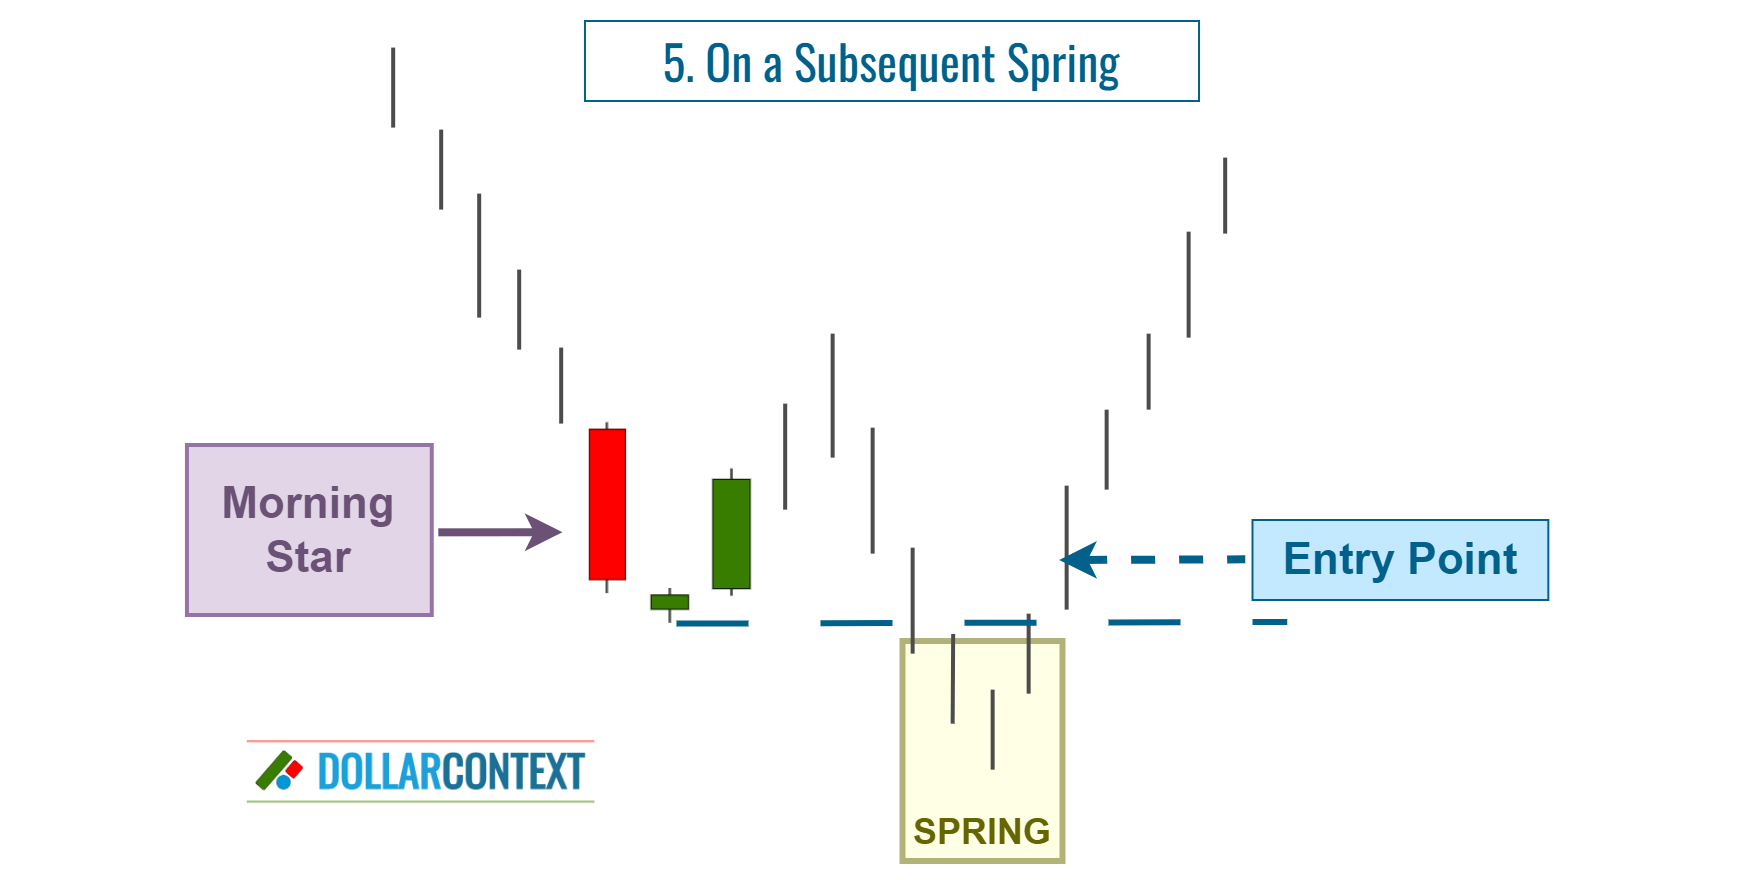
In this article, we'll discuss the different options for entry points after the appearance of a morning star pattern.
CANDLESTICK
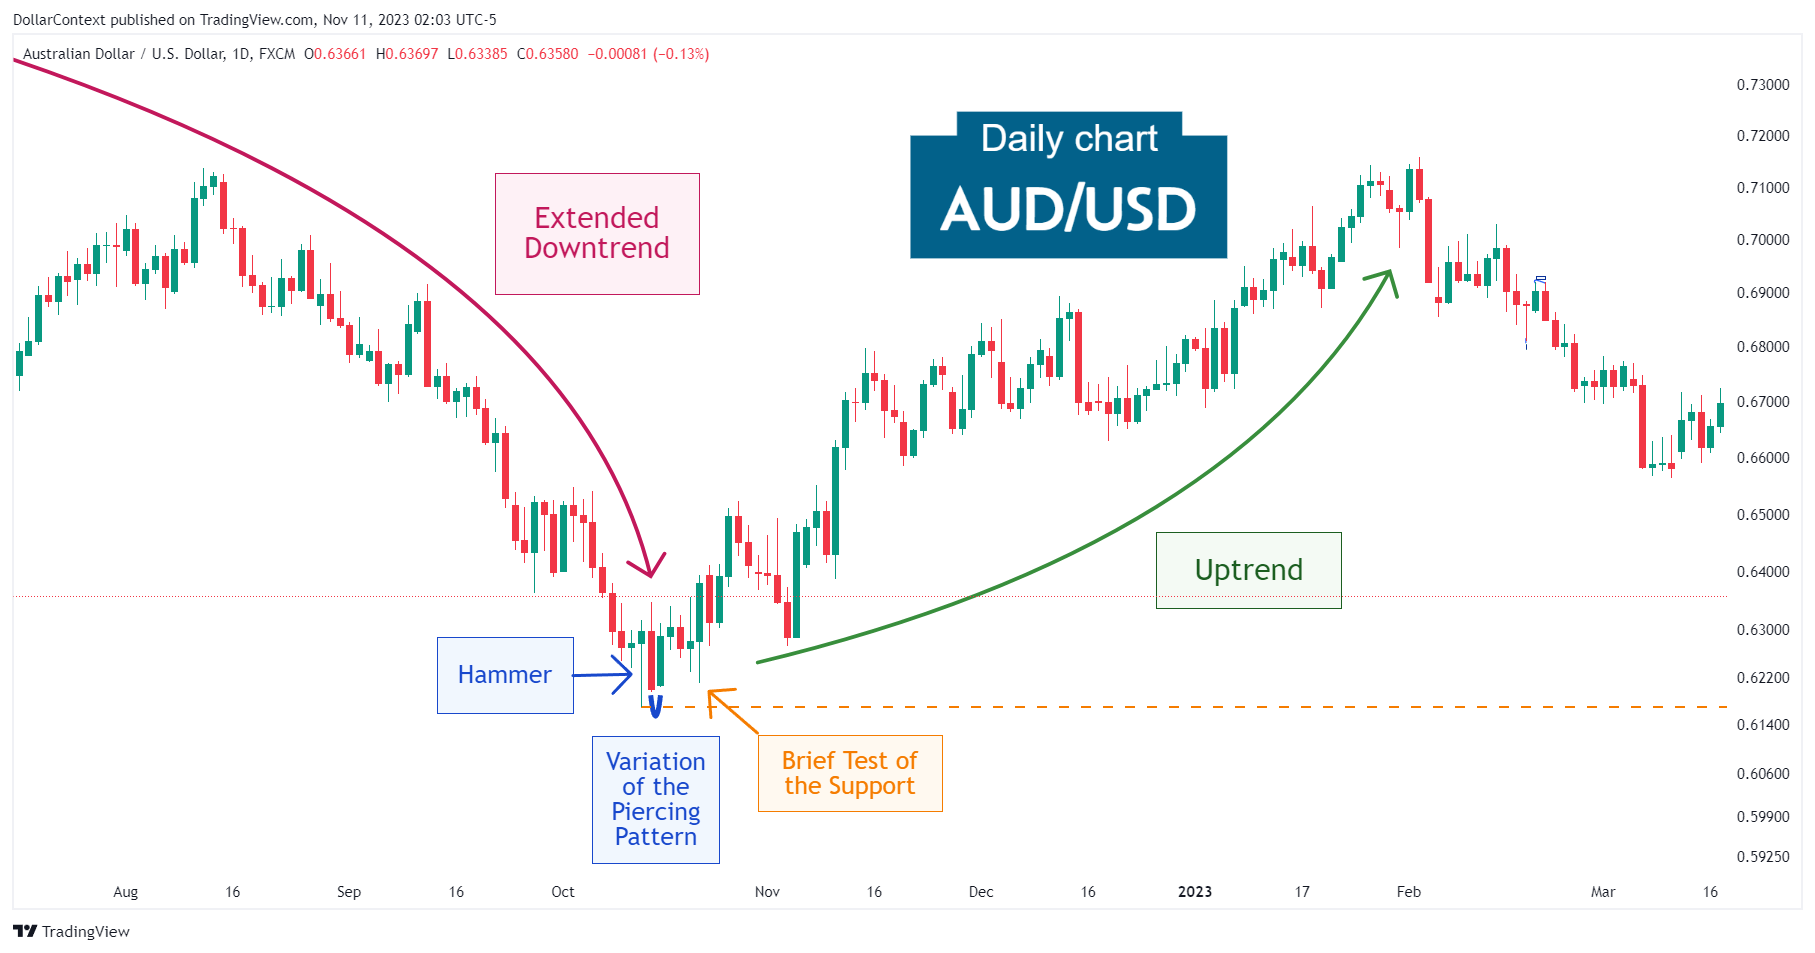
In this article, we will cover the performance of the AUD/USD after the emergence of a hammer and a piercing pattern.

CANDLESTICK
The psychology behind a morning star pattern reveals a shift in market sentiment from bearish to bullish, usually occurring after a downtrend.
CANDLESTICK
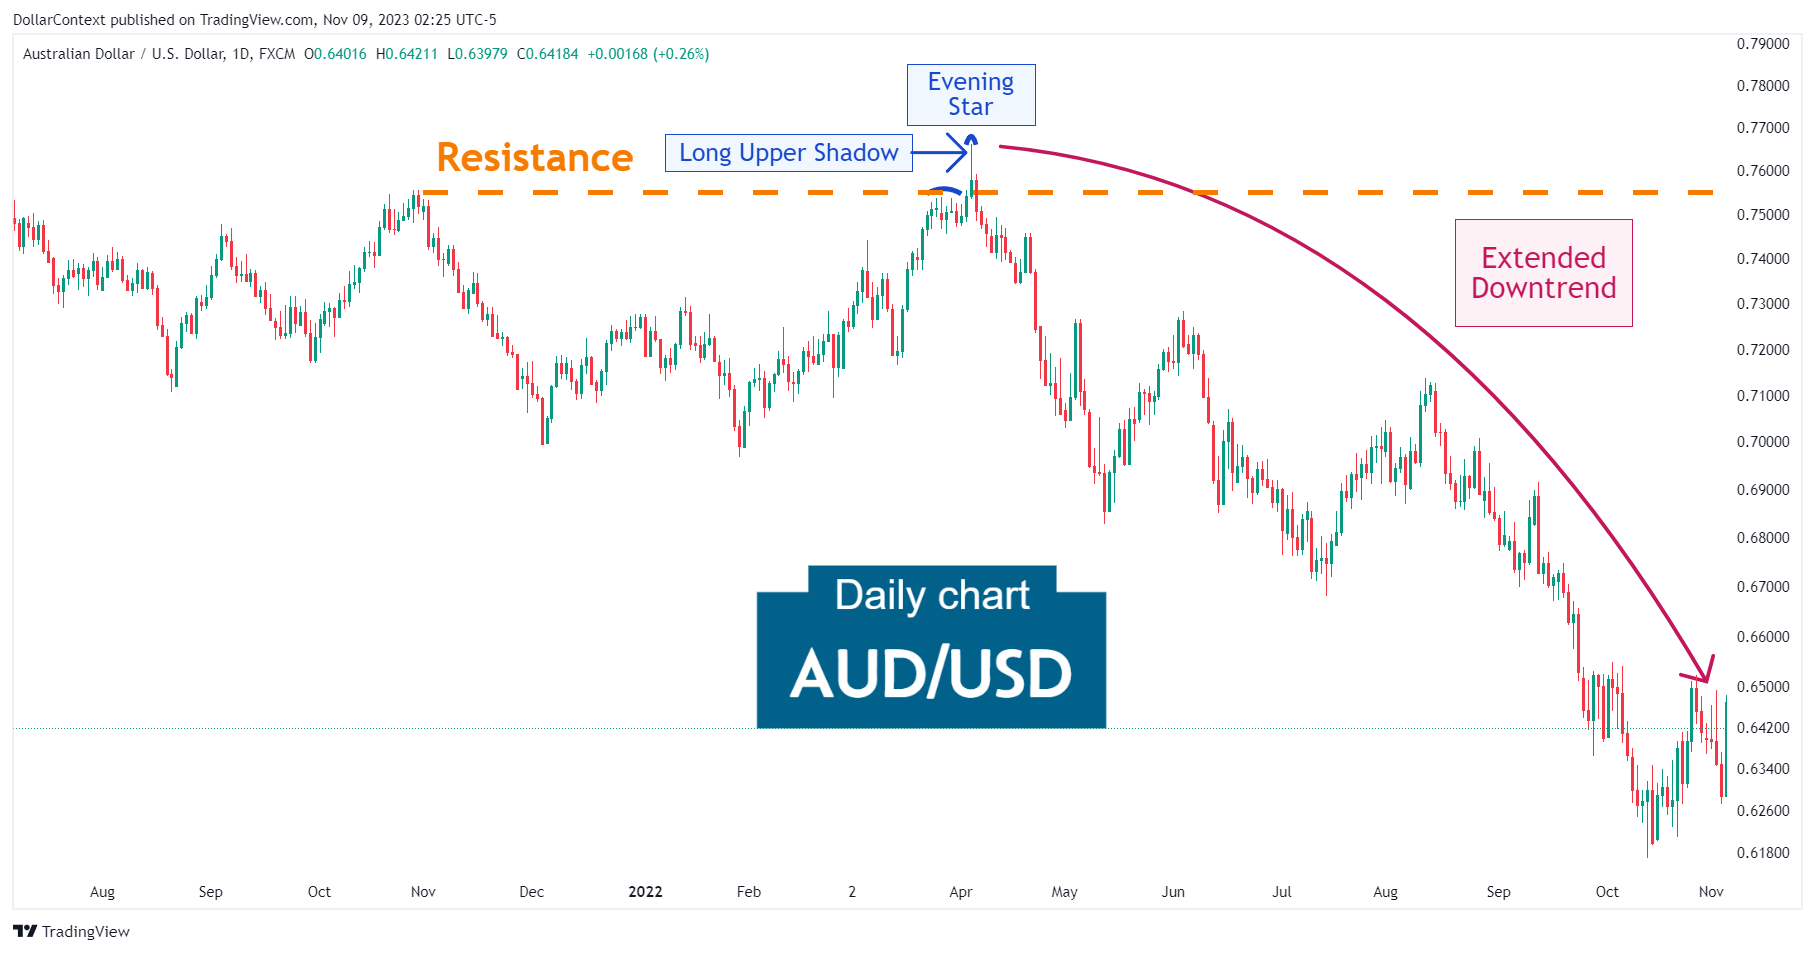
In this article, we will cover the performance of the AUD/USD after the emergence of a long upper shadow and an evening star pattern.
CANDLESTICK
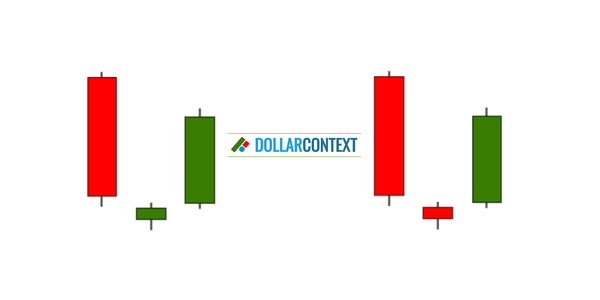
In this article, we'll explore the layout of a morning star pattern in Japanese candlestick analysis and how to identify this bullish reversal indicator.
CANDLESTICK
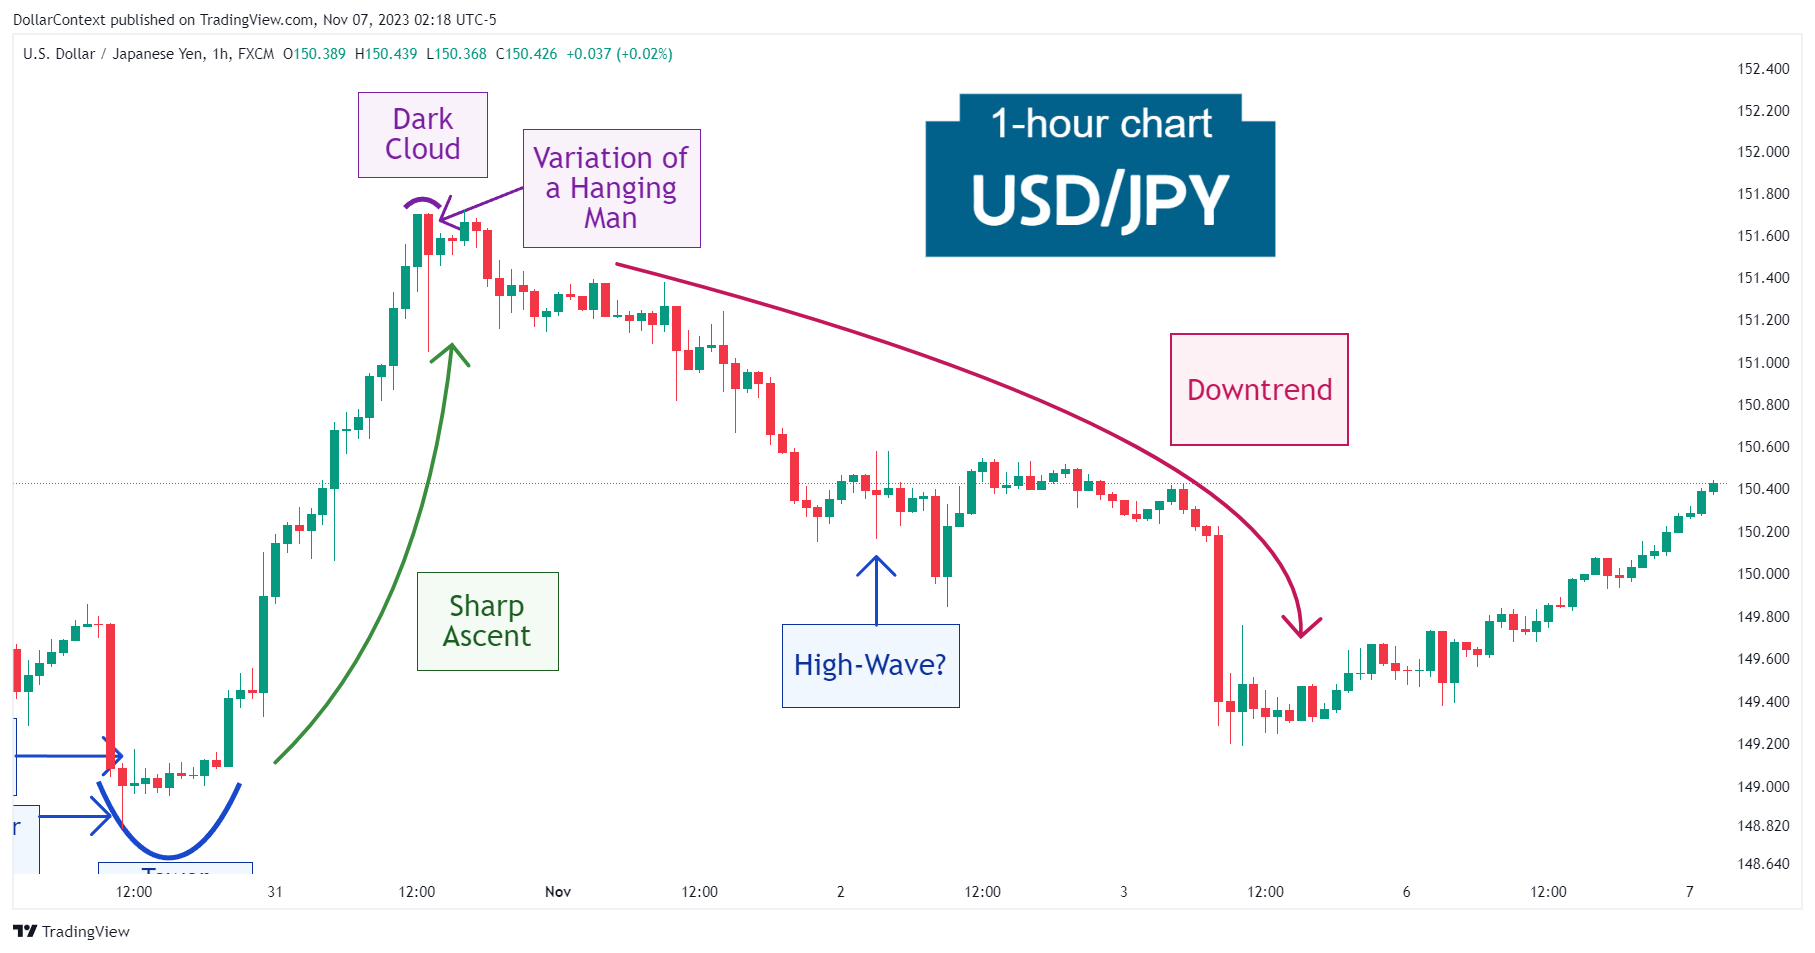
After a sharp rise of approximately 1.8 percent within an 18-hour timeframe, the USD/JPY presented a dark cloud cover and a hanging man candle line.