CANDLESTICK
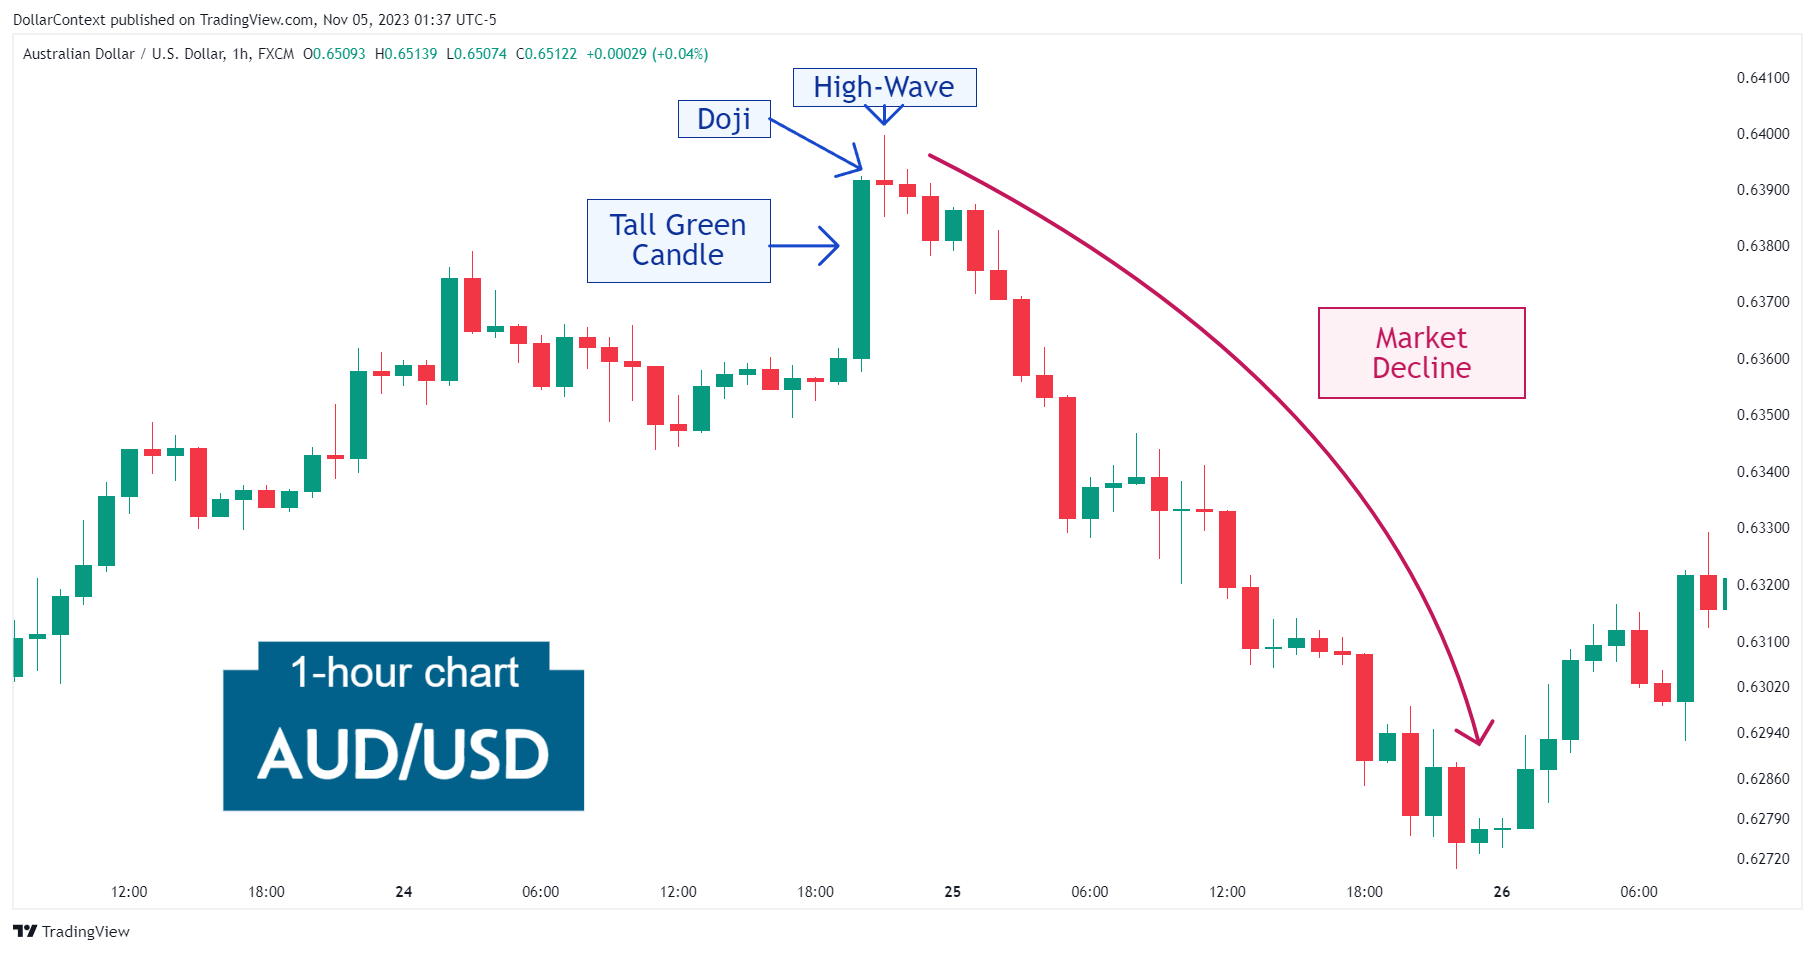
Case Study 0017: High-Wave and Doji After a Tall Green Candle (AUD/USD)
In this article, we will cover the performance of the AUD/USD after the emergence of a high-wave pattern.

CANDLESTICK
In this article, we will cover the performance of the AUD/USD after the emergence of a high-wave pattern.
CANDLESTICK
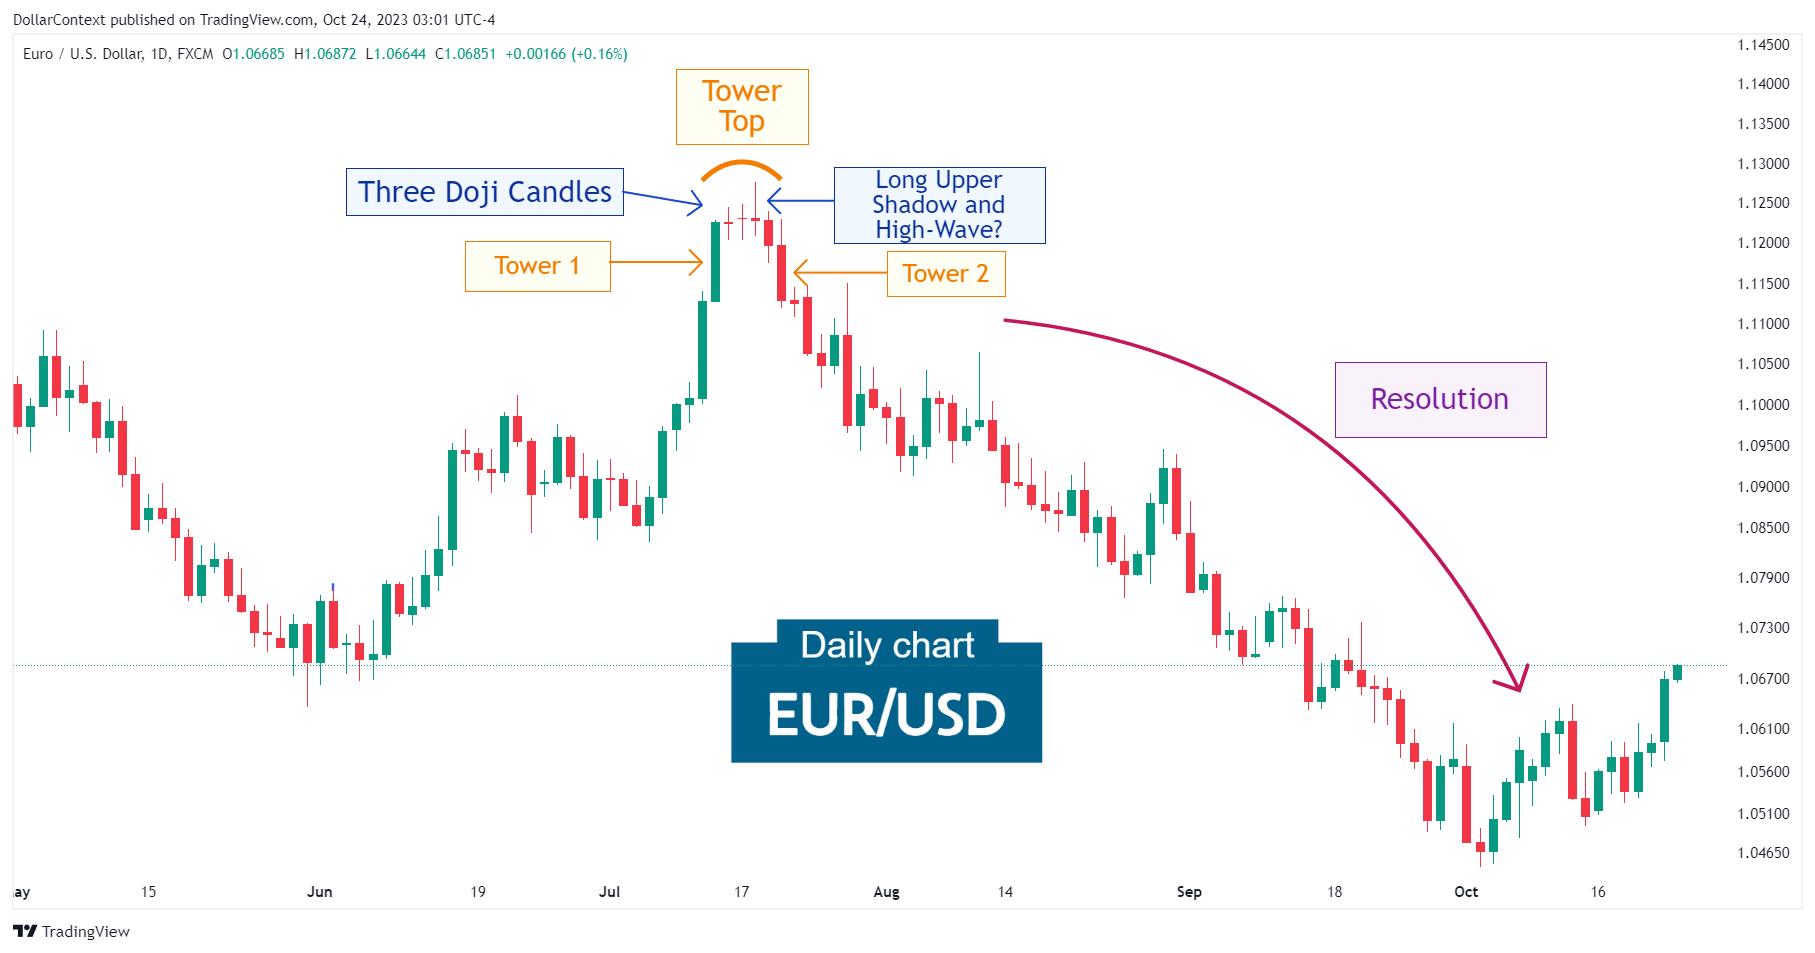
In this article, we will discuss the performance of the EUR/USD after the emergence of a series of doji sessions and a tower top.
CANDLESTICK
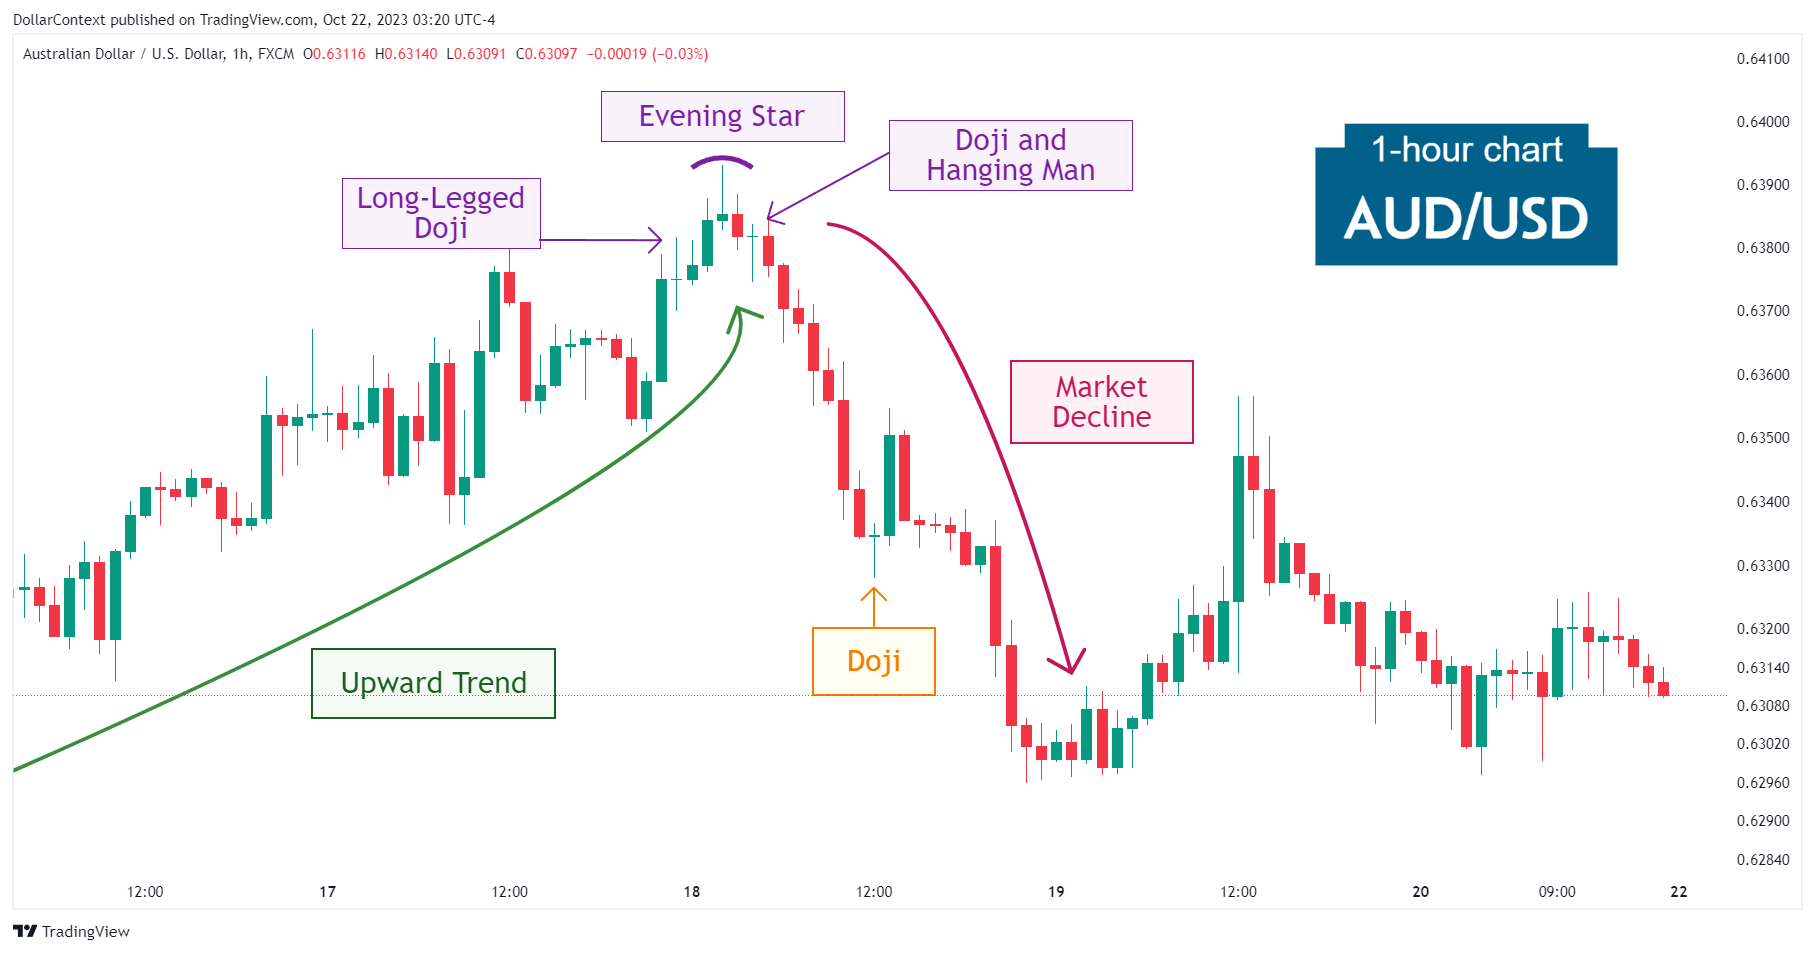
In this article, we will cover the performance of the AUD/USD market after the appearance of an evening star and shooting star pattern.
CANDLESTICK
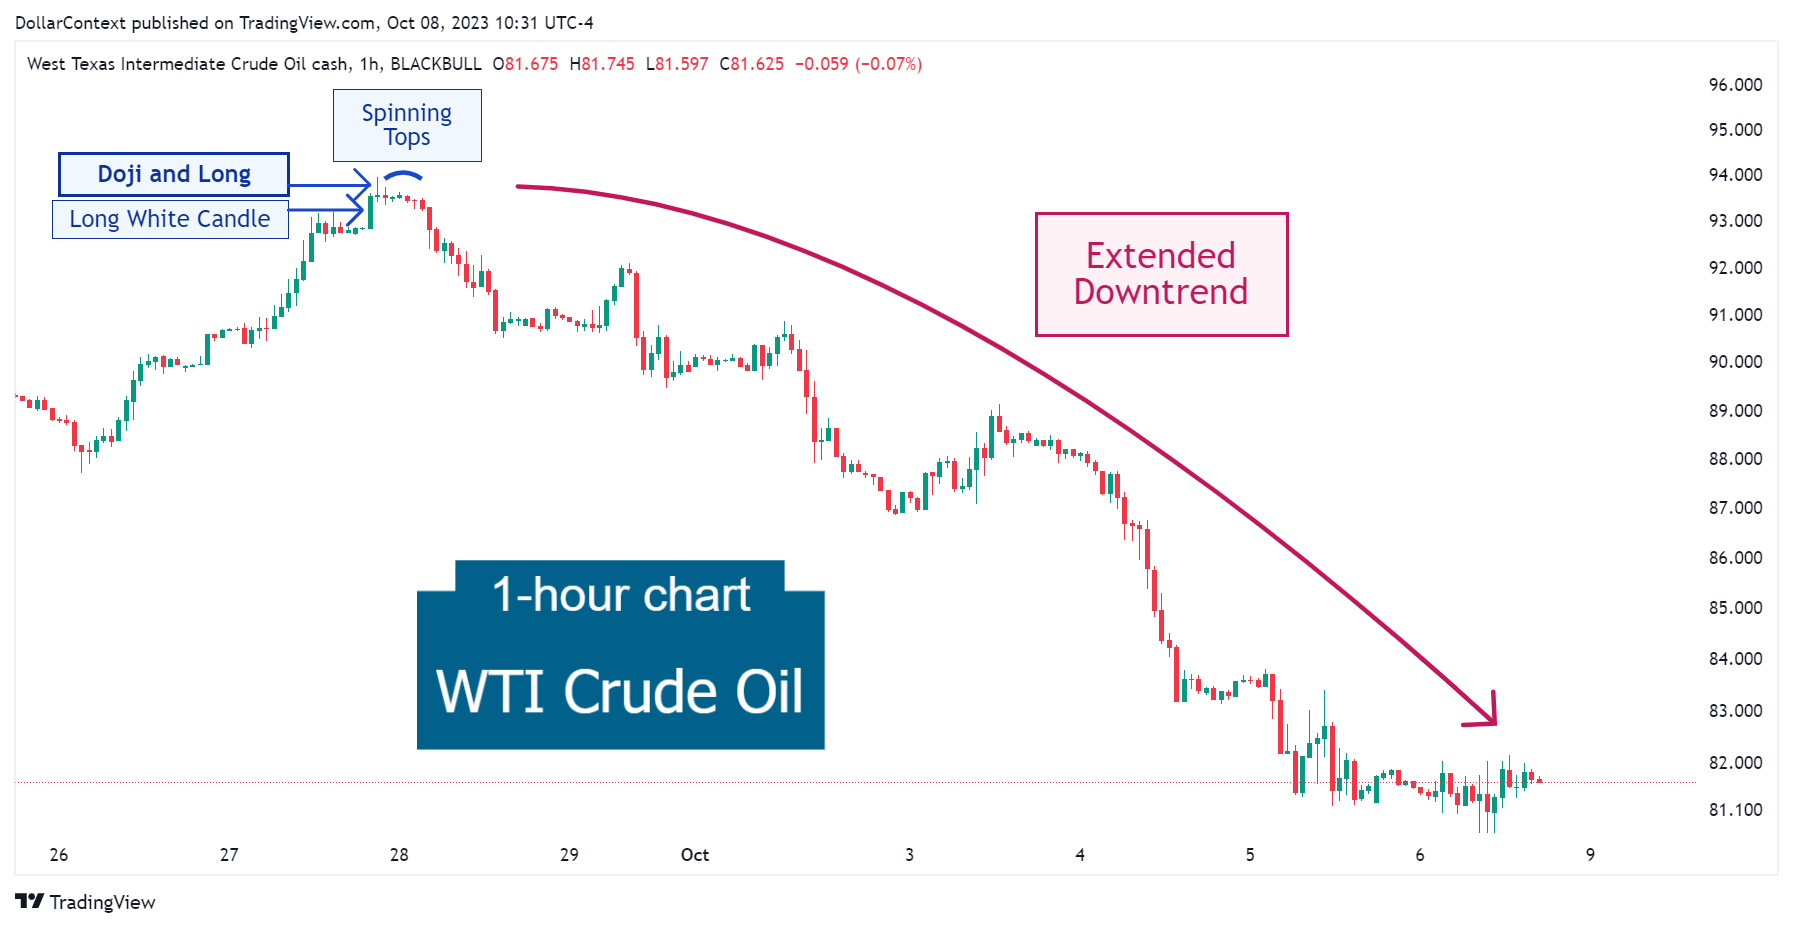
In this article, we will examine the performance of the WTI market after the emergence of a doji pattern.
CANDLESTICK
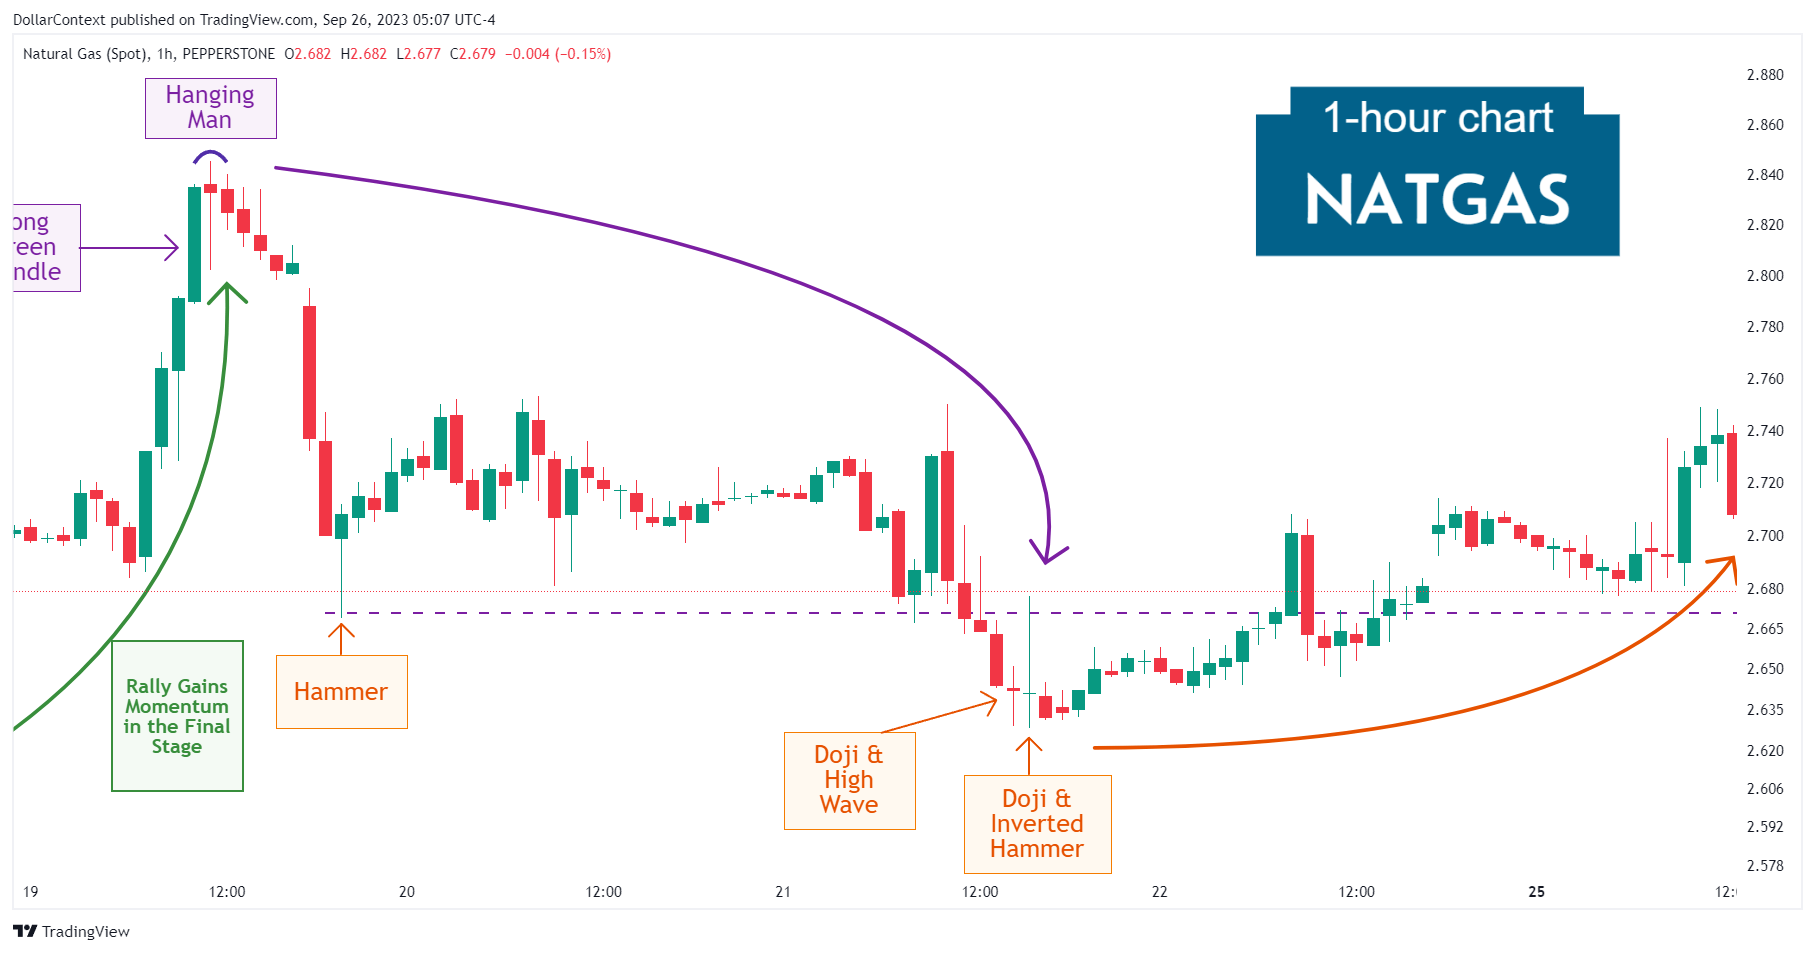
In this article, we will discuss the performance of a highly volatile market in which specific candlestick patterns effectively signaled price tops and bottoms.
CANDLESTICK
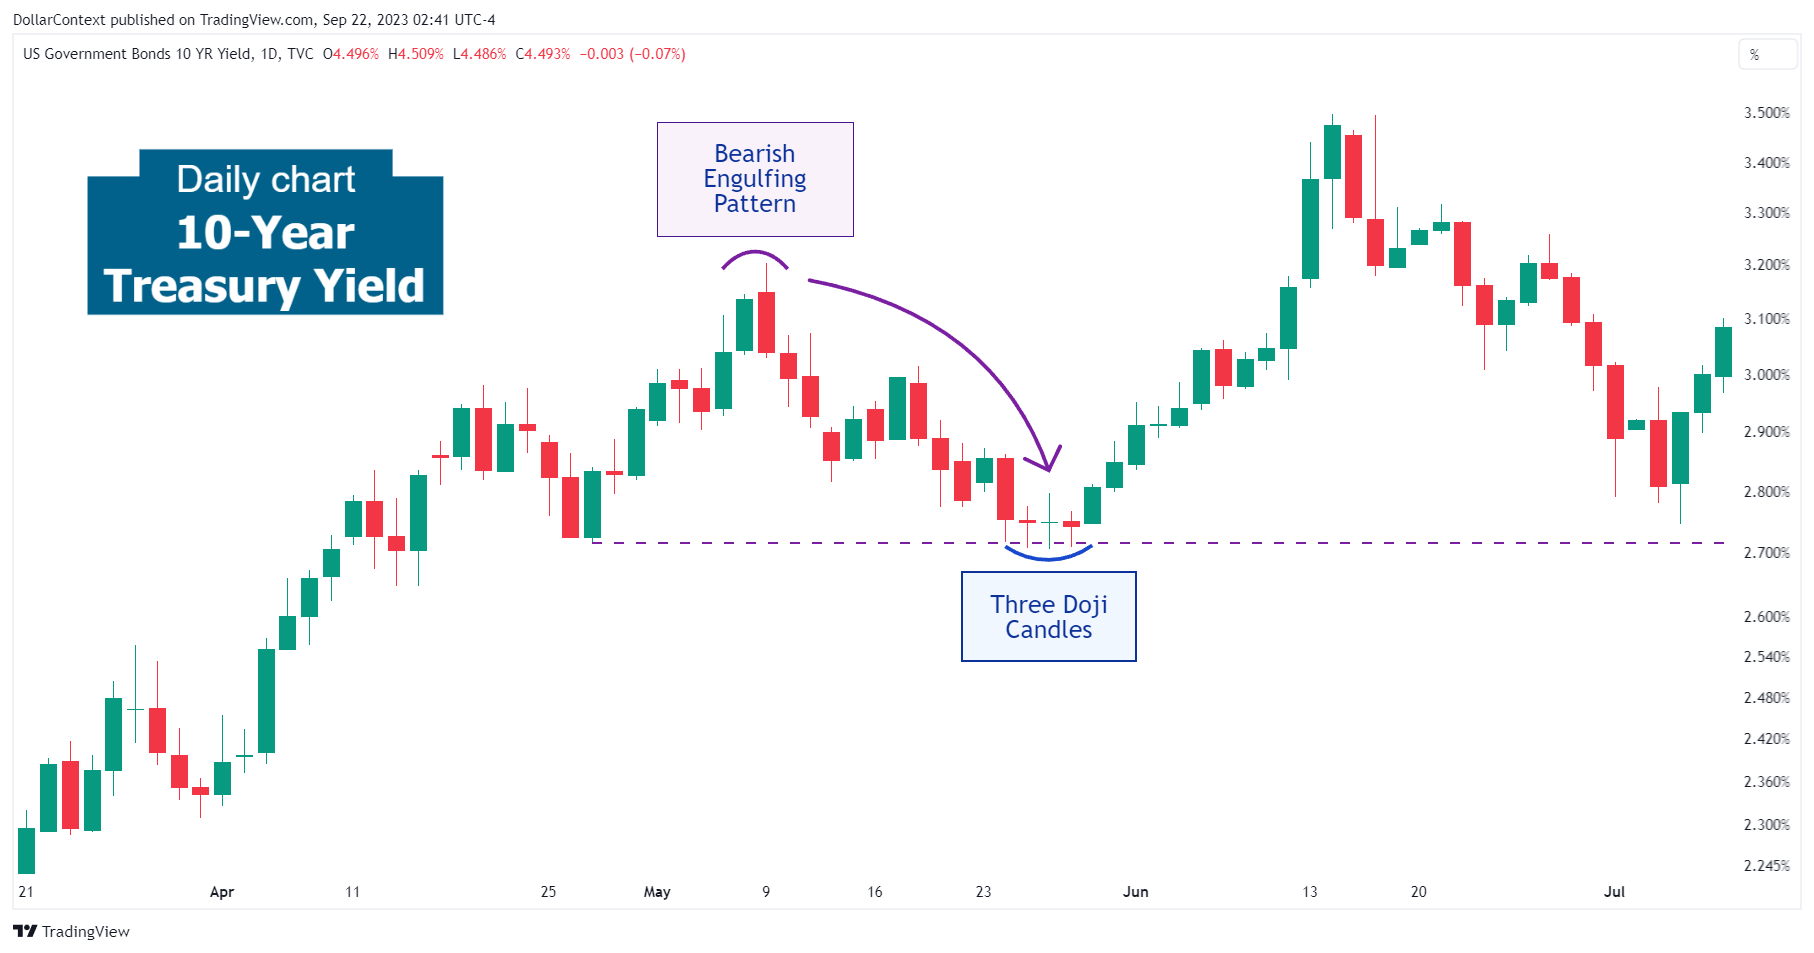
Following the appearance of the bearish engulfing pattern, there was a high likelihood of either a sideways trading range or a minor retracement.
USDJPY
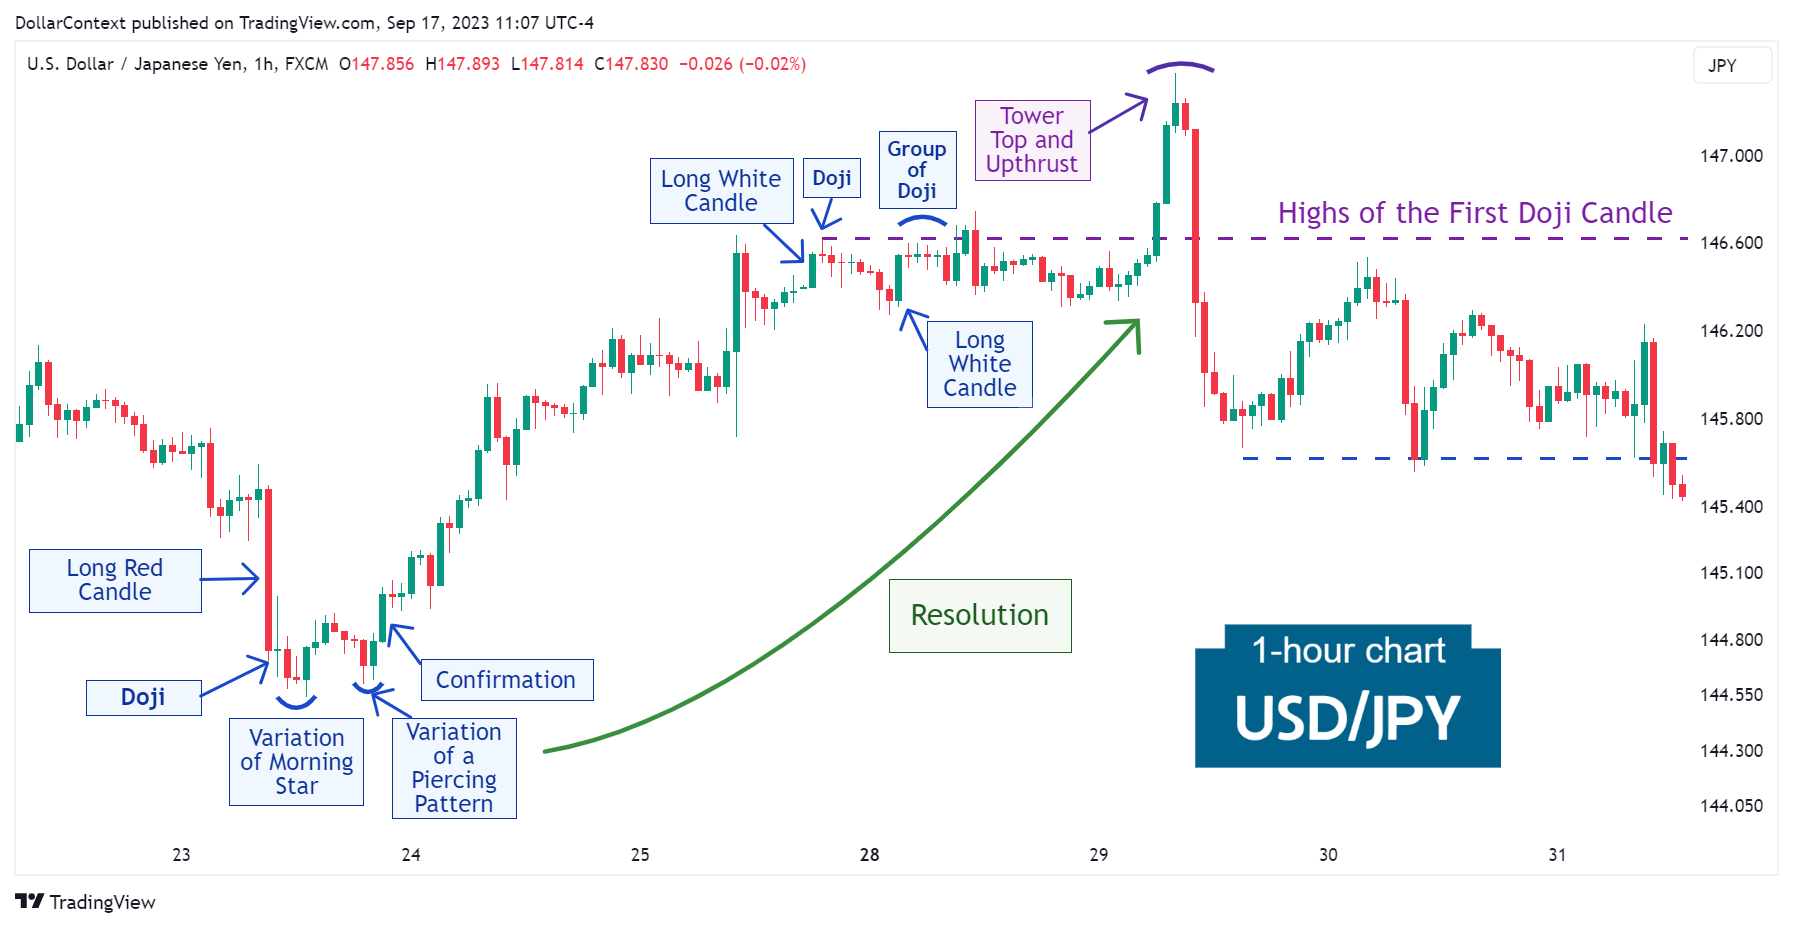
After an extended downtrend, the USD/JPY exhibited an exceptionally long red candle followed by a doji.
CANDLESTICK
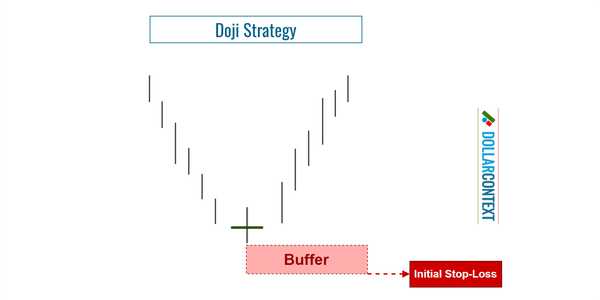
Today, we'll examine a crucial indicator of Japanese candlestick charting: the doji.
DOJI
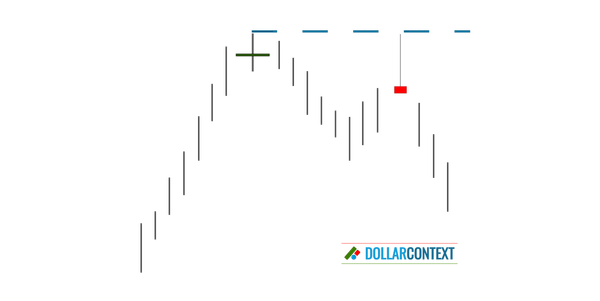
The configuration of a doji candle has resemblances to other candlestick patterns, including spinning tops, stars, and hammers.

DOJI
Five basic types of doji sessions are commonly identified: standard doji, dragonfly, gravestone, long-legged doji, and doji star.
DOJI
While doji candles can be a valuable tool in a trader's arsenal, it's crucial to understand their limitations and the criticisms surrounding them.

DOJI
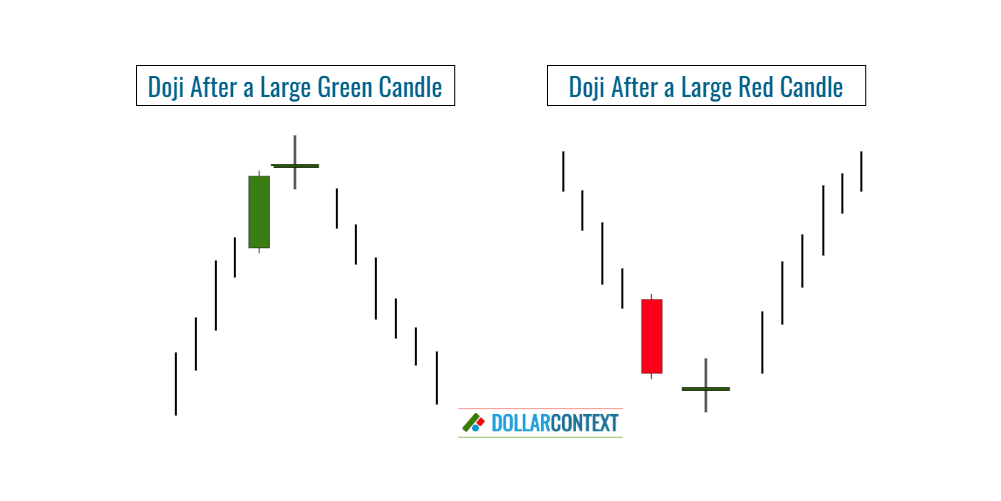
We discuss the implications of a doji candlestick in different market scenarios, including uptrends, downtrends, and trading ranges.