
CANDLESTICK
Case Study 0028: Hammer and Long Lower Shadows (Natural Gas)
In this article, we will examine the performance of the natural gas market after the emergence of a hammer and two long lower shadows.

CANDLESTICK
In this article, we will examine the performance of the natural gas market after the emergence of a hammer and two long lower shadows.
CANDLESTICK
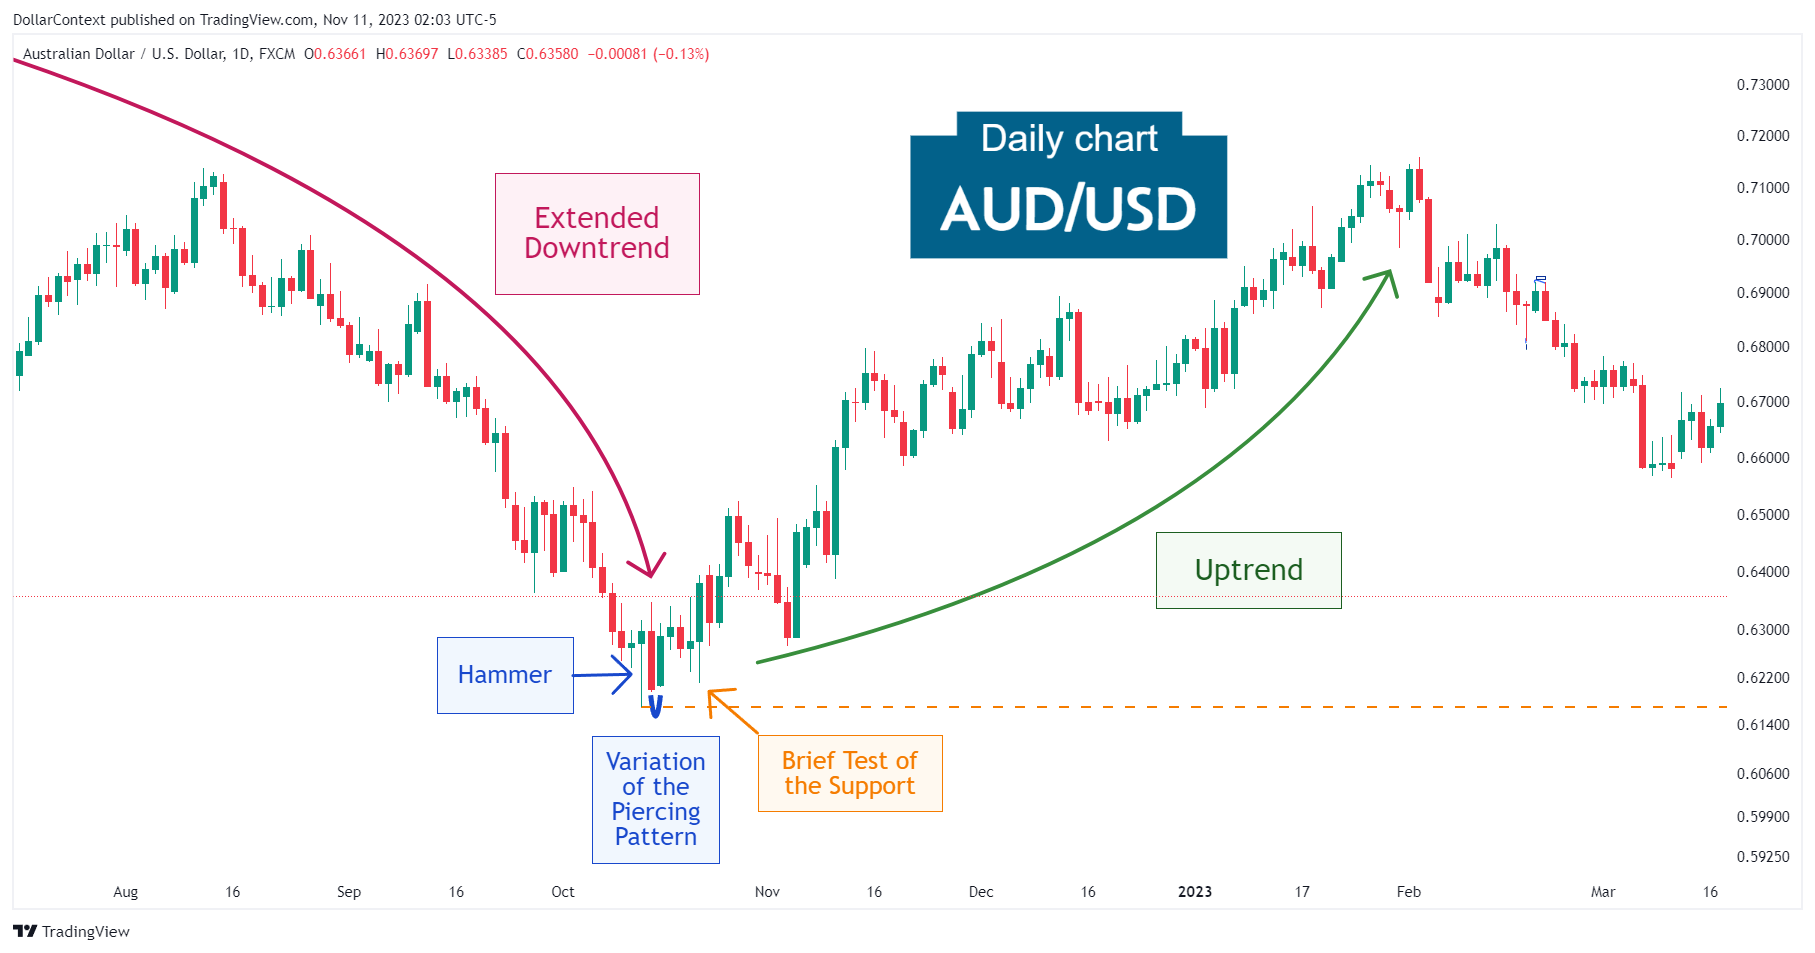
In this article, we will cover the performance of the AUD/USD after the emergence of a hammer and a piercing pattern.
CANDLESTICK
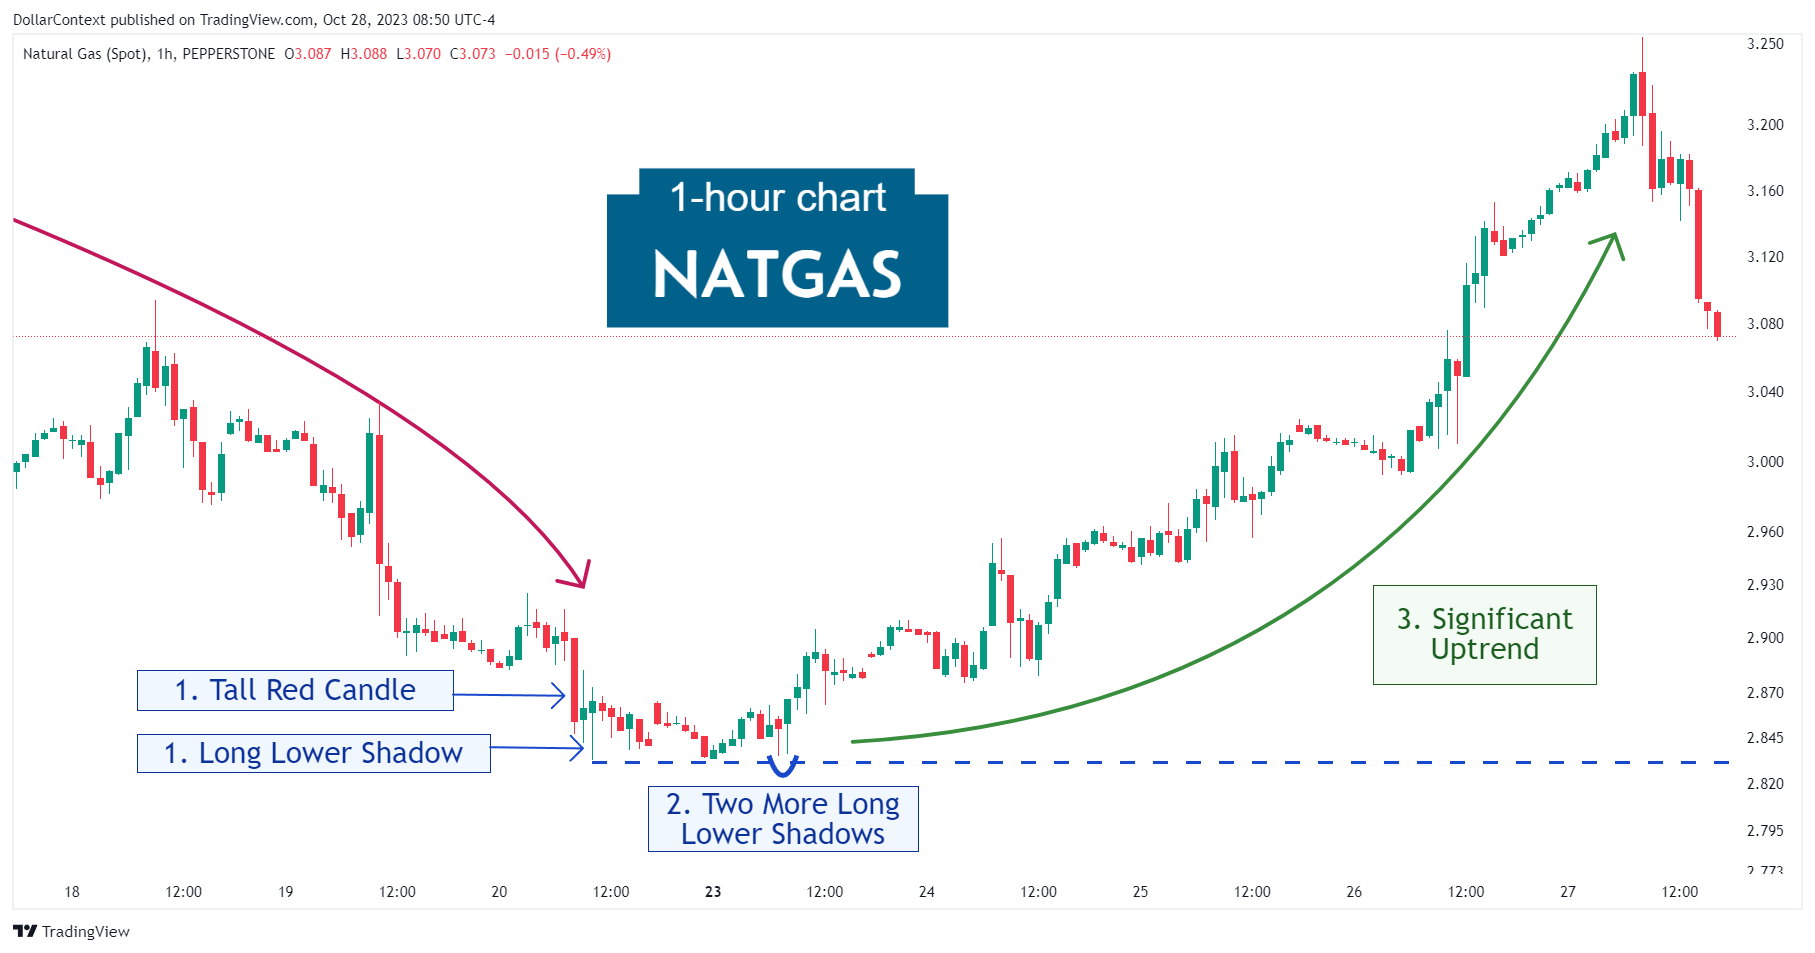
In this article, we will examine the performance of the natural gas market after the emergence of a series of long lower shadows.
CANDLESTICK
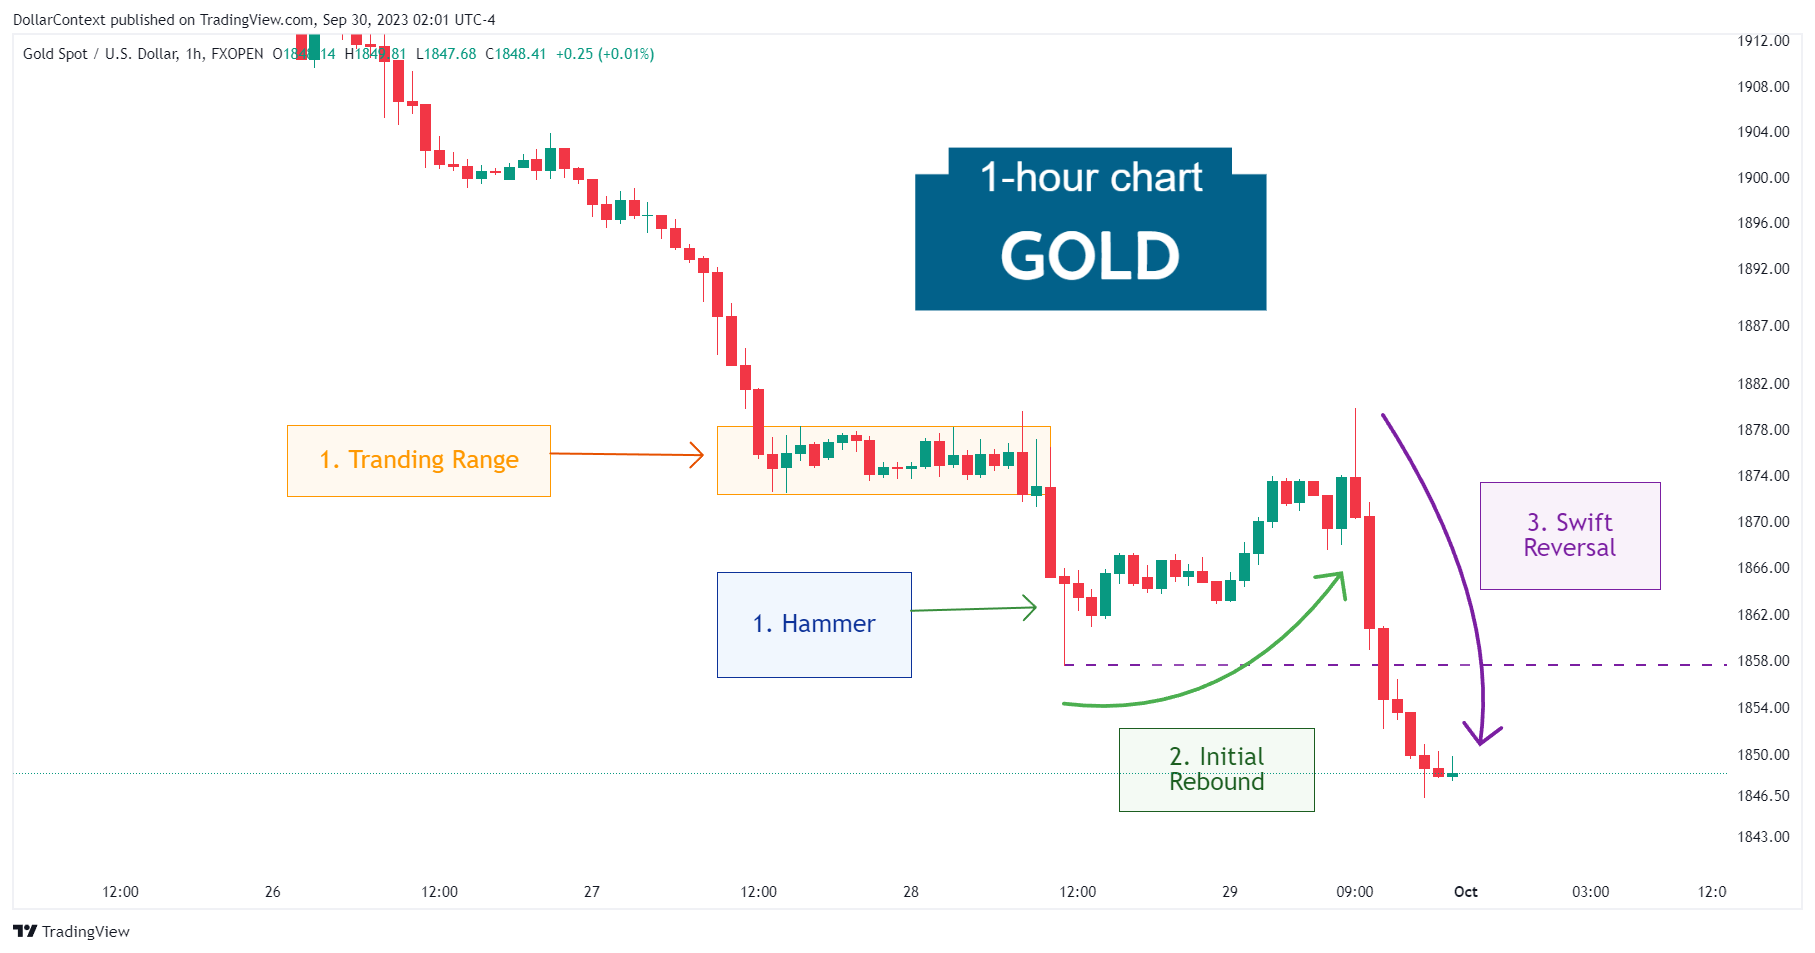
In this article, we will discuss the performance of the gold market after the appearance of a hammer pattern.
CANDLESTICK
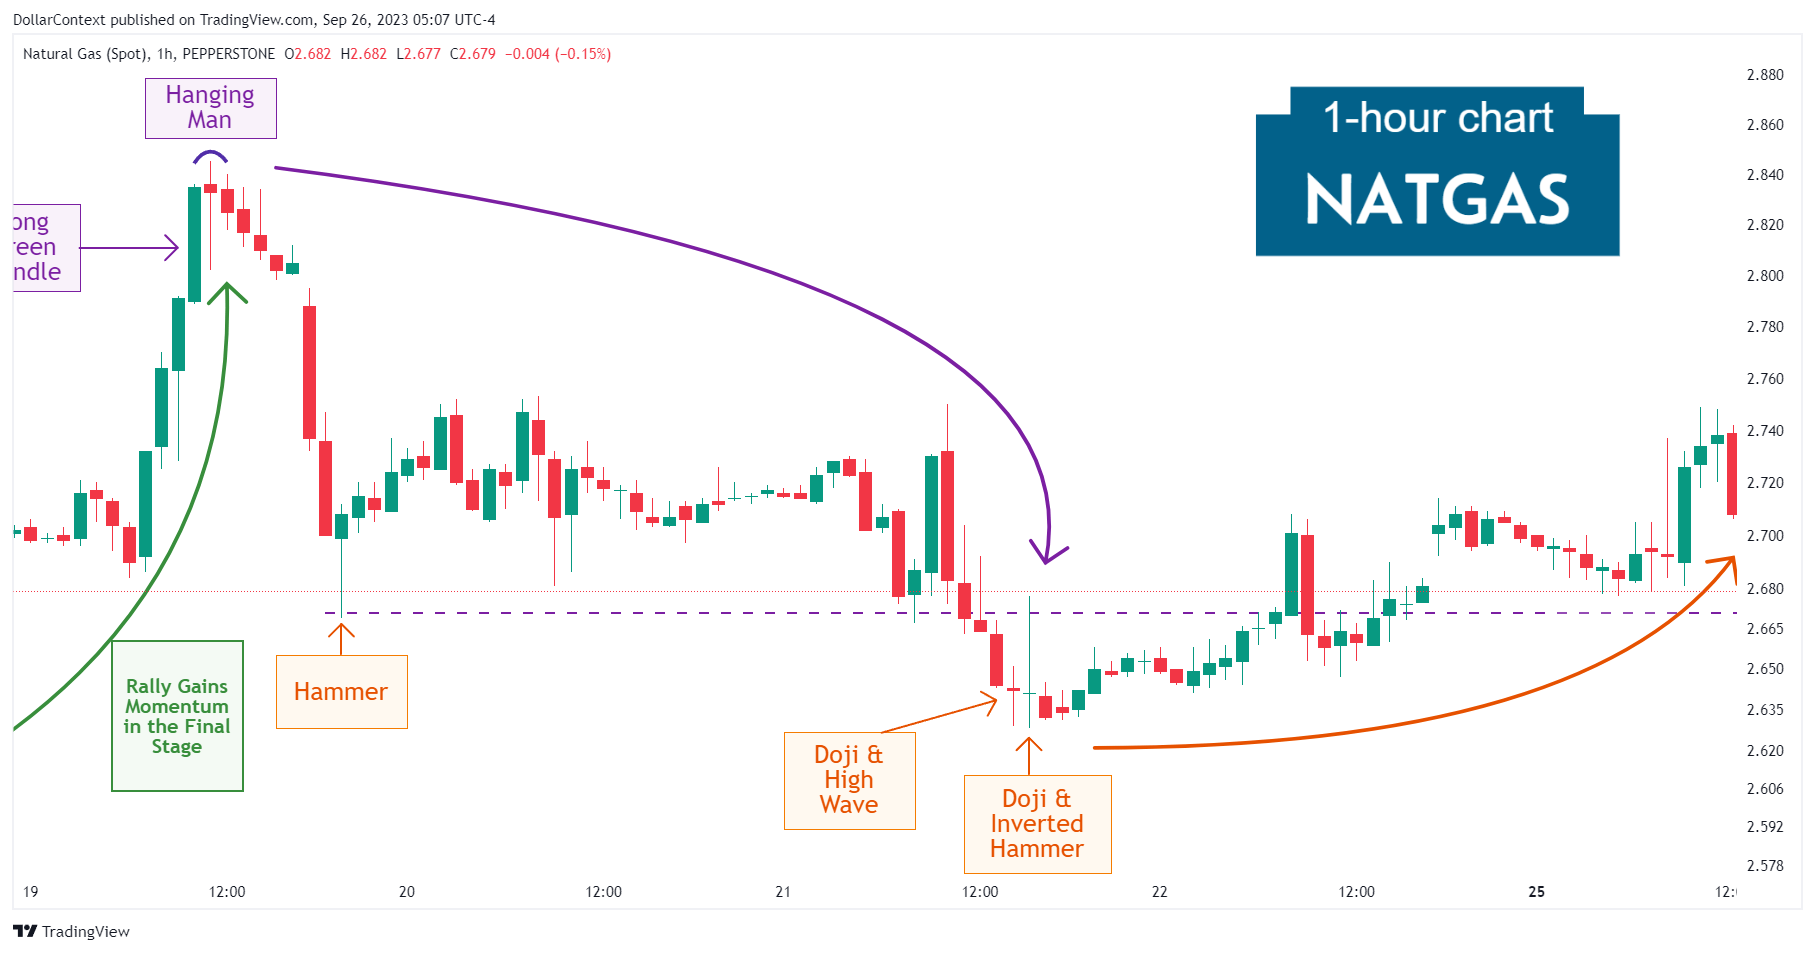
In this article, we will discuss the performance of a highly volatile market in which specific candlestick patterns effectively signaled price tops and bottoms.
HAMMER
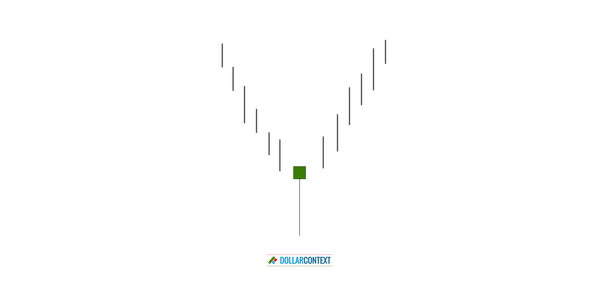
Today, we're going to explore a crucial pattern in the realm of Japanese candlestick analysis: the hammer.
HAMMER
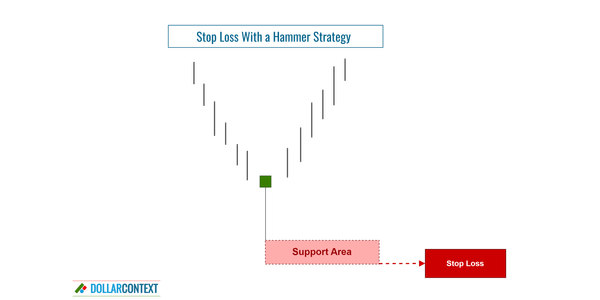
Set the stop-loss level below the low of the hammer pattern to protect against potential downside risk.
HAMMER
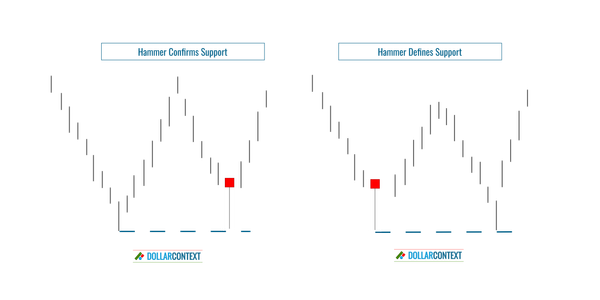
A hammer creates a support area or confirms the credibility of a previously identified support zone.

HAMMER
In this post we cover the psychological implications of a hammer pattern within the domain of Japanese candlestick charts.
HAMMER
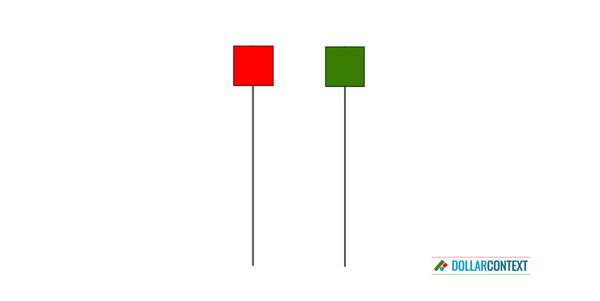
The hammer pattern consists of a candle with a small real body at the upper end of the session and a long lower shadow.