Dark Cloud Cover Strategy: A Comprehensive Tutorial
After either a mature or a sharp uptrend, a dark cloud cover can act as an indicator of reversal. This presents a potential opportunity for traders to establish short positions in the market.
Today, we'll explore a classic component of Japanese candlestick analysis: the dark cloud cover.
Before delving into the specifics of this pattern, it's important to remember two key elements that are common to most candlestick signals, including the dark cloud cover:
- They operate as indicators of a possible trend reversal, implying that the current trend might be nearing its end and a new trend in the opposite direction may begin. For dark cloud cover patterns, the signal always appears following an uptrend.
- These patterns are applicable across all timeframes, including minutes, hours, days, and months.
Contents
1. Shape
There are two main categories of dark cloud covers:
- Optimal dark cloud cover
- Incomplete dark cloud cover
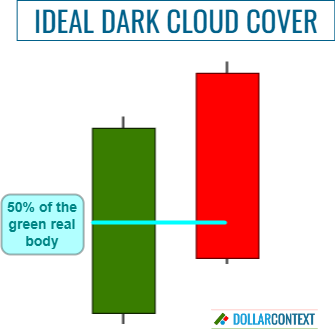
1.1 Optimal Dark Cloud Cover
The shape of a dark cloud cover can be easily recognized. The pattern is a two-candle combination where:
- The initial candle exhibits a substantial white body, usually accompanied by relatively minor lower and upper shadows.
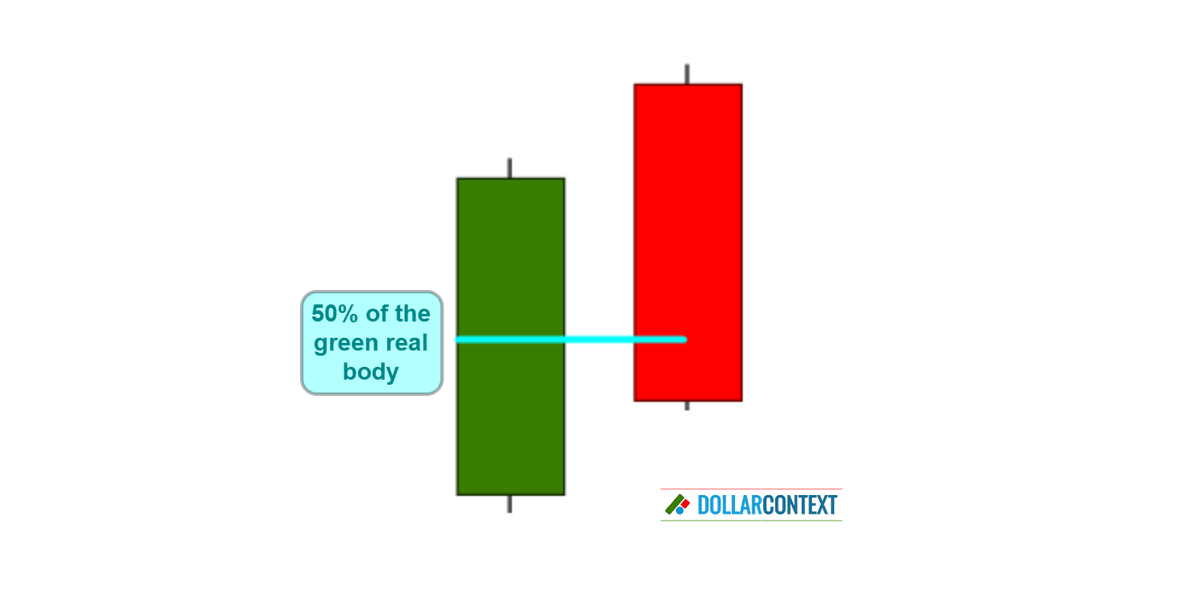
- During the second session, lingering buying pressure pushes the market to open at an elevated level. However, as the session moves forward, prices begin to drop, ultimately leading the market to close below the midpoint of the preceding real body.
The broader the gap between the peak of the first session and the open of the second candle line, the greater the likelihood of a bearish dark cloud cover. In the same vein, the further the close of the second candle penetrates into the range of the initial real body, the stronger the bearish signal suggested by the pattern.
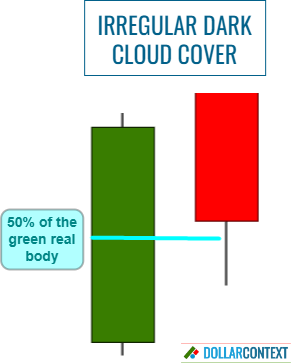
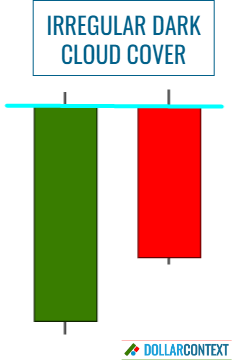
1.2 Incomplete Dark Cloud Cover
The likelihood of finding an optimal dark cloud cover is relatively small, particularly when using lower time frames or low volatile markets. There are, however, two "irregular" or "incomplete" versions of the standard dark cloud cover. These tend to be more prevalent in the majority of markets.
In some cases, the second session fails to close below the halfway point of the first real body.
In other instances, the second session begins below the peak of the first candle, or it might even start at the same level as the close of the first real body.
Initially, an incomplete dark cloud cover presents less bearish potential compared to an ideal one. However, it's crucial to remember that the likelihood of a reversal following this pattern isn't solely dependent on the shape but also on the context within which the pattern emerges. In other words, when evaluating a dark cloud cover, it's this combination of both shape and context that should be considered.
2. Context
The context in which a dark cloud cover arises is equally important, if not more so, than the shape of the two-candle combination itself.
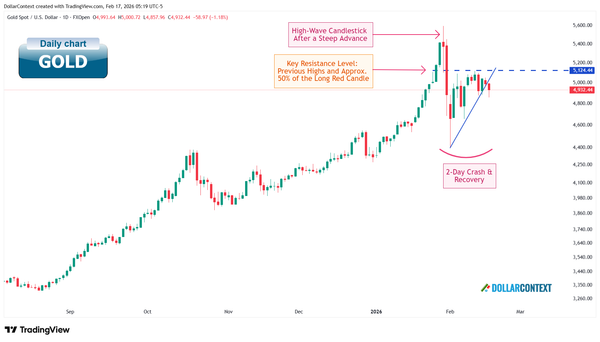
After either a mature or a sharp uptrend, a dark cloud cover can act as an indicator of reversal. This presents a potential opportunity for traders to establish short positions in the market.
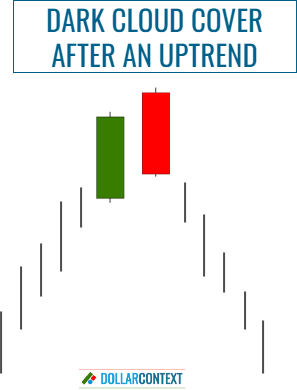
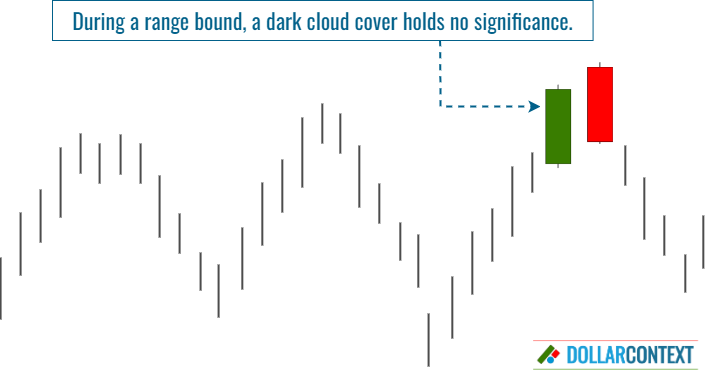
The probability of a reversal tends to increase in line with the strength of the preceding trend. If the market is trading in a sideways manner, a dark cloud cover maintains neutrality and doesn't hold the capacity to serve as a relevant trading signal.
When assessing the relevance of a dark cloud cover, the following factors are critical as well:
- Resistance Area: If the pattern appears in a resistance area, the bearish potential of the dark cloud cover escalates dramatically (see examples 6.1 and 6.2 down below.)
- Additional Candlestick Patterns: If one or more candlestick patterns have previously emerged around the same price level, the likelihood of a reversal after the dark cloud cover increases (see example 6.3.)
- Relative Size of the Candles: The relative length of the two real bodies of the pattern holds significance. These candles should exhibit considerable size when compared to the preceding candle lines.
- Overbought Market: The greater the extent to which a market is overbought, the higher the likelihood of a reversal occurring (see example 6.2.)
3. Psychology
This pattern implies a shift in market sentiment from bullish to bearish. Initially, a strong upward trend (depicted by the first bullish candle) gives way to doubt as the next candle opens higher but closes significantly lower, signifying growing bearish sentiment.
A dark cloud cover reflects the psychological shift from confidence to uncertainty among traders, potentially signaling a broader trend reversal.
4. Stop-loss
Ensure that you set an appropriate stop-loss when using a dark cloud cover strategy by following these steps.
First, confirm the occurrence of the pattern after a robust or prolonged bull market. Refrain from using it as a trading signal during a market phase with limited fluctuations.
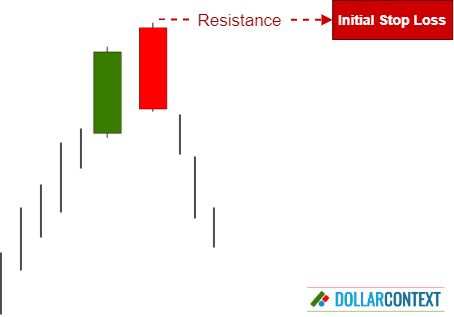
A dark cloud cover becomes resistance. This pattern always generates, or strengthens, a resistance zone consisting of the highs of the two-candle combination. This resistance level will act as your main benchmark for setting the stop-loss.
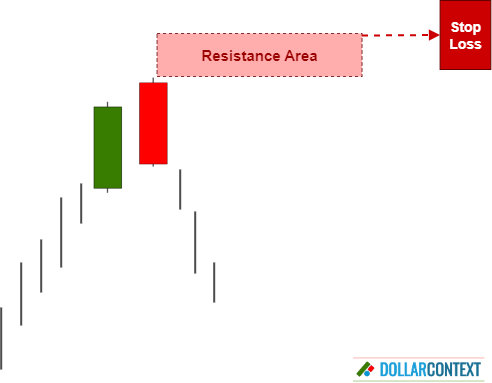
Then, consider adding a buffer to prevent being stopped out during a volatile session or a false breakout.
Finally, determine whether to base your stop on a close or on the intra-session price action. In general, we recommend using a stop on the close.
Remember, vigilant market monitoring is necessary, and adjustments should be made in response to prevailing market conditions. As your trade progresses, you may identify additional candlestick patterns that reinforce the initial resistance area. In these instances, slight modifications to your stop-loss level might be warranted to better align with the new situation.
5. Profit Target
Generally, candlestick patterns supply reversal signals and entry points, but they don't explicitly indicate profit-taking price targets. For this purpose, you must use different techniques, such as conventional chart patterns, Fibonacci retracements, or simple moving averages.
However, if you're engaged in a beneficial trade and a new candlestick pattern appears, suggesting a potential reversal in the opposite direction, you might view this new pattern as a signal to exit the trade.
6. Examples
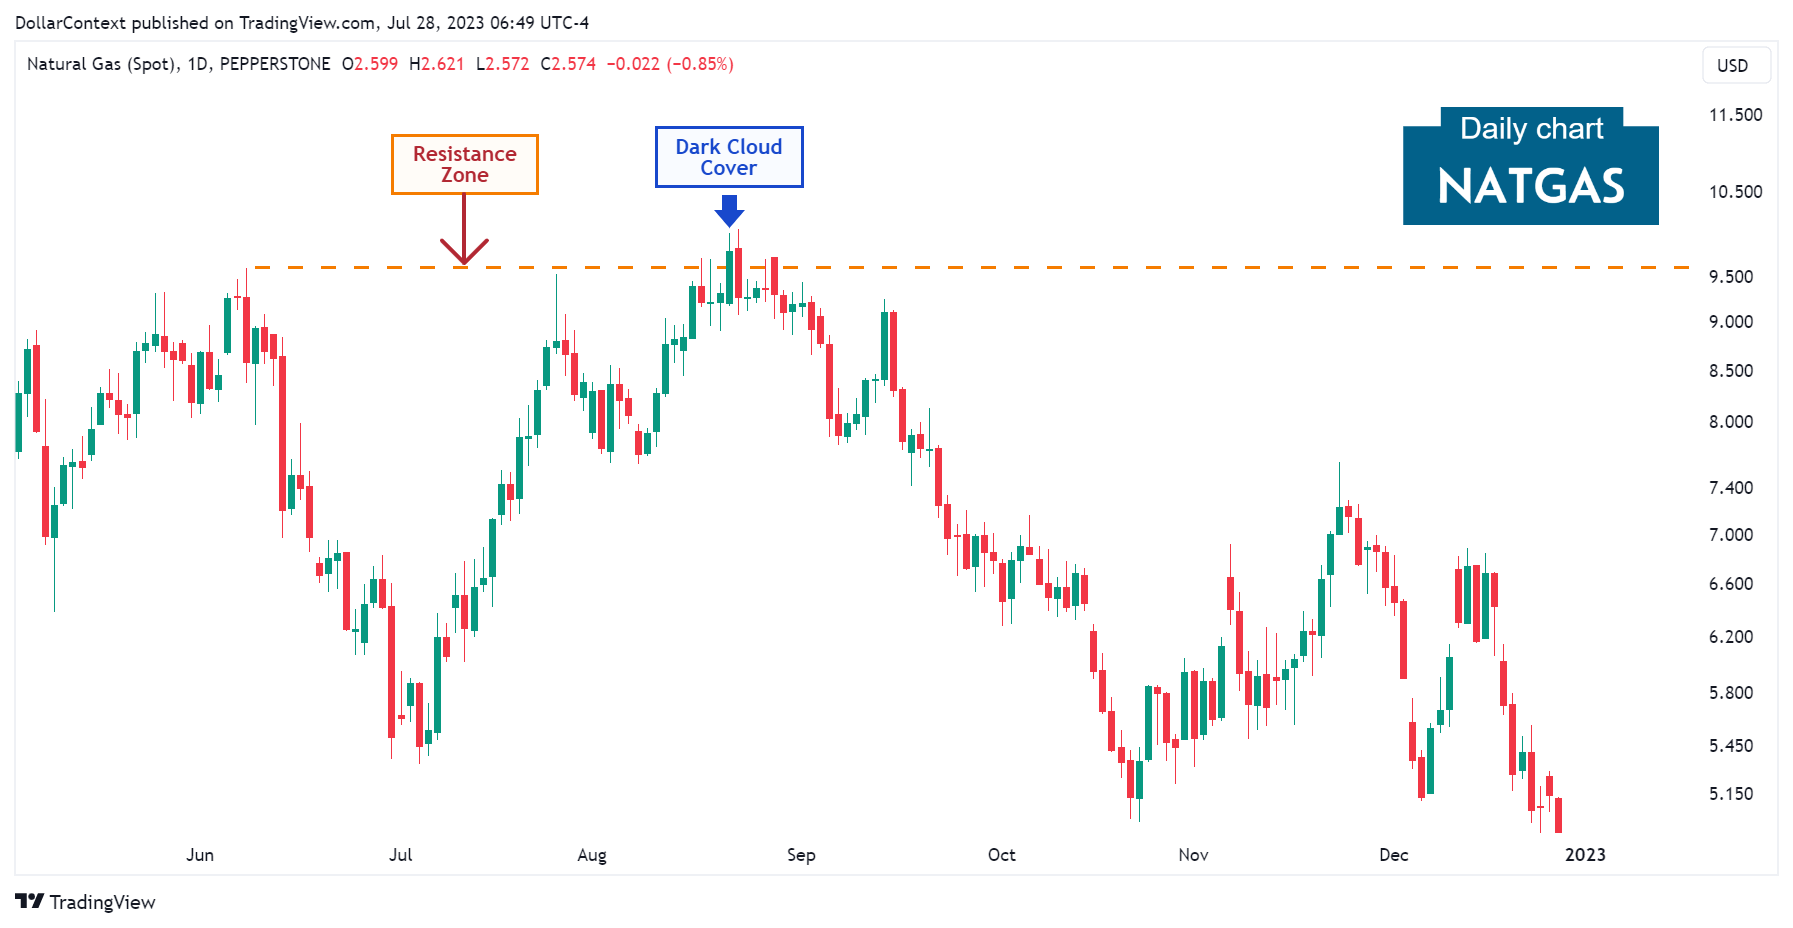
6.1 Natural Gas
The daily chart of natural gas provided below depicts a dark cloud cover pattern. Despite being an incomplete dark cloud cover (the second session didn't open above the highs of the first candle), its emergence in a crucial resistance zone coupled with the fact that the second candle closes deep within the range of the first session reaffirms the bearish implication of this pattern.
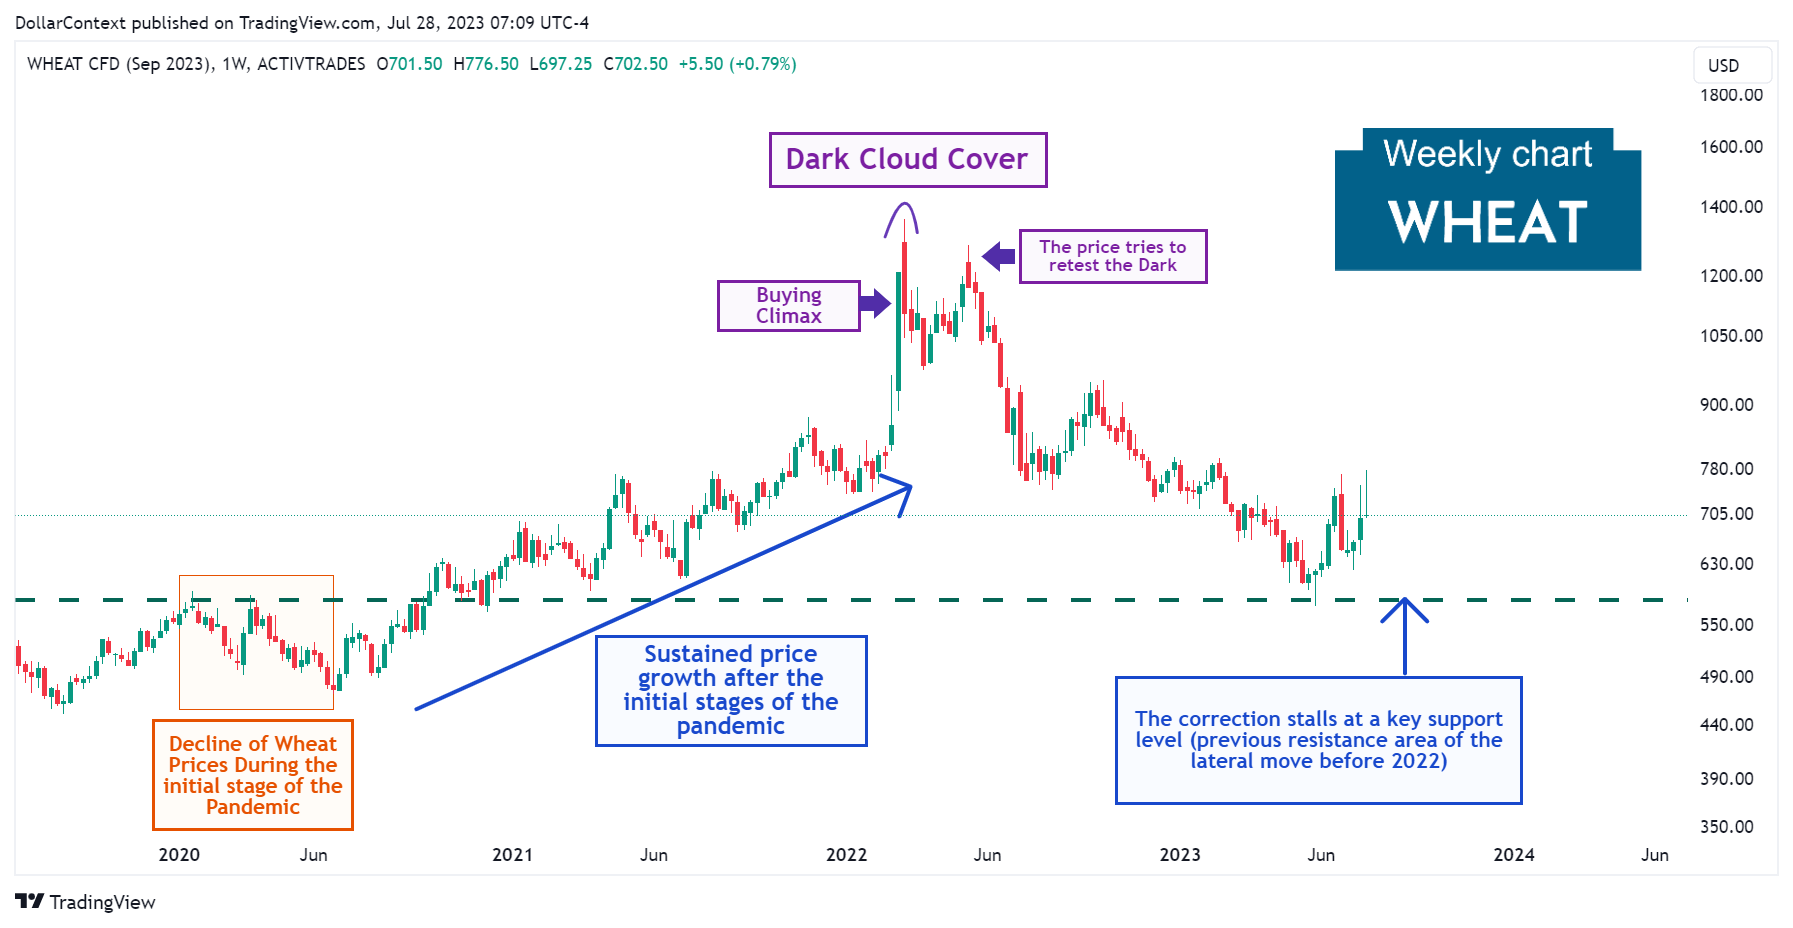
6.2 Wheat
In March 2022, wheat prices exhibited a rapid surge following a well-established bull market. The next trading session opens even higher, demonstrating extreme optimism in the market. However, as the weekly session progresses, a shift in market sentiment occurs, and the bears begin to take control.
The fact that the second candle opens at a much higher level than the initial session, while the bulls were unable to maintain those elevated prices, underscores the bearish significance of the pattern. Adding further to this gloomy scenario, the dark cloud cover happened to surface at a crucial historical resistance level (not shown in the chart). This resistance was set in March 2008, just before the outset of the 2008 financial crisis.
Also, observe how the dark cloud cover establishes a resistance zone that was tested later on.
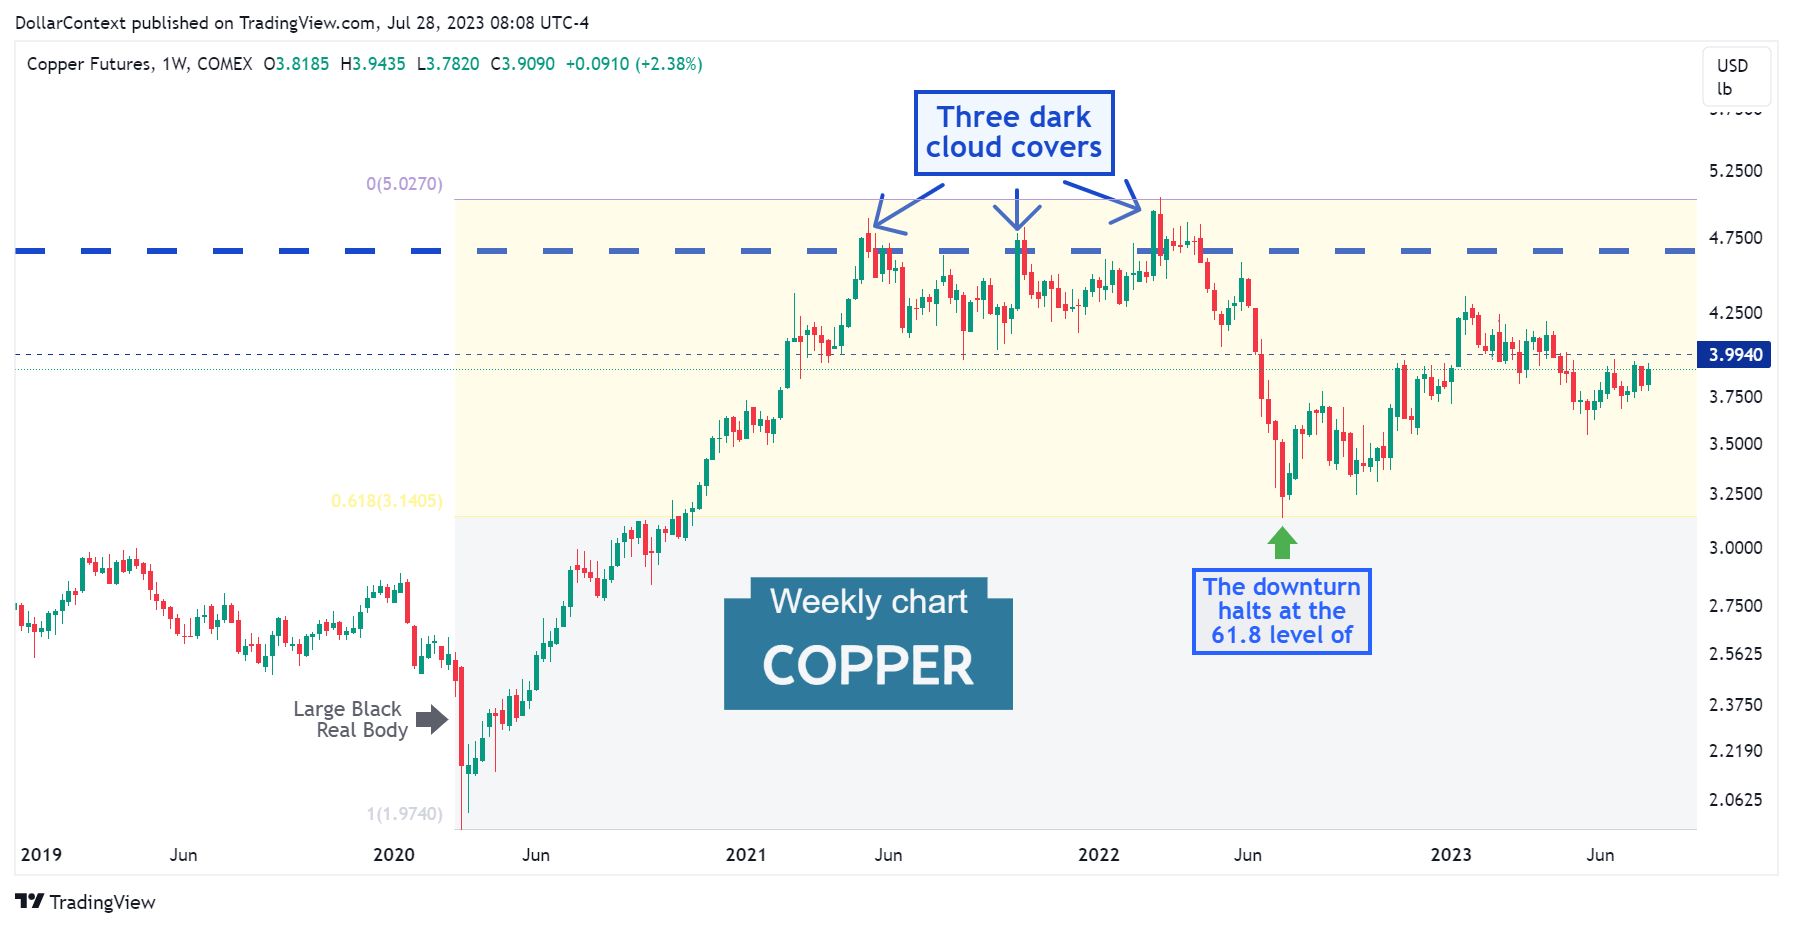
6.3 Copper
This example illustrates the importance of identifying a series of two or more candlestick patterns to evaluate the potential of a candlestick combination.
Observe how the copper chart below displays three dark cloud covers. Despite these patterns being irregular, they mutually reinforce each other as a reversal signal, thereby establishing a more robust resistance zone.
6.4 More Examples
- Case Study 0014: Shooting Star and Dark Cloud Cover at a Major Resistance Level (Natural Gas)
- Case Study 0015: Dark Cloud Cover and Shooting Star Herald the End of a Correction (S&P 500)
- Case Study 0018: Dark Cloud Cover and Hanging Man After a Sharp Ascent (USD/JPY)
- Case Study 0023: Dark Cloud Cover and Spinning Tops (Natural Gas)